|
|
市場調査レポート
商品コード
1634352
アーユルヴェーダの世界市場(2025年~2029年)Global Ayurveda Market 2025-2029 |
||||||

|
|||||||
カスタマイズ可能
|
|||||||


| アーユルヴェーダの世界市場(2025年~2029年) |
|
出版日: 2025年01月03日
発行: TechNavio
ページ情報: 英文 189 Pages
納期: 即納可能
|

全表示
- 概要
- 図表
- 目次
アーユルヴェーダ市場(2025年~2029年)
世界のアーユルヴェーダの市場規模は、2024年~2029年に112億9,900万米ドルに達し、予測期間中のCAGRは20.1%で成長すると予測されます。当レポートでは、アーユルヴェーダ市場の全体的な分析、市場規模・予測、動向、成長促進要因、課題、約25のベンダーを網羅したベンダー分析などを掲載しています。
本レポートは、現在の市場シナリオ、最新動向と促進要因、市場環境全体に関する最新分析を提供しています。市場は、アーユルヴェーダ医薬品の副作用の少なさ、天然医薬品への需要の高まり、新製品の発売増加などが牽引しています。
| 市場範囲 | |
|---|---|
| 基準年 | 2025年 |
| 終了年 | 2029年 |
| 予測期間 | 2025年~2029年 |
| 成長モメンタム | 加速 |
| 前年比2025年 | 16.5% |
| CAGR | 20.1% |
| 増分額 | 112億9,900万米ドル |
本調査では、今後数年間のアーユルヴェーダ市場の成長を牽引する主な要因の1つとして、ハーブおよび天然製品への傾倒を挙げています。また、健康上の利点を実証する臨床研究の増加や、個別化されたハーブ医薬品への需要の高まりは、市場の大きな需要につながります。
目次
第1章 エグゼクティブサマリー
- 市場概要
第2章 Technavioの分析
- 価格感度・ライフサイクル・顧客購入バスケット・採用率・購入基準の分析
- インプットの重要性と差別化の要因
- ディスラプションの要因
- 促進要因と課題の影響
第3章 市場情勢
- 市場エコシステム
- 市場の特徴
- バリューチェーン分析
第4章 市場規模
- 市場の定義
- 市場セグメント分析
- 市場規模(2024年)
- 市場の見通し(2024年~2029年)
第5章 市場規模実績
- アーユルヴェーダの世界市場(2019年~2023年)
- タイプセグメント分析(2019年~2023年)
- 用途セグメント分析(2019年~2023年)
- 地域セグメント分析(2019年~2023年)
- 国セグメント分析(2019年~2023年)
第6章 定性分析
- AIの影響:アーユルヴェーダの世界市場
第7章 ファイブフォース分析
- ファイブフォースの要約
- 買い手の交渉力
- 供給企業の交渉力
- 新規参入業者の脅威
- 代替品の脅威
- 競争の脅威
- 市況
第8章 市場セグメンテーション:タイプ別
- 市場セグメント
- 比較:タイプ別
- 製品:市場規模と予測(2024年~2029年)
- サービス:市場規模と予測(2024年~2029年)
- 市場機会:タイプ別
第9章 市場セグメンテーション:用途別
- 市場セグメント
- 比較:用途別
- パーソナルケア:市場規模と予測(2024年~2029年)
- 薬用:市場規模と予測(2024年~2029年)
- 市場機会:用途別
第10章 顧客情勢
- 顧客情勢の概要
第11章 地域別情勢
- 地域別セグメンテーション
- 地域別比較
- アジア:市場規模と予測(2024年~2029年)
- 北米:市場規模と予測(2024年~2029年)
- 欧州:市場規模と予測(2024年~2029年)
- 世界のその他の地域:市場規模と予測(2024年~2029年)
- インド:市場規模と予測(2024年~2029年)
- 米国:市場規模と予測(2024年~2029年)
- インドネシア:市場規模と予測(2024年~2029年)
- オランダ:市場規模と予測(2024年~2029年)
- アラブ首長国連邦:市場規模と予測(2024年~2029年)
- ネパール:市場規模と予測(2024年~2029年)
- フランス:市場規模と予測(2024年~2029年)
- スイス:市場規模と予測(2024年~2029年)
- サウジアラビア:市場規模と予測(2024年~2029年)
- ブラジル:市場規模と予測(2024年~2029年)
- 市場機会:地域情勢別
第12章 促進要因・課題・機会・抑制要因
- 市場促進要因
- 市場の課題
- 促進要因と課題の影響
- 市場の機会・抑制要因
第13章 競合情勢
- 概要
- 競合情勢
- ディスラプションの状況
- 業界のリスク
第14章 競合分析
- 企業プロファイル
- 企業ランキング指数
- 企業の市場ポジショニング
- BACFO Pharmaceuticals India Ltd.
- Charak Pharma Pvt. Ltd.
- Dabur India Ltd.
- Emami Ltd
- Himalaya Wellness Co.
- Herbalhillswellness
- Maharishi Ayurveda
- Patanjali Ayurved Ltd.
- Polycare Herbals
- shahnaz Husain
- Shathayu Ayurveda Clinic
- Shree Baidyanath Ayurved Bhawan Pvt., Ltd
- Srisritattva
- Unilever PLC
- Vicco Laboratories
第15章 付録
Exhibits:
- Exhibits1: Executive Summary - Chart on Market Overview
- Exhibits2: Executive Summary - Data Table on Market Overview
- Exhibits3: Executive Summary - Chart on Global Market Characteristics
- Exhibits4: Executive Summary - Chart on Market By Geographical Landscape
- Exhibits5: Executive Summary - Chart on Market Segmentation by Type
- Exhibits6: Executive Summary - Chart on Market Segmentation by Application
- Exhibits7: Executive Summary - Chart on Incremental Growth
- Exhibits8: Executive Summary - Data Table on Incremental Growth
- Exhibits9: Executive Summary - Chart on Company Market Positioning
- Exhibits10: Analysis of price sensitivity, lifecycle, customer purchase basket, adoption rates, and purchase criteria
- Exhibits11: Overview on criticality of inputs and factors of differentiation
- Exhibits12: Overview on factors of disruption
- Exhibits13: Impact of drivers and challenges in 2024 and 2029
- Exhibits14: Parent Market
- Exhibits15: Data Table on - Parent Market
- Exhibits16: Market characteristics analysis
- Exhibits17: Value chain analysis
- Exhibits18: Offerings of companies included in the market definition
- Exhibits19: Market segments
- Exhibits20: Chart on Global - Market size and forecast 2024-2029 ($ million)
- Exhibits21: Data Table on Global - Market size and forecast 2024-2029 ($ million)
- Exhibits22: Chart on Global Market: Year-over-year growth 2024-2029 (%)
- Exhibits23: Data Table on Global Market: Year-over-year growth 2024-2029 (%)
- Exhibits24: Historic Market Size - Data Table on Global Ayurveda Market 2019 - 2023 ($ million)
- Exhibits25: Historic Market Size - Type Segment 2019 - 2023 ($ million)
- Exhibits26: Historic Market Size - Application Segment 2019 - 2023 ($ million)
- Exhibits27: Historic Market Size - Geography Segment 2019 - 2023 ($ million)
- Exhibits28: Historic Market Size - Country Segment 2019 - 2023 ($ million)
- Exhibits29: Five forces analysis - Comparison between 2024 and 2029
- Exhibits30: Bargaining power of buyers - Impact of key factors 2024 and 2029
- Exhibits31: Bargaining power of suppliers - Impact of key factors in 2024 and 2029
- Exhibits32: Threat of new entrants - Impact of key factors in 2024 and 2029
- Exhibits33: Threat of substitutes - Impact of key factors in 2024 and 2029
- Exhibits34: Threat of rivalry - Impact of key factors in 2024 and 2029
- Exhibits35: Chart on Market condition - Five forces 2024 and 2029
- Exhibits36: Chart on Type - Market share 2024-2029 (%)
- Exhibits37: Data Table on Type - Market share 2024-2029 (%)
- Exhibits38: Chart on Comparison by Type
- Exhibits39: Data Table on Comparison by Type
- Exhibits40: Chart on Products - Market size and forecast 2024-2029 ($ million)
- Exhibits41: Data Table on Products - Market size and forecast 2024-2029 ($ million)
- Exhibits42: Chart on Products - Year-over-year growth 2024-2029 (%)
- Exhibits43: Data Table on Products - Year-over-year growth 2024-2029 (%)
- Exhibits44: Chart on Services - Market size and forecast 2024-2029 ($ million)
- Exhibits45: Data Table on Services - Market size and forecast 2024-2029 ($ million)
- Exhibits46: Chart on Services - Year-over-year growth 2024-2029 (%)
- Exhibits47: Data Table on Services - Year-over-year growth 2024-2029 (%)
- Exhibits48: Market opportunity by Type ($ million)
- Exhibits49: Data Table on Market opportunity by Type ($ million)
- Exhibits50: Chart on Application - Market share 2024-2029 (%)
- Exhibits51: Data Table on Application - Market share 2024-2029 (%)
- Exhibits52: Chart on Comparison by Application
- Exhibits53: Data Table on Comparison by Application
- Exhibits54: Chart on Personal care - Market size and forecast 2024-2029 ($ million)
- Exhibits55: Data Table on Personal care - Market size and forecast 2024-2029 ($ million)
- Exhibits56: Chart on Personal care - Year-over-year growth 2024-2029 (%)
- Exhibits57: Data Table on Personal care - Year-over-year growth 2024-2029 (%)
- Exhibits58: Chart on Medicinal - Market size and forecast 2024-2029 ($ million)
- Exhibits59: Data Table on Medicinal - Market size and forecast 2024-2029 ($ million)
- Exhibits60: Chart on Medicinal - Year-over-year growth 2024-2029 (%)
- Exhibits61: Data Table on Medicinal - Year-over-year growth 2024-2029 (%)
- Exhibits62: Market opportunity by Application ($ million)
- Exhibits63: Data Table on Market opportunity by Application ($ million)
- Exhibits64: Analysis of price sensitivity, lifecycle, customer purchase basket, adoption rates, and purchase criteria
- Exhibits65: Chart on Market share By Geographical Landscape 2024-2029 (%)
- Exhibits66: Data Table on Market share By Geographical Landscape 2024-2029 (%)
- Exhibits67: Chart on Geographic comparison
- Exhibits68: Data Table on Geographic comparison
- Exhibits69: Chart on Asia - Market size and forecast 2024-2029 ($ million)
- Exhibits70: Data Table on Asia - Market size and forecast 2024-2029 ($ million)
- Exhibits71: Chart on Asia - Year-over-year growth 2024-2029 (%)
- Exhibits72: Data Table on Asia - Year-over-year growth 2024-2029 (%)
- Exhibits73: Chart on North America - Market size and forecast 2024-2029 ($ million)
- Exhibits74: Data Table on North America - Market size and forecast 2024-2029 ($ million)
- Exhibits75: Chart on North America - Year-over-year growth 2024-2029 (%)
- Exhibits76: Data Table on North America - Year-over-year growth 2024-2029 (%)
- Exhibits77: Chart on Europe - Market size and forecast 2024-2029 ($ million)
- Exhibits78: Data Table on Europe - Market size and forecast 2024-2029 ($ million)
- Exhibits79: Chart on Europe - Year-over-year growth 2024-2029 (%)
- Exhibits80: Data Table on Europe - Year-over-year growth 2024-2029 (%)
- Exhibits81: Chart on Rest of World (ROW) - Market size and forecast 2024-2029 ($ million)
- Exhibits82: Data Table on Rest of World (ROW) - Market size and forecast 2024-2029 ($ million)
- Exhibits83: Chart on Rest of World (ROW) - Year-over-year growth 2024-2029 (%)
- Exhibits84: Data Table on Rest of World (ROW) - Year-over-year growth 2024-2029 (%)
- Exhibits85: Chart on India - Market size and forecast 2024-2029 ($ million)
- Exhibits86: Data Table on India - Market size and forecast 2024-2029 ($ million)
- Exhibits87: Chart on India - Year-over-year growth 2024-2029 (%)
- Exhibits88: Data Table on India - Year-over-year growth 2024-2029 (%)
- Exhibits89: Chart on US - Market size and forecast 2024-2029 ($ million)
- Exhibits90: Data Table on US - Market size and forecast 2024-2029 ($ million)
- Exhibits91: Chart on US - Year-over-year growth 2024-2029 (%)
- Exhibits92: Data Table on US - Year-over-year growth 2024-2029 (%)
- Exhibits93: Chart on Indonesia - Market size and forecast 2024-2029 ($ million)
- Exhibits94: Data Table on Indonesia - Market size and forecast 2024-2029 ($ million)
- Exhibits95: Chart on Indonesia - Year-over-year growth 2024-2029 (%)
- Exhibits96: Data Table on Indonesia - Year-over-year growth 2024-2029 (%)
- Exhibits97: Chart on The Netherlands - Market size and forecast 2024-2029 ($ million)
- Exhibits98: Data Table on The Netherlands - Market size and forecast 2024-2029 ($ million)
- Exhibits99: Chart on The Netherlands - Year-over-year growth 2024-2029 (%)
- Exhibits100: Data Table on The Netherlands - Year-over-year growth 2024-2029 (%)
- Exhibits101: Chart on UAE - Market size and forecast 2024-2029 ($ million)
- Exhibits102: Data Table on UAE - Market size and forecast 2024-2029 ($ million)
- Exhibits103: Chart on UAE - Year-over-year growth 2024-2029 (%)
- Exhibits104: Data Table on UAE - Year-over-year growth 2024-2029 (%)
- Exhibits105: Chart on Nepal - Market size and forecast 2024-2029 ($ million)
- Exhibits106: Data Table on Nepal - Market size and forecast 2024-2029 ($ million)
- Exhibits107: Chart on Nepal - Year-over-year growth 2024-2029 (%)
- Exhibits108: Data Table on Nepal - Year-over-year growth 2024-2029 (%)
- Exhibits109: Chart on France - Market size and forecast 2024-2029 ($ million)
- Exhibits110: Data Table on France - Market size and forecast 2024-2029 ($ million)
- Exhibits111: Chart on France - Year-over-year growth 2024-2029 (%)
- Exhibits112: Data Table on France - Year-over-year growth 2024-2029 (%)
- Exhibits113: Chart on Switzerland - Market size and forecast 2024-2029 ($ million)
- Exhibits114: Data Table on Switzerland - Market size and forecast 2024-2029 ($ million)
- Exhibits115: Chart on Switzerland - Year-over-year growth 2024-2029 (%)
- Exhibits116: Data Table on Switzerland - Year-over-year growth 2024-2029 (%)
- Exhibits117: Chart on Saudi Arabia - Market size and forecast 2024-2029 ($ million)
- Exhibits118: Data Table on Saudi Arabia - Market size and forecast 2024-2029 ($ million)
- Exhibits119: Chart on Saudi Arabia - Year-over-year growth 2024-2029 (%)
- Exhibits120: Data Table on Saudi Arabia - Year-over-year growth 2024-2029 (%)
- Exhibits121: Chart on Brazil - Market size and forecast 2024-2029 ($ million)
- Exhibits122: Data Table on Brazil - Market size and forecast 2024-2029 ($ million)
- Exhibits123: Chart on Brazil - Year-over-year growth 2024-2029 (%)
- Exhibits124: Data Table on Brazil - Year-over-year growth 2024-2029 (%)
- Exhibits125: Market opportunity By Geographical Landscape ($ million)
- Exhibits126: Data Tables on Market opportunity By Geographical Landscape ($ million)
- Exhibits127: Impact of drivers and challenges in 2024 and 2029
- Exhibits128: Overview on criticality of inputs and factors of differentiation
- Exhibits129: Overview on factors of disruption
- Exhibits130: Impact of key risks on business
- Exhibits131: Companies covered
- Exhibits132: Company ranking index
- Exhibits133: Matrix on companies position and classification
- Exhibits134: BACFO Pharmaceuticals India Ltd. - Overview
- Exhibits135: BACFO Pharmaceuticals India Ltd. - Product / Service
- Exhibits136: BACFO Pharmaceuticals India Ltd. - Key offerings
- Exhibits137: SWOT
- Exhibits138: Charak Pharma Pvt. Ltd. - Overview
- Exhibits139: Charak Pharma Pvt. Ltd. - Product / Service
- Exhibits140: Charak Pharma Pvt. Ltd. - Key offerings
- Exhibits141: SWOT
- Exhibits142: Dabur India Ltd. - Overview
- Exhibits143: Dabur India Ltd. - Business segments
- Exhibits144: Dabur India Ltd. - Key news
- Exhibits145: Dabur India Ltd. - Key offerings
- Exhibits146: Dabur India Ltd. - Segment focus
- Exhibits147: SWOT
- Exhibits148: Emami Ltd - Overview
- Exhibits149: Emami Ltd - Product / Service
- Exhibits150: Emami Ltd - Key offerings
- Exhibits151: SWOT
- Exhibits152: Himalaya Wellness Co. - Overview
- Exhibits153: Himalaya Wellness Co. - Product / Service
- Exhibits154: Himalaya Wellness Co. - Key offerings
- Exhibits155: SWOT
- Exhibits156: Herbalhillswellness - Overview
- Exhibits157: Herbalhillswellness - Product / Service
- Exhibits158: Herbalhillswellness - Key offerings
- Exhibits159: SWOT
- Exhibits160: Maharishi Ayurveda - Overview
- Exhibits161: Maharishi Ayurveda - Product / Service
- Exhibits162: Maharishi Ayurveda - Key offerings
- Exhibits163: SWOT
- Exhibits164: Patanjali Ayurved Ltd. - Overview
- Exhibits165: Patanjali Ayurved Ltd. - Product / Service
- Exhibits166: Patanjali Ayurved Ltd. - Key offerings
- Exhibits167: SWOT
- Exhibits168: Polycare Herbals - Overview
- Exhibits169: Polycare Herbals - Product / Service
- Exhibits170: Polycare Herbals - Key offerings
- Exhibits171: SWOT
- Exhibits172: shahnaz Husain - Overview
- Exhibits173: shahnaz Husain - Product / Service
- Exhibits174: shahnaz Husain - Key offerings
- Exhibits175: SWOT
- Exhibits176: Shathayu Ayurveda Clinic - Overview
- Exhibits177: Shathayu Ayurveda Clinic - Product / Service
- Exhibits178: Shathayu Ayurveda Clinic - Key offerings
- Exhibits179: SWOT
- Exhibits180: Shree Baidyanath Ayurved Bhawan Pvt., Ltd - Overview
- Exhibits181: Shree Baidyanath Ayurved Bhawan Pvt., Ltd - Product / Service
- Exhibits182: Shree Baidyanath Ayurved Bhawan Pvt., Ltd - Key offerings
- Exhibits183: SWOT
- Exhibits184: Srisritattva - Overview
- Exhibits185: Srisritattva - Product / Service
- Exhibits186: Srisritattva - Key offerings
- Exhibits187: SWOT
- Exhibits188: Unilever PLC - Overview
- Exhibits189: Unilever PLC - Business segments
- Exhibits190: Unilever PLC - Key offerings
- Exhibits191: Unilever PLC - Segment focus
- Exhibits192: SWOT
- Exhibits193: Vicco Laboratories - Overview
- Exhibits194: Vicco Laboratories - Product / Service
- Exhibits195: Vicco Laboratories - Key offerings
- Exhibits196: SWOT
- Exhibits197: Inclusions checklist
- Exhibits198: Exclusions checklist
- Exhibits199: Currency conversion rates for US$
- Exhibits200: Research methodology
- Exhibits201: Information sources
- Exhibits202: Data validation
- Exhibits203: Validation techniques employed for market sizing
- Exhibits204: Data synthesis
- Exhibits205: 360 degree market analysis
- Exhibits206: List of abbreviations
Ayurveda Market 2025-2029
The ayurveda market is forecasted to grow by USD 11299 mn during 2024-2029, accelerating at a CAGR of 20.1% during the forecast period. The report on the ayurveda market provides a holistic analysis, market size and forecast, trends, growth drivers, and challenges, as well as vendor analysis covering around 25 vendors.
The report offers an up-to-date analysis regarding the current market scenario, the latest trends and drivers, and the overall market environment. The market is driven by low side effects of ayurveda medicines, rising demand for natural medicines, and increasing launches of new products.
| Market Scope | |
|---|---|
| Base Year | 2025 |
| End Year | 2029 |
| Series Year | 2025-2029 |
| Growth Momentum | Accelerate |
| YOY 2025 | 16.5% |
| CAGR | 20.1% |
| Incremental Value | $11299 mn |
Technavio's ayurveda market is segmented as below:
By Type
- Products
- Services
By Application
- Personal care
- Medicinal
By Geographical Landscape
- Asia
- North America
- Europe
- Rest of World (ROW)
This study identifies the inclination toward herbal and natural products as one of the prime reasons driving the ayurveda market growth during the next few years. Also, increase in number of clinical studies demonstrating health benefits and proliferating demand for personalized herbal medicines will lead to sizable demand in the market.
The report on the ayurveda market covers the following areas:
- Ayurveda Market sizing
- Ayurveda Market forecast
- Ayurveda Market industry analysis
The robust vendor analysis is designed to help clients improve their market position, and in line with this, this report provides a detailed analysis of several leading ayurveda market vendors that include BACFO Pharmaceuticals India Ltd., Charak Pharma Pvt. Ltd., Colgate Palmolive Co., Dabur India Ltd., Emami Ltd, Hamdard Laboratories, Himalaya Wellness Co., Herbalhillswellness, Katra Phytochem Pvt. Ltd., Maharishi Ayurveda, Manipal Natural Pvt. Ltd., Patanjali Ayurved Ltd., Polycare Herbals, PUIG S.L., shahnaz Husain, Shathayu Ayurveda Clinic, Shree Baidyanath Ayurved Bhawan Pvt., Ltd, Srisritattva, Unilever PLC, and Vicco Laboratories. Also, the ayurveda market analysis report includes information on upcoming trends and challenges that will influence market growth. This is to help companies strategize and leverage all forthcoming growth opportunities.
The study was conducted using an objective combination of primary and secondary information including inputs from key participants in the industry. The report contains a comprehensive market and vendor landscape in addition to an analysis of the key vendors.
The publisher presents a detailed picture of the market by the way of study, synthesis, and summation of data from multiple sources by an analysis of key parameters such as profit, pricing, competition, and promotions. It presents various market facets by identifying the key industry influencers. The data presented is comprehensive, reliable, and a result of extensive primary and secondary research. The market research reports provide a complete competitive landscape and an in-depth vendor selection methodology and analysis using qualitative and quantitative research to forecast accurate market growth.
Table of Contents
1 Executive Summary
- 1.1 Market overview
- Executive Summary - Chart on Market Overview
- Executive Summary - Data Table on Market Overview
- Executive Summary - Chart on Global Market Characteristics
- Executive Summary - Chart on Market By Geographical Landscape
- Executive Summary - Chart on Market Segmentation by Type
- Executive Summary - Chart on Market Segmentation by Application
- Executive Summary - Chart on Incremental Growth
- Executive Summary - Data Table on Incremental Growth
- Executive Summary - Chart on Company Market Positioning
2 Technavio Analysis
- 2.1 Analysis of price sensitivity, lifecycle, customer purchase basket, adoption rates, and purchase criteria
- Analysis of price sensitivity, lifecycle, customer purchase basket, adoption rates, and purchase criteria
- 2.2 Criticality of inputs and Factors of differentiation
- Overview on criticality of inputs and factors of differentiation
- 2.3 Factors of disruption
- Overview on factors of disruption
- 2.4 Impact of drivers and challenges
- Impact of drivers and challenges in 2024 and 2029
3 Market Landscape
- 3.1 Market ecosystem
- Parent Market
- Data Table on - Parent Market
- 3.2 Market characteristics
- Market characteristics analysis
- 3.3 Value chain analysis
- Value chain analysis
4 Market Sizing
- 4.1 Market definition
- Offerings of companies included in the market definition
- 4.2 Market segment analysis
- Market segments
- 4.3 Market size 2024
- 4.4 Market outlook: Forecast for 2024-2029
- Chart on Global - Market size and forecast 2024-2029 ($ million)
- Data Table on Global - Market size and forecast 2024-2029 ($ million)
- Chart on Global Market: Year-over-year growth 2024-2029 (%)
- Data Table on Global Market: Year-over-year growth 2024-2029 (%)
5 Historic Market Size
- 5.1 Global Ayurveda Market 2019 - 2023
- Historic Market Size - Data Table on Global Ayurveda Market 2019 - 2023 ($ million)
- 5.2 Type segment analysis 2019 - 2023
- Historic Market Size - Type Segment 2019 - 2023 ($ million)
- 5.3 Application segment analysis 2019 - 2023
- Historic Market Size - Application Segment 2019 - 2023 ($ million)
- 5.4 Geography segment analysis 2019 - 2023
- Historic Market Size - Geography Segment 2019 - 2023 ($ million)
- 5.5 Country segment analysis 2019 - 2023
- Historic Market Size - Country Segment 2019 - 2023 ($ million)
6 Qualitative Analysis
- 6.1 The AI impact on Global Ayurveda Market
7 Five Forces Analysis
- 7.1 Five forces summary
- Five forces analysis - Comparison between 2024 and 2029
- 7.2 Bargaining power of buyers
- Bargaining power of buyers - Impact of key factors 2024 and 2029
- 7.3 Bargaining power of suppliers
- Bargaining power of suppliers - Impact of key factors in 2024 and 2029
- 7.4 Threat of new entrants
- Threat of new entrants - Impact of key factors in 2024 and 2029
- 7.5 Threat of substitutes
- Threat of substitutes - Impact of key factors in 2024 and 2029
- 7.6 Threat of rivalry
- Threat of rivalry - Impact of key factors in 2024 and 2029
- 7.7 Market condition
- Chart on Market condition - Five forces 2024 and 2029
8 Market Segmentation by Type
- 8.1 Market segments
- Chart on Type - Market share 2024-2029 (%)
- Data Table on Type - Market share 2024-2029 (%)
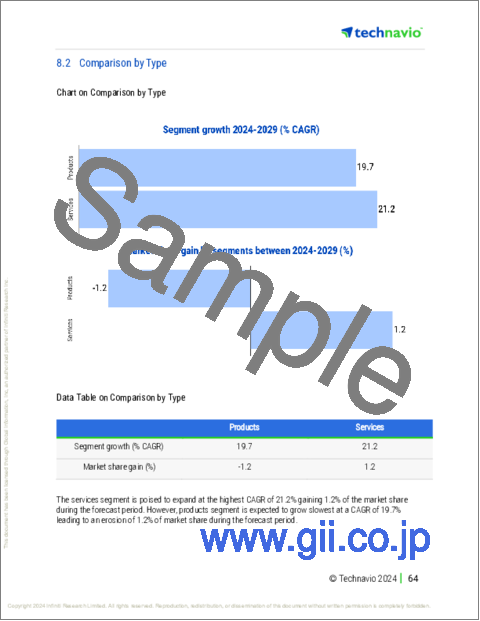
- 8.2 Comparison by Type
- Chart on Comparison by Type
- Data Table on Comparison by Type
- 8.3 Products - Market size and forecast 2024-2029
- Chart on Products - Market size and forecast 2024-2029 ($ million)
- Data Table on Products - Market size and forecast 2024-2029 ($ million)
- Chart on Products - Year-over-year growth 2024-2029 (%)
- Data Table on Products - Year-over-year growth 2024-2029 (%)
- 8.4 Services - Market size and forecast 2024-2029
- Chart on Services - Market size and forecast 2024-2029 ($ million)
- Data Table on Services - Market size and forecast 2024-2029 ($ million)
- Chart on Services - Year-over-year growth 2024-2029 (%)
- Data Table on Services - Year-over-year growth 2024-2029 (%)
- 8.5 Market opportunity by Type
- Market opportunity by Type ($ million)
- Data Table on Market opportunity by Type ($ million)
9 Market Segmentation by Application
- 9.1 Market segments
- Chart on Application - Market share 2024-2029 (%)
- Data Table on Application - Market share 2024-2029 (%)
- 9.2 Comparison by Application
- Chart on Comparison by Application
- Data Table on Comparison by Application
- 9.3 Personal care - Market size and forecast 2024-2029
- Chart on Personal care - Market size and forecast 2024-2029 ($ million)
- Data Table on Personal care - Market size and forecast 2024-2029 ($ million)
- Chart on Personal care - Year-over-year growth 2024-2029 (%)
- Data Table on Personal care - Year-over-year growth 2024-2029 (%)
- 9.4 Medicinal - Market size and forecast 2024-2029
- Chart on Medicinal - Market size and forecast 2024-2029 ($ million)
- Data Table on Medicinal - Market size and forecast 2024-2029 ($ million)
- Chart on Medicinal - Year-over-year growth 2024-2029 (%)
- Data Table on Medicinal - Year-over-year growth 2024-2029 (%)
- 9.5 Market opportunity by Application
- Market opportunity by Application ($ million)
- Data Table on Market opportunity by Application ($ million)
10 Customer Landscape
- 10.1 Customer landscape overview
- Analysis of price sensitivity, lifecycle, customer purchase basket, adoption rates, and purchase criteria
11 Geographic Landscape
- 11.1 Geographic segmentation
- Chart on Market share By Geographical Landscape 2024-2029 (%)
- Data Table on Market share By Geographical Landscape 2024-2029 (%)
- 11.2 Geographic comparison
- Chart on Geographic comparison
- Data Table on Geographic comparison
- 11.3 Asia - Market size and forecast 2024-2029
- Chart on Asia - Market size and forecast 2024-2029 ($ million)
- Data Table on Asia - Market size and forecast 2024-2029 ($ million)
- Chart on Asia - Year-over-year growth 2024-2029 (%)
- Data Table on Asia - Year-over-year growth 2024-2029 (%)
- 11.4 North America - Market size and forecast 2024-2029
- Chart on North America - Market size and forecast 2024-2029 ($ million)
- Data Table on North America - Market size and forecast 2024-2029 ($ million)
- Chart on North America - Year-over-year growth 2024-2029 (%)
- Data Table on North America - Year-over-year growth 2024-2029 (%)
- 11.5 Europe - Market size and forecast 2024-2029
- Chart on Europe - Market size and forecast 2024-2029 ($ million)
- Data Table on Europe - Market size and forecast 2024-2029 ($ million)
- Chart on Europe - Year-over-year growth 2024-2029 (%)
- Data Table on Europe - Year-over-year growth 2024-2029 (%)
- 11.6 Rest of World (ROW) - Market size and forecast 2024-2029
- Chart on Rest of World (ROW) - Market size and forecast 2024-2029 ($ million)
- Data Table on Rest of World (ROW) - Market size and forecast 2024-2029 ($ million)
- Chart on Rest of World (ROW) - Year-over-year growth 2024-2029 (%)
- Data Table on Rest of World (ROW) - Year-over-year growth 2024-2029 (%)
- 11.7 India - Market size and forecast 2024-2029
- Chart on India - Market size and forecast 2024-2029 ($ million)
- Data Table on India - Market size and forecast 2024-2029 ($ million)
- Chart on India - Year-over-year growth 2024-2029 (%)
- Data Table on India - Year-over-year growth 2024-2029 (%)
- 11.8 US - Market size and forecast 2024-2029
- Chart on US - Market size and forecast 2024-2029 ($ million)
- Data Table on US - Market size and forecast 2024-2029 ($ million)
- Chart on US - Year-over-year growth 2024-2029 (%)
- Data Table on US - Year-over-year growth 2024-2029 (%)
- 11.9 Indonesia - Market size and forecast 2024-2029
- Chart on Indonesia - Market size and forecast 2024-2029 ($ million)
- Data Table on Indonesia - Market size and forecast 2024-2029 ($ million)
- Chart on Indonesia - Year-over-year growth 2024-2029 (%)
- Data Table on Indonesia - Year-over-year growth 2024-2029 (%)
- 11.10 The Netherlands - Market size and forecast 2024-2029
- Chart on The Netherlands - Market size and forecast 2024-2029 ($ million)
- Data Table on The Netherlands - Market size and forecast 2024-2029 ($ million)
- Chart on The Netherlands - Year-over-year growth 2024-2029 (%)
- Data Table on The Netherlands - Year-over-year growth 2024-2029 (%)
- 11.11 UAE - Market size and forecast 2024-2029
- Chart on UAE - Market size and forecast 2024-2029 ($ million)
- Data Table on UAE - Market size and forecast 2024-2029 ($ million)
- Chart on UAE - Year-over-year growth 2024-2029 (%)
- Data Table on UAE - Year-over-year growth 2024-2029 (%)
- 11.12 Nepal - Market size and forecast 2024-2029
- Chart on Nepal - Market size and forecast 2024-2029 ($ million)
- Data Table on Nepal - Market size and forecast 2024-2029 ($ million)
- Chart on Nepal - Year-over-year growth 2024-2029 (%)
- Data Table on Nepal - Year-over-year growth 2024-2029 (%)
- 11.13 France - Market size and forecast 2024-2029
- Chart on France - Market size and forecast 2024-2029 ($ million)
- Data Table on France - Market size and forecast 2024-2029 ($ million)
- Chart on France - Year-over-year growth 2024-2029 (%)
- Data Table on France - Year-over-year growth 2024-2029 (%)
- 11.14 Switzerland - Market size and forecast 2024-2029
- Chart on Switzerland - Market size and forecast 2024-2029 ($ million)
- Data Table on Switzerland - Market size and forecast 2024-2029 ($ million)
- Chart on Switzerland - Year-over-year growth 2024-2029 (%)
- Data Table on Switzerland - Year-over-year growth 2024-2029 (%)
- 11.15 Saudi Arabia - Market size and forecast 2024-2029
- Chart on Saudi Arabia - Market size and forecast 2024-2029 ($ million)
- Data Table on Saudi Arabia - Market size and forecast 2024-2029 ($ million)
- Chart on Saudi Arabia - Year-over-year growth 2024-2029 (%)
- Data Table on Saudi Arabia - Year-over-year growth 2024-2029 (%)
- 11.16 Brazil - Market size and forecast 2024-2029
- Chart on Brazil - Market size and forecast 2024-2029 ($ million)
- Data Table on Brazil - Market size and forecast 2024-2029 ($ million)
- Chart on Brazil - Year-over-year growth 2024-2029 (%)
- Data Table on Brazil - Year-over-year growth 2024-2029 (%)
- 11.17 Market opportunity By Geographical Landscape
- Market opportunity By Geographical Landscape ($ million)
- Data Tables on Market opportunity By Geographical Landscape ($ million)
12 Drivers, Challenges, and Opportunity/Restraints
- 12.1 Market drivers
- 12.2 Market challenges
- 12.3 Impact of drivers and challenges
- Impact of drivers and challenges in 2024 and 2029
- 12.4 Market opportunities/restraints
13 Competitive Landscape
- 13.1 Overview
- 13.2 Competitive Landscape
- Overview on criticality of inputs and factors of differentiation
- 13.3 Landscape disruption
- Overview on factors of disruption
- 13.4 Industry risks
- Impact of key risks on business
14 Competitive Analysis
- 14.1 Companies profiled
- Companies covered
- 14.2 Company ranking index
- Company ranking index
- 14.3 Market positioning of companies
- Matrix on companies position and classification
- 14.4 BACFO Pharmaceuticals India Ltd.
- BACFO Pharmaceuticals India Ltd. - Overview
- BACFO Pharmaceuticals India Ltd. - Product / Service
- BACFO Pharmaceuticals India Ltd. - Key offerings
- SWOT
- 14.5 Charak Pharma Pvt. Ltd.
- Charak Pharma Pvt. Ltd. - Overview
- Charak Pharma Pvt. Ltd. - Product / Service
- Charak Pharma Pvt. Ltd. - Key offerings
- SWOT
- 14.6 Dabur India Ltd.
- Dabur India Ltd. - Overview
- Dabur India Ltd. - Business segments
- Dabur India Ltd. - Key news
- Dabur India Ltd. - Key offerings
- Dabur India Ltd. - Segment focus
- SWOT
- 14.7 Emami Ltd
- Emami Ltd - Overview
- Emami Ltd - Product / Service
- Emami Ltd - Key offerings
- SWOT
- 14.8 Himalaya Wellness Co.
- Himalaya Wellness Co. - Overview
- Himalaya Wellness Co. - Product / Service
- Himalaya Wellness Co. - Key offerings
- SWOT
- 14.9 Herbalhillswellness
- Herbalhillswellness - Overview
- Herbalhillswellness - Product / Service
- Herbalhillswellness - Key offerings
- SWOT
- 14.10 Maharishi Ayurveda
- Maharishi Ayurveda - Overview
- Maharishi Ayurveda - Product / Service
- Maharishi Ayurveda - Key offerings
- SWOT
- 14.11 Patanjali Ayurved Ltd.
- Patanjali Ayurved Ltd. - Overview
- Patanjali Ayurved Ltd. - Product / Service
- Patanjali Ayurved Ltd. - Key offerings
- SWOT
- 14.12 Polycare Herbals
- Polycare Herbals - Overview
- Polycare Herbals - Product / Service
- Polycare Herbals - Key offerings
- SWOT
- 14.13 shahnaz Husain
- shahnaz Husain - Overview
- shahnaz Husain - Product / Service
- shahnaz Husain - Key offerings
- SWOT
- 14.14 Shathayu Ayurveda Clinic
- Shathayu Ayurveda Clinic - Overview
- Shathayu Ayurveda Clinic - Product / Service
- Shathayu Ayurveda Clinic - Key offerings
- SWOT
- 14.15 Shree Baidyanath Ayurved Bhawan Pvt., Ltd
- Shree Baidyanath Ayurved Bhawan Pvt., Ltd - Overview
- Shree Baidyanath Ayurved Bhawan Pvt., Ltd - Product / Service
- Shree Baidyanath Ayurved Bhawan Pvt., Ltd - Key offerings
- SWOT
- 14.16 Srisritattva
- Srisritattva - Overview
- Srisritattva - Product / Service
- Srisritattva - Key offerings
- SWOT
- 14.17 Unilever PLC
- Unilever PLC - Overview
- Unilever PLC - Business segments
- Unilever PLC - Key offerings
- Unilever PLC - Segment focus
- SWOT
- 14.18 Vicco Laboratories
- Vicco Laboratories - Overview
- Vicco Laboratories - Product / Service
- Vicco Laboratories - Key offerings
- SWOT
15 Appendix
- 15.1 Scope of the report
- 15.2 Inclusions and exclusions checklist
- Inclusions checklist
- Exclusions checklist
- 15.3 Currency conversion rates for US$
- Currency conversion rates for US$
- 15.4 Research methodology
- Research methodology
- 15.5 Data procurement
- Information sources
- 15.6 Data validation
- Data validation
- 15.7 Validation techniques employed for market sizing
- Validation techniques employed for market sizing
- 15.8 Data synthesis
- Data synthesis
- 15.9 360 degree market analysis
- 360 degree market analysis
- 15.10 List of abbreviations
- List of abbreviations

