|
|
市場調査レポート
商品コード
1645669
マカダミアの世界市場 2025~2029年Global Macadamia Market 2025-2029 |
||||||

|
|||||||
カスタマイズ可能
|
|||||||


| マカダミアの世界市場 2025~2029年 |
|
出版日: 2025年01月17日
発行: TechNavio
ページ情報: 英文 185 Pages
納期: 即納可能
|

全表示
- 概要
- 図表
- 目次
マカダミア市場は2024~2029年に11億4,400万米ドル、予測期間中のCAGRは10.1%で成長すると予測されます。
当レポートでは、マカダミア市場の全体的な分析、市場規模・予測、動向、成長促進要因、課題、約25のベンダーを網羅したベンダー分析などを掲載しています。
現在の市場シナリオ、最新動向と促進要因、市場環境全体に関する最新分析を提供しています。市場は、ミレニアル世代におけるヴィーガンスナックの人気の高まり、菓子類や機能性材料におけるマカダミアナッツの使用の増加、小売チャネルの拡大が牽引しています。
| 市場範囲 | |
|---|---|
| 基準年 | 2025年 |
| 終了年 | 2029年 |
| 予測期間 | 2025~2029年 |
| 成長モメンタム | 加速 |
| 前年比[2025年] | 9.3% |
| CAGR | 10.1% |
| 増分額 | 11億4,400万米ドル |
本調査では、マカダミアナッツベースのスナックの発売数の増加が、今後数年間のマカダミア市場成長を促進する主要要因の1つであるとしています。また、化粧品産業におけるマカダミアオイルの使用増加、マカダミアナッツ生産への投資増加も市場の大きな需要につながります。
目次
第1章 エグゼクティブサマリー
- 市場概要
第2章 Technavio分析
- 価格・ライフサイクル・顧客購入バスケット・採用率・購入基準の分析
- インプットの重要性と差別化の要因
- 混乱の要因
- 促進要因と課題の影響
第3章 市場情勢
- 市場エコシステム
- 市場の特徴
- バリューチェーン分析
第4章 市場規模
- 市場の定義
- 市場セグメント分析
- 市場規模 2024年
- 市場の展望 2024~2029年
第5章 市場規模実績
- マカダミアの世界市場 2019~2023年
- タイプ別セグメント分析 2019~2023年
- 流通チャネル別セグメント分析 2019~2023年
- 地域別セグメント分析 2019~2023年
- 国別セグメント分析 2019~2023年
第6章 定性分析
- AIの影響-マカダミアの世界市場
第7章 ファイブフォース分析
- ファイブフォースの要約
- 買い手の交渉力
- 供給企業の交渉力
- 新規参入業者の脅威
- 代替品の脅威
- 競争の脅威
- 市況
第8章 市場セグメンテーション:タイプ別
- 市場セグメント
- 比較:タイプ別
- 従来型:市場規模と予測 2024~2029年
- オーガニック:市場規模と予測 2024~2029年
- 市場機会:タイプ別
第9章 市場セグメンテーション:流通チャネル別
- 市場セグメント
- 比較:流通チャネル別
- オフライン:市場規模と予測 2024~2029年
- オンライン:市場規模と予測 2024~2029年
- 市場機会:流通チャネル別
第10章 顧客情勢
- 顧客情勢概要
第11章 地域別情勢
- 地域別セグメンテーション
- 比較:地域別
- アジア太平洋:市場規模と予測 2024~2029年
- 北米:市場規模と予測 2024~2029年
- 欧州:市場規模と予測 2024~2029年
- 中東・アフリカ:市場規模と予測 2024~2029年
- 南米:市場規模と予測 2024~2029年
- 米国:市場規模と予測 2024~2029年
- 中国:市場規模と予測 2024~2029年
- 日本:市場規模と予測 2024~2029年
- インド:市場規模と予測 2024~2029年
- カナダ:市場規模と予測 2024~2029年
- オーストラリア:市場規模と予測 2024~2029年
- ベトナム:市場規模と予測 2024~2029年
- ドイツ:市場規模と予測 2024~2029年
- オランダ:市場規模と予測 2024~2029年
- フランス:市場規模と予測 2024~2029年
- 地域情勢による市場機会
第12章 促進要因・課題・機会・抑制要因
- 市場促進要因
- 市場課題
- 促進要因と課題の影響
- 市場機会・抑制要因
第13章 競合情勢
- 概要
- 競合情勢
- 混乱の状況
- 産業のリスク
第14章 競合分析
- 企業プロファイル
- 企業ランキング指数
- 企業の市場ポジショニング
- Barry Callebaut AG
- Buderim Ginger
- Dr Paulos Kona Coffee and Macadamia Nut Farms
- Golden Macadamias Pty Ltd.
- Hamakua Macadamia Nut Co.
- Hawaiian Host Group
- Macadamias Direct
- Makua Coffee Co.
- Marquis Macadamias
- MWT Foods
- North Shore Macadamia Nut Co.
- Royal Macadamia Pty Ltd.
- Superior Nut Co. Inc.
- T M Ward Coffee Inc.
- Wondaree Macadamias Nuts
第15章 付録
Exhibits:
- Exhibits1: Executive Summary - Chart on Market Overview
- Exhibits2: Executive Summary - Data Table on Market Overview
- Exhibits3: Executive Summary - Chart on Global Market Characteristics
- Exhibits4: Executive Summary - Chart on Market By Geographical Landscape
- Exhibits5: Executive Summary - Chart on Market Segmentation by Type
- Exhibits6: Executive Summary - Chart on Market Segmentation by Distribution Channel
- Exhibits7: Executive Summary - Chart on Incremental Growth
- Exhibits8: Executive Summary - Data Table on Incremental Growth
- Exhibits9: Executive Summary - Chart on Company Market Positioning
- Exhibits10: Analysis of price sensitivity, lifecycle, customer purchase basket, adoption rates, and purchase criteria
- Exhibits11: Overview on criticality of inputs and factors of differentiation
- Exhibits12: Overview on factors of disruption
- Exhibits13: Impact of drivers and challenges in 2024 and 2029
- Exhibits14: Parent Market
- Exhibits15: Data Table on - Parent Market
- Exhibits16: Market characteristics analysis
- Exhibits17: Value chain analysis
- Exhibits18: Offerings of companies included in the market definition
- Exhibits19: Market segments
- Exhibits20: Chart on Global - Market size and forecast 2024-2029 ($ million)
- Exhibits21: Data Table on Global - Market size and forecast 2024-2029 ($ million)
- Exhibits22: Chart on Global Market: Year-over-year growth 2024-2029 (%)
- Exhibits23: Data Table on Global Market: Year-over-year growth 2024-2029 (%)
- Exhibits24: Historic Market Size - Data Table on Global Macadamia Market 2019 - 2023 ($ million)
- Exhibits25: Historic Market Size - Type Segment 2019 - 2023 ($ million)
- Exhibits26: Historic Market Size - Distribution Channel Segment 2019 - 2023 ($ million)
- Exhibits27: Historic Market Size - Geography Segment 2019 - 2023 ($ million)
- Exhibits28: Historic Market Size - Country Segment 2019 - 2023 ($ million)
- Exhibits29: Five forces analysis - Comparison between 2024 and 2029
- Exhibits30: Bargaining power of buyers - Impact of key factors 2024 and 2029
- Exhibits31: Bargaining power of suppliers - Impact of key factors in 2024 and 2029
- Exhibits32: Threat of new entrants - Impact of key factors in 2024 and 2029
- Exhibits33: Threat of substitutes - Impact of key factors in 2024 and 2029
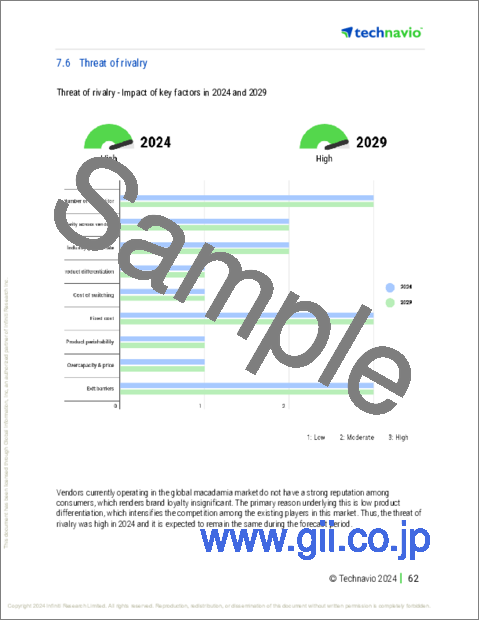
- Exhibits34: Threat of rivalry - Impact of key factors in 2024 and 2029
- Exhibits35: Chart on Market condition - Five forces 2024 and 2029
- Exhibits36: Chart on Type - Market share 2024-2029 (%)
- Exhibits37: Data Table on Type - Market share 2024-2029 (%)
- Exhibits38: Chart on Comparison by Type
- Exhibits39: Data Table on Comparison by Type
- Exhibits40: Chart on Conventional - Market size and forecast 2024-2029 ($ million)
- Exhibits41: Data Table on Conventional - Market size and forecast 2024-2029 ($ million)
- Exhibits42: Chart on Conventional - Year-over-year growth 2024-2029 (%)
- Exhibits43: Data Table on Conventional - Year-over-year growth 2024-2029 (%)
- Exhibits44: Chart on Organic - Market size and forecast 2024-2029 ($ million)
- Exhibits45: Data Table on Organic - Market size and forecast 2024-2029 ($ million)
- Exhibits46: Chart on Organic - Year-over-year growth 2024-2029 (%)
- Exhibits47: Data Table on Organic - Year-over-year growth 2024-2029 (%)
- Exhibits48: Market opportunity by Type ($ million)
- Exhibits49: Data Table on Market opportunity by Type ($ million)
- Exhibits50: Chart on Distribution Channel - Market share 2024-2029 (%)
- Exhibits51: Data Table on Distribution Channel - Market share 2024-2029 (%)
- Exhibits52: Chart on Comparison by Distribution Channel
- Exhibits53: Data Table on Comparison by Distribution Channel
- Exhibits54: Chart on Offline - Market size and forecast 2024-2029 ($ million)
- Exhibits55: Data Table on Offline - Market size and forecast 2024-2029 ($ million)
- Exhibits56: Chart on Offline - Year-over-year growth 2024-2029 (%)
- Exhibits57: Data Table on Offline - Year-over-year growth 2024-2029 (%)
- Exhibits58: Chart on Online - Market size and forecast 2024-2029 ($ million)
- Exhibits59: Data Table on Online - Market size and forecast 2024-2029 ($ million)
- Exhibits60: Chart on Online - Year-over-year growth 2024-2029 (%)
- Exhibits61: Data Table on Online - Year-over-year growth 2024-2029 (%)
- Exhibits62: Market opportunity by Distribution Channel ($ million)
- Exhibits63: Data Table on Market opportunity by Distribution Channel ($ million)
- Exhibits64: Analysis of price sensitivity, lifecycle, customer purchase basket, adoption rates, and purchase criteria
- Exhibits65: Chart on Market share By Geographical Landscape 2024-2029 (%)
- Exhibits66: Data Table on Market share By Geographical Landscape 2024-2029 (%)
- Exhibits67: Chart on Geographic comparison
- Exhibits68: Data Table on Geographic comparison
- Exhibits69: Chart on APAC - Market size and forecast 2024-2029 ($ million)
- Exhibits70: Data Table on APAC - Market size and forecast 2024-2029 ($ million)
- Exhibits71: Chart on APAC - Year-over-year growth 2024-2029 (%)
- Exhibits72: Data Table on APAC - Year-over-year growth 2024-2029 (%)
- Exhibits73: Chart on North America - Market size and forecast 2024-2029 ($ million)
- Exhibits74: Data Table on North America - Market size and forecast 2024-2029 ($ million)
- Exhibits75: Chart on North America - Year-over-year growth 2024-2029 (%)
- Exhibits76: Data Table on North America - Year-over-year growth 2024-2029 (%)
- Exhibits77: Chart on Europe - Market size and forecast 2024-2029 ($ million)
- Exhibits78: Data Table on Europe - Market size and forecast 2024-2029 ($ million)
- Exhibits79: Chart on Europe - Year-over-year growth 2024-2029 (%)
- Exhibits80: Data Table on Europe - Year-over-year growth 2024-2029 (%)
- Exhibits81: Chart on Middle East and Africa - Market size and forecast 2024-2029 ($ million)
- Exhibits82: Data Table on Middle East and Africa - Market size and forecast 2024-2029 ($ million)
- Exhibits83: Chart on Middle East and Africa - Year-over-year growth 2024-2029 (%)
- Exhibits84: Data Table on Middle East and Africa - Year-over-year growth 2024-2029 (%)
- Exhibits85: Chart on South America - Market size and forecast 2024-2029 ($ million)
- Exhibits86: Data Table on South America - Market size and forecast 2024-2029 ($ million)
- Exhibits87: Chart on South America - Year-over-year growth 2024-2029 (%)
- Exhibits88: Data Table on South America - Year-over-year growth 2024-2029 (%)
- Exhibits89: Chart on US - Market size and forecast 2024-2029 ($ million)
- Exhibits90: Data Table on US - Market size and forecast 2024-2029 ($ million)
- Exhibits91: Chart on US - Year-over-year growth 2024-2029 (%)
- Exhibits92: Data Table on US - Year-over-year growth 2024-2029 (%)
- Exhibits93: Chart on China - Market size and forecast 2024-2029 ($ million)
- Exhibits94: Data Table on China - Market size and forecast 2024-2029 ($ million)
- Exhibits95: Chart on China - Year-over-year growth 2024-2029 (%)
- Exhibits96: Data Table on China - Year-over-year growth 2024-2029 (%)
- Exhibits97: Chart on Japan - Market size and forecast 2024-2029 ($ million)
- Exhibits98: Data Table on Japan - Market size and forecast 2024-2029 ($ million)
- Exhibits99: Chart on Japan - Year-over-year growth 2024-2029 (%)
- Exhibits100: Data Table on Japan - Year-over-year growth 2024-2029 (%)
- Exhibits101: Chart on India - Market size and forecast 2024-2029 ($ million)
- Exhibits102: Data Table on India - Market size and forecast 2024-2029 ($ million)
- Exhibits103: Chart on India - Year-over-year growth 2024-2029 (%)
- Exhibits104: Data Table on India - Year-over-year growth 2024-2029 (%)
- Exhibits105: Chart on Canada - Market size and forecast 2024-2029 ($ million)
- Exhibits106: Data Table on Canada - Market size and forecast 2024-2029 ($ million)
- Exhibits107: Chart on Canada - Year-over-year growth 2024-2029 (%)
- Exhibits108: Data Table on Canada - Year-over-year growth 2024-2029 (%)
- Exhibits109: Chart on Australia - Market size and forecast 2024-2029 ($ million)
- Exhibits110: Data Table on Australia - Market size and forecast 2024-2029 ($ million)
- Exhibits111: Chart on Australia - Year-over-year growth 2024-2029 (%)
- Exhibits112: Data Table on Australia - Year-over-year growth 2024-2029 (%)
- Exhibits113: Chart on Vietnam - Market size and forecast 2024-2029 ($ million)
- Exhibits114: Data Table on Vietnam - Market size and forecast 2024-2029 ($ million)
- Exhibits115: Chart on Vietnam - Year-over-year growth 2024-2029 (%)
- Exhibits116: Data Table on Vietnam - Year-over-year growth 2024-2029 (%)
- Exhibits117: Chart on Germany - Market size and forecast 2024-2029 ($ million)
- Exhibits118: Data Table on Germany - Market size and forecast 2024-2029 ($ million)
- Exhibits119: Chart on Germany - Year-over-year growth 2024-2029 (%)
- Exhibits120: Data Table on Germany - Year-over-year growth 2024-2029 (%)
- Exhibits121: Chart on The Netherlands - Market size and forecast 2024-2029 ($ million)
- Exhibits122: Data Table on The Netherlands - Market size and forecast 2024-2029 ($ million)
- Exhibits123: Chart on The Netherlands - Year-over-year growth 2024-2029 (%)
- Exhibits124: Data Table on The Netherlands - Year-over-year growth 2024-2029 (%)
- Exhibits125: Chart on France - Market size and forecast 2024-2029 ($ million)
- Exhibits126: Data Table on France - Market size and forecast 2024-2029 ($ million)
- Exhibits127: Chart on France - Year-over-year growth 2024-2029 (%)
- Exhibits128: Data Table on France - Year-over-year growth 2024-2029 (%)
- Exhibits129: Market opportunity By Geographical Landscape ($ million)
- Exhibits130: Data Tables on Market opportunity By Geographical Landscape ($ million)
- Exhibits131: Impact of drivers and challenges in 2024 and 2029
- Exhibits132: Overview on criticality of inputs and factors of differentiation
- Exhibits133: Overview on factors of disruption
- Exhibits134: Impact of key risks on business
- Exhibits135: Companies covered
- Exhibits136: Company ranking index
- Exhibits137: Matrix on companies position and classification
- Exhibits138: Barry Callebaut AG - Overview
- Exhibits139: Barry Callebaut AG - Business segments
- Exhibits140: Barry Callebaut AG - Key news
- Exhibits141: Barry Callebaut AG - Key offerings
- Exhibits142: Barry Callebaut AG - Segment focus
- Exhibits143: SWOT
- Exhibits144: Buderim Ginger - Overview
- Exhibits145: Buderim Ginger - Product / Service
- Exhibits146: Buderim Ginger - Key offerings
- Exhibits147: SWOT
- Exhibits148: Dr Paulos Kona Coffee and Macadamia Nut Farms - Overview
- Exhibits149: Dr Paulos Kona Coffee and Macadamia Nut Farms - Product / Service
- Exhibits150: Dr Paulos Kona Coffee and Macadamia Nut Farms - Key offerings
- Exhibits151: SWOT
- Exhibits152: Golden Macadamias Pty Ltd. - Overview
- Exhibits153: Golden Macadamias Pty Ltd. - Product / Service
- Exhibits154: Golden Macadamias Pty Ltd. - Key offerings
- Exhibits155: SWOT
- Exhibits156: Hamakua Macadamia Nut Co. - Overview
- Exhibits157: Hamakua Macadamia Nut Co. - Product / Service
- Exhibits158: Hamakua Macadamia Nut Co. - Key offerings
- Exhibits159: SWOT
- Exhibits160: Hawaiian Host Group - Overview
- Exhibits161: Hawaiian Host Group - Product / Service
- Exhibits162: Hawaiian Host Group - Key offerings
- Exhibits163: SWOT
- Exhibits164: Macadamias Direct - Overview
- Exhibits165: Macadamias Direct - Product / Service
- Exhibits166: Macadamias Direct - Key offerings
- Exhibits167: SWOT
- Exhibits168: Makua Coffee Co. - Overview
- Exhibits169: Makua Coffee Co. - Product / Service
- Exhibits170: Makua Coffee Co. - Key offerings
- Exhibits171: SWOT
- Exhibits172: Marquis Macadamias - Overview
- Exhibits173: Marquis Macadamias - Product / Service
- Exhibits174: Marquis Macadamias - Key offerings
- Exhibits175: SWOT
- Exhibits176: MWT Foods - Overview
- Exhibits177: MWT Foods - Product / Service
- Exhibits178: MWT Foods - Key offerings
- Exhibits179: SWOT
- Exhibits180: North Shore Macadamia Nut Co. - Overview
- Exhibits181: North Shore Macadamia Nut Co. - Product / Service
- Exhibits182: North Shore Macadamia Nut Co. - Key offerings
- Exhibits183: SWOT
- Exhibits184: Royal Macadamia Pty Ltd. - Overview
- Exhibits185: Royal Macadamia Pty Ltd. - Product / Service
- Exhibits186: Royal Macadamia Pty Ltd. - Key offerings
- Exhibits187: SWOT
- Exhibits188: Superior Nut Co. Inc. - Overview
- Exhibits189: Superior Nut Co. Inc. - Product / Service
- Exhibits190: Superior Nut Co. Inc. - Key offerings
- Exhibits191: SWOT
- Exhibits192: T M Ward Coffee Inc. - Overview
- Exhibits193: T M Ward Coffee Inc. - Product / Service
- Exhibits194: T M Ward Coffee Inc. - Key offerings
- Exhibits195: SWOT
- Exhibits196: Wondaree Macadamias Nuts - Overview
- Exhibits197: Wondaree Macadamias Nuts - Product / Service
- Exhibits198: Wondaree Macadamias Nuts - Key offerings
- Exhibits199: SWOT
- Exhibits200: Inclusions checklist
- Exhibits201: Exclusions checklist
- Exhibits202: Currency conversion rates for US$
- Exhibits203: Research methodology
- Exhibits204: Information sources
- Exhibits205: Data validation
- Exhibits206: Validation techniques employed for market sizing
- Exhibits207: Data synthesis
- Exhibits208: 360 degree market analysis
- Exhibits209: List of abbreviations
The macadamia market is forecasted to grow by USD 1144 mn during 2024-2029, accelerating at a CAGR of 10.1% during the forecast period. The report on the macadamia market provides a holistic analysis, market size and forecast, trends, growth drivers, and challenges, as well as vendor analysis covering around 25 vendors.
The report offers an up-to-date analysis regarding the current market scenario, the latest trends and drivers, and the overall market environment. The market is driven by rising popularity of vegan snacks among millennials, growth in use of macadamia nuts in confectionery and functional ingredients, and expansion of retail channels.
| Market Scope | |
|---|---|
| Base Year | 2025 |
| End Year | 2029 |
| Series Year | 2025-2029 |
| Growth Momentum | Accelerate |
| YOY 2025 | 9.3% |
| CAGR | 10.1% |
| Incremental Value | $1144 mn |
Technavio's macadamia market is segmented as below:
By Type
- Conventional
- Organic
By Distribution Channel
- Offline
- Online
By Geographical Landscape
- APAC
- North America
- Europe
- Middle East and Africa
- South America
This study identifies the rise in number of macadamia nut-based snack launches as one of the prime reasons driving the macadamia market growth during the next few years. Also, increase in use of macadamia oils in cosmetics industry and rise in investments in macadamia nut production will lead to sizable demand in the market.
The report on the macadamia market covers the following areas:
- Macadamia Market sizing
- Macadamia Market forecast
- Macadamia Market industry analysis
The robust vendor analysis is designed to help clients improve their market position, and in line with this, this report provides a detailed analysis of several leading macadamia market vendors that include Bardakcigroup, Barry Callebaut AG, Buderim Ginger, Dr Paulos Kona Coffee and Macadamia Nut Farms, Eastern Produce, Golden Macadamias Pty Ltd., Hamakua Macadamia Nut Co., Hawaiian Host Group, Macadamias Direct, Makua Coffee Co., Marquis Macadamias, MWT Foods, North Shore Macadamia Nut Co., Royal Macadamia Pty Ltd., Superior Nut Co. Inc., T M Ward Coffee Inc., and Wondaree Macadamias Nuts. Also, the macadamia market analysis report includes information on upcoming trends and challenges that will influence market growth. This is to help companies strategize and leverage all forthcoming growth opportunities.
The study was conducted using an objective combination of primary and secondary information including inputs from key participants in the industry. The report contains a comprehensive market and vendor landscape in addition to an analysis of the key vendors.
The publisher presents a detailed picture of the market by the way of study, synthesis, and summation of data from multiple sources by an analysis of key parameters such as profit, pricing, competition, and promotions. It presents various market facets by identifying the key industry influencers. The data presented is comprehensive, reliable, and a result of extensive primary and secondary research. The market research reports provide a complete competitive landscape and an in-depth vendor selection methodology and analysis using qualitative and quantitative research to forecast accurate market growth.
Table of Contents
1 Executive Summary
- 1.1 Market overview
- Executive Summary - Chart on Market Overview
- Executive Summary - Data Table on Market Overview
- Executive Summary - Chart on Global Market Characteristics
- Executive Summary - Chart on Market By Geographical Landscape
- Executive Summary - Chart on Market Segmentation by Type
- Executive Summary - Chart on Market Segmentation by Distribution Channel
- Executive Summary - Chart on Incremental Growth
- Executive Summary - Data Table on Incremental Growth
- Executive Summary - Chart on Company Market Positioning
2 Technavio Analysis
- 2.1 Analysis of price sensitivity, lifecycle, customer purchase basket, adoption rates, and purchase criteria
- Analysis of price sensitivity, lifecycle, customer purchase basket, adoption rates, and purchase criteria
- 2.2 Criticality of inputs and Factors of differentiation
- Overview on criticality of inputs and factors of differentiation
- 2.3 Factors of disruption
- Overview on factors of disruption
- 2.4 Impact of drivers and challenges
- Impact of drivers and challenges in 2024 and 2029
3 Market Landscape
- 3.1 Market ecosystem
- Parent Market
- Data Table on - Parent Market
- 3.2 Market characteristics
- Market characteristics analysis
- 3.3 Value chain analysis
- Value chain analysis
4 Market Sizing
- 4.1 Market definition
- Offerings of companies included in the market definition
- 4.2 Market segment analysis
- Market segments
- 4.3 Market size 2024
- 4.4 Market outlook: Forecast for 2024-2029
- Chart on Global - Market size and forecast 2024-2029 ($ million)
- Data Table on Global - Market size and forecast 2024-2029 ($ million)
- Chart on Global Market: Year-over-year growth 2024-2029 (%)
- Data Table on Global Market: Year-over-year growth 2024-2029 (%)
5 Historic Market Size
- 5.1 Global Macadamia Market 2019 - 2023
- Historic Market Size - Data Table on Global Macadamia Market 2019 - 2023 ($ million)
- 5.2 Type segment analysis 2019 - 2023
- Historic Market Size - Type Segment 2019 - 2023 ($ million)
- 5.3 Distribution Channel segment analysis 2019 - 2023
- Historic Market Size - Distribution Channel Segment 2019 - 2023 ($ million)
- 5.4 Geography segment analysis 2019 - 2023
- Historic Market Size - Geography Segment 2019 - 2023 ($ million)
- 5.5 Country segment analysis 2019 - 2023
- Historic Market Size - Country Segment 2019 - 2023 ($ million)
6 Qualitative Analysis
- 6.1 Impact of AI on Global Macadamia Market
7 Five Forces Analysis
- 7.1 Five forces summary
- Five forces analysis - Comparison between 2024 and 2029
- 7.2 Bargaining power of buyers
- Bargaining power of buyers - Impact of key factors 2024 and 2029
- 7.3 Bargaining power of suppliers
- Bargaining power of suppliers - Impact of key factors in 2024 and 2029
- 7.4 Threat of new entrants
- Threat of new entrants - Impact of key factors in 2024 and 2029
- 7.5 Threat of substitutes
- Threat of substitutes - Impact of key factors in 2024 and 2029
- 7.6 Threat of rivalry
- Threat of rivalry - Impact of key factors in 2024 and 2029
- 7.7 Market condition
- Chart on Market condition - Five forces 2024 and 2029
8 Market Segmentation by Type
- 8.1 Market segments
- Chart on Type - Market share 2024-2029 (%)
- Data Table on Type - Market share 2024-2029 (%)
- 8.2 Comparison by Type
- Chart on Comparison by Type
- Data Table on Comparison by Type
- 8.3 Conventional - Market size and forecast 2024-2029
- Chart on Conventional - Market size and forecast 2024-2029 ($ million)
- Data Table on Conventional - Market size and forecast 2024-2029 ($ million)
- Chart on Conventional - Year-over-year growth 2024-2029 (%)
- Data Table on Conventional - Year-over-year growth 2024-2029 (%)
- 8.4 Organic - Market size and forecast 2024-2029
- Chart on Organic - Market size and forecast 2024-2029 ($ million)
- Data Table on Organic - Market size and forecast 2024-2029 ($ million)
- Chart on Organic - Year-over-year growth 2024-2029 (%)
- Data Table on Organic - Year-over-year growth 2024-2029 (%)
- 8.5 Market opportunity by Type
- Market opportunity by Type ($ million)
- Data Table on Market opportunity by Type ($ million)
9 Market Segmentation by Distribution Channel
- 9.1 Market segments
- Chart on Distribution Channel - Market share 2024-2029 (%)
- Data Table on Distribution Channel - Market share 2024-2029 (%)
- 9.2 Comparison by Distribution Channel
- Chart on Comparison by Distribution Channel
- Data Table on Comparison by Distribution Channel
- 9.3 Offline - Market size and forecast 2024-2029
- Chart on Offline - Market size and forecast 2024-2029 ($ million)
- Data Table on Offline - Market size and forecast 2024-2029 ($ million)
- Chart on Offline - Year-over-year growth 2024-2029 (%)
- Data Table on Offline - Year-over-year growth 2024-2029 (%)
- 9.4 Online - Market size and forecast 2024-2029
- Chart on Online - Market size and forecast 2024-2029 ($ million)
- Data Table on Online - Market size and forecast 2024-2029 ($ million)
- Chart on Online - Year-over-year growth 2024-2029 (%)
- Data Table on Online - Year-over-year growth 2024-2029 (%)
- 9.5 Market opportunity by Distribution Channel
- Market opportunity by Distribution Channel ($ million)
- Data Table on Market opportunity by Distribution Channel ($ million)
10 Customer Landscape
- 10.1 Customer landscape overview
- Analysis of price sensitivity, lifecycle, customer purchase basket, adoption rates, and purchase criteria
11 Geographic Landscape
- 11.1 Geographic segmentation
- Chart on Market share By Geographical Landscape 2024-2029 (%)
- Data Table on Market share By Geographical Landscape 2024-2029 (%)
- 11.2 Geographic comparison
- Chart on Geographic comparison
- Data Table on Geographic comparison
- 11.3 APAC - Market size and forecast 2024-2029
- Chart on APAC - Market size and forecast 2024-2029 ($ million)
- Data Table on APAC - Market size and forecast 2024-2029 ($ million)
- Chart on APAC - Year-over-year growth 2024-2029 (%)
- Data Table on APAC - Year-over-year growth 2024-2029 (%)
- 11.4 North America - Market size and forecast 2024-2029
- Chart on North America - Market size and forecast 2024-2029 ($ million)
- Data Table on North America - Market size and forecast 2024-2029 ($ million)
- Chart on North America - Year-over-year growth 2024-2029 (%)
- Data Table on North America - Year-over-year growth 2024-2029 (%)
- 11.5 Europe - Market size and forecast 2024-2029
- Chart on Europe - Market size and forecast 2024-2029 ($ million)
- Data Table on Europe - Market size and forecast 2024-2029 ($ million)
- Chart on Europe - Year-over-year growth 2024-2029 (%)
- Data Table on Europe - Year-over-year growth 2024-2029 (%)
- 11.6 Middle East and Africa - Market size and forecast 2024-2029
- Chart on Middle East and Africa - Market size and forecast 2024-2029 ($ million)
- Data Table on Middle East and Africa - Market size and forecast 2024-2029 ($ million)
- Chart on Middle East and Africa - Year-over-year growth 2024-2029 (%)
- Data Table on Middle East and Africa - Year-over-year growth 2024-2029 (%)
- 11.7 South America - Market size and forecast 2024-2029
- Chart on South America - Market size and forecast 2024-2029 ($ million)
- Data Table on South America - Market size and forecast 2024-2029 ($ million)
- Chart on South America - Year-over-year growth 2024-2029 (%)
- Data Table on South America - Year-over-year growth 2024-2029 (%)
- 11.8 US - Market size and forecast 2024-2029
- Chart on US - Market size and forecast 2024-2029 ($ million)
- Data Table on US - Market size and forecast 2024-2029 ($ million)
- Chart on US - Year-over-year growth 2024-2029 (%)
- Data Table on US - Year-over-year growth 2024-2029 (%)
- 11.9 China - Market size and forecast 2024-2029
- Chart on China - Market size and forecast 2024-2029 ($ million)
- Data Table on China - Market size and forecast 2024-2029 ($ million)
- Chart on China - Year-over-year growth 2024-2029 (%)
- Data Table on China - Year-over-year growth 2024-2029 (%)
- 11.10 Japan - Market size and forecast 2024-2029
- Chart on Japan - Market size and forecast 2024-2029 ($ million)
- Data Table on Japan - Market size and forecast 2024-2029 ($ million)
- Chart on Japan - Year-over-year growth 2024-2029 (%)
- Data Table on Japan - Year-over-year growth 2024-2029 (%)
- 11.11 India - Market size and forecast 2024-2029
- Chart on India - Market size and forecast 2024-2029 ($ million)
- Data Table on India - Market size and forecast 2024-2029 ($ million)
- Chart on India - Year-over-year growth 2024-2029 (%)
- Data Table on India - Year-over-year growth 2024-2029 (%)
- 11.12 Canada - Market size and forecast 2024-2029
- Chart on Canada - Market size and forecast 2024-2029 ($ million)
- Data Table on Canada - Market size and forecast 2024-2029 ($ million)
- Chart on Canada - Year-over-year growth 2024-2029 (%)
- Data Table on Canada - Year-over-year growth 2024-2029 (%)
- 11.13 Australia - Market size and forecast 2024-2029
- Chart on Australia - Market size and forecast 2024-2029 ($ million)
- Data Table on Australia - Market size and forecast 2024-2029 ($ million)
- Chart on Australia - Year-over-year growth 2024-2029 (%)
- Data Table on Australia - Year-over-year growth 2024-2029 (%)
- 11.14 Vietnam - Market size and forecast 2024-2029
- Chart on Vietnam - Market size and forecast 2024-2029 ($ million)
- Data Table on Vietnam - Market size and forecast 2024-2029 ($ million)
- Chart on Vietnam - Year-over-year growth 2024-2029 (%)
- Data Table on Vietnam - Year-over-year growth 2024-2029 (%)
- 11.15 Germany - Market size and forecast 2024-2029
- Chart on Germany - Market size and forecast 2024-2029 ($ million)
- Data Table on Germany - Market size and forecast 2024-2029 ($ million)
- Chart on Germany - Year-over-year growth 2024-2029 (%)
- Data Table on Germany - Year-over-year growth 2024-2029 (%)
- 11.16 The Netherlands - Market size and forecast 2024-2029
- Chart on The Netherlands - Market size and forecast 2024-2029 ($ million)
- Data Table on The Netherlands - Market size and forecast 2024-2029 ($ million)
- Chart on The Netherlands - Year-over-year growth 2024-2029 (%)
- Data Table on The Netherlands - Year-over-year growth 2024-2029 (%)
- 11.17 France - Market size and forecast 2024-2029
- Chart on France - Market size and forecast 2024-2029 ($ million)
- Data Table on France - Market size and forecast 2024-2029 ($ million)
- Chart on France - Year-over-year growth 2024-2029 (%)
- Data Table on France - Year-over-year growth 2024-2029 (%)
- 11.18 Market opportunity By Geographical Landscape
- Market opportunity By Geographical Landscape ($ million)
- Data Tables on Market opportunity By Geographical Landscape ($ million)
12 Drivers, Challenges, and Opportunity/Restraints
- 12.1 Market drivers
- 12.2 Market challenges
- 12.3 Impact of drivers and challenges
- Impact of drivers and challenges in 2024 and 2029
- 12.4 Market opportunities/restraints
13 Competitive Landscape
- 13.1 Overview
- 13.2 Competitive Landscape
- Overview on criticality of inputs and factors of differentiation
- 13.3 Landscape disruption
- Overview on factors of disruption
- 13.4 Industry risks
- Impact of key risks on business
14 Competitive Analysis
- 14.1 Companies profiled
- Companies covered
- 14.2 Company ranking index
- Company ranking index
- 14.3 Market positioning of companies
- Matrix on companies position and classification
- 14.4 Barry Callebaut AG
- Barry Callebaut AG - Overview
- Barry Callebaut AG - Business segments
- Barry Callebaut AG - Key news
- Barry Callebaut AG - Key offerings
- Barry Callebaut AG - Segment focus
- SWOT
- 14.5 Buderim Ginger
- Buderim Ginger - Overview
- Buderim Ginger - Product / Service
- Buderim Ginger - Key offerings
- SWOT
- 14.6 Dr Paulos Kona Coffee and Macadamia Nut Farms
- Dr Paulos Kona Coffee and Macadamia Nut Farms - Overview
- Dr Paulos Kona Coffee and Macadamia Nut Farms - Product / Service
- Dr Paulos Kona Coffee and Macadamia Nut Farms - Key offerings
- SWOT
- 14.7 Golden Macadamias Pty Ltd.
- Golden Macadamias Pty Ltd. - Overview
- Golden Macadamias Pty Ltd. - Product / Service
- Golden Macadamias Pty Ltd. - Key offerings
- SWOT
- 14.8 Hamakua Macadamia Nut Co.
- Hamakua Macadamia Nut Co. - Overview
- Hamakua Macadamia Nut Co. - Product / Service
- Hamakua Macadamia Nut Co. - Key offerings
- SWOT
- 14.9 Hawaiian Host Group
- Hawaiian Host Group - Overview
- Hawaiian Host Group - Product / Service
- Hawaiian Host Group - Key offerings
- SWOT
- 14.10 Macadamias Direct
- Macadamias Direct - Overview
- Macadamias Direct - Product / Service
- Macadamias Direct - Key offerings
- SWOT
- 14.11 Makua Coffee Co.
- Makua Coffee Co. - Overview
- Makua Coffee Co. - Product / Service
- Makua Coffee Co. - Key offerings
- SWOT
- 14.12 Marquis Macadamias
- Marquis Macadamias - Overview
- Marquis Macadamias - Product / Service
- Marquis Macadamias - Key offerings
- SWOT
- 14.13 MWT Foods
- MWT Foods - Overview
- MWT Foods - Product / Service
- MWT Foods - Key offerings
- SWOT
- 14.14 North Shore Macadamia Nut Co.
- North Shore Macadamia Nut Co. - Overview
- North Shore Macadamia Nut Co. - Product / Service
- North Shore Macadamia Nut Co. - Key offerings
- SWOT
- 14.15 Royal Macadamia Pty Ltd.
- Royal Macadamia Pty Ltd. - Overview
- Royal Macadamia Pty Ltd. - Product / Service
- Royal Macadamia Pty Ltd. - Key offerings
- SWOT
- 14.16 Superior Nut Co. Inc.
- Superior Nut Co. Inc. - Overview
- Superior Nut Co. Inc. - Product / Service
- Superior Nut Co. Inc. - Key offerings
- SWOT
- 14.17 T M Ward Coffee Inc.
- T M Ward Coffee Inc. - Overview
- T M Ward Coffee Inc. - Product / Service
- T M Ward Coffee Inc. - Key offerings
- SWOT
- 14.18 Wondaree Macadamias Nuts
- Wondaree Macadamias Nuts - Overview
- Wondaree Macadamias Nuts - Product / Service
- Wondaree Macadamias Nuts - Key offerings
- SWOT
15 Appendix
- 15.1 Scope of the report
- 15.2 Inclusions and exclusions checklist
- Inclusions checklist
- Exclusions checklist
- 15.3 Currency conversion rates for US$
- Currency conversion rates for US$
- 15.4 Research methodology
- Research methodology
- 15.5 Data procurement
- Information sources
- 15.6 Data validation
- Data validation
- 15.7 Validation techniques employed for market sizing
- Validation techniques employed for market sizing
- 15.8 Data synthesis
- Data synthesis
- 15.9 360 degree market analysis
- 360 degree market analysis
- 15.10 List of abbreviations
- List of abbreviations

