|
|
市場調査レポート
商品コード
1652848
美容レーザーの世界市場(2025年~2029年)Global Aesthetic Lasers Market 2025-2029 |
||||||

|
|||||||
カスタマイズ可能
|
|||||||


| 美容レーザーの世界市場(2025年~2029年) |
|
出版日: 2025年01月24日
発行: TechNavio
ページ情報: 英文 189 Pages
納期: 即納可能
|

全表示
- 概要
- 目次
世界の美容レーザーの市場規模は、2024年~2029年に34億4,070万米ドルに達し、予測期間中のCAGRは18%で成長すると予測されます。
当レポートでは、美容レーザー市場の全体的な分析、市場規模・予測、動向、成長促進要因、課題、約25のベンダーを網羅したベンダー分析などを掲載しています。
当レポートは、現在の市場シナリオ、最新動向と促進要因、市場環境全体に関する最新分析を提供しています。市場は、医療美容に対する世界の意識の高まり、高齢者人口の増加、非侵襲的な美容施術に対する需要の高まりによって牽引されています。
| 市場範囲 | |
|---|---|
| 基準年 | 2025年 |
| 終了年 | 2029年 |
| 予測期間 | 2025年~2029年 |
| 成長モメンタム | 加速 |
| 前年比2025年 | 15% |
| CAGR | 18% |
| 増分額 | 34億4,070万米ドル |
本調査では、今後数年間の美容レーザー市場の成長を牽引する主な要因の1つとして、男性美容業界の成長機会を挙げています。また、医療ツーリズムの増加やレーザー技術の進歩は、市場の大きな需要につながります。
目次
第1章 エグゼクティブサマリー
- 市場概要
第2章 Technavioの分析
- 価格感度・ライフサイクル・顧客購入バスケット・採用率・購入基準の分析
- インプットの重要性と差別化の要因
- ディスラプションの要因
- 促進要因と課題の影響
第3章 市場情勢
- 市場エコシステム
- 市場の特徴
- バリューチェーン分析
第4章 市場規模
- 市場の定義
- 市場セグメント分析
- 市場規模(2024年)
- 市場の見通し(2024年~2029年)
第5章 市場規模実績
- 美容レーザーの世界市場(2019年~2023年)
- タイプセグメント分析(2019年~2023年)
- エンドユーザーセグメント分析(2019年~2023年)
- 地域セグメント分析(2019年~2023年)
- 国セグメント分析(2019年~2023年)
第6章 定性分析
- AIの影響:美容レーザーの世界市場
第7章 ファイブフォース分析
- ファイブフォースの要約
- 買い手の交渉力
- 供給企業の交渉力
- 新規参入業者の脅威
- 代替品の脅威
- 競争の脅威
- 市況
第8章 市場セグメンテーション:タイプ別
- 市場セグメント
- 比較:タイプ別
- スタンドアロンレーザーデバイス:市場規模と予測(2024年~2029年)
- マルチプラットフォームレーザーデバイス:市場規模と予測(2024年~2029年)
- 市場機会:タイプ別
第9章 市場セグメンテーション:エンドユーザー別
- 市場セグメント
- 比較:エンドユーザー別
- 病院:市場規模と予測(2024年~2029年)
- クリニック:市場規模と予測(2024年~2029年)
- メディカルスパ:市場規模と予測(2024年~2029年)
- 市場機会:エンドユーザー別
第10章 顧客情勢
- 顧客情勢の概要
第11章 地域別情勢
- 地域別セグメンテーション
- 地域別比較
- 北米:市場規模と予測(2024年~2029年)
- 欧州:市場規模と予測(2024年~2029年)
- アジア:市場規模と予測(2024年~2029年)
- 世界のその他の地域:市場規模と予測(2024年~2029年)
- 米国:市場規模と予測(2024年~2029年)
- カナダ:市場規模と予測(2024年~2029年)
- 中国:市場規模と予測(2024年~2029年)
- ドイツ:市場規模と予測(2024年~2029年)
- オーストラリア:市場規模と予測(2024年~2029年)
- 英国:市場規模と予測(2024年~2029年)
- 日本:市場規模と予測(2024年~2029年)
- インド:市場規模と予測(2024年~2029年)
- サウジアラビア:市場規模と予測(2024年~2029年)
- フランス:市場規模と予測(2024年~2029年)
- 市場機会:地域情勢別
第12章 促進要因・課題・機会・抑制要因
- 市場促進要因
- 市場の課題
- 促進要因と課題の影響
- 市場の機会・抑制要因
第13章 競合情勢
- 概要
- 競合情勢
- ディスラプションの状況
- 業界のリスク
第14章 競合分析
- 企業プロファイル
- 企業ランキング指数
- 企業の市場ポジショニング
- Bausch Health Companies Inc.
- Candela Corp.
- Cutera Inc.
- Cynosure LLC
- DEKA M.E.L.A. S.r.l.
- Elesta SpA
- Fotona d.o.o
- Hologic Inc.
- Lumenis Be Ltd.
- Lutronic Inc.
- Lynton Lasers Ltd.
- Quanta System S.p.A.
- Sciton Inc.
- Sisram Medical Ltd
- Strata Skin Sciences Inc
第15章 付録
The aesthetic lasers market is forecasted to grow by USD 3440.7 mn during 2024-2029, accelerating at a CAGR of 18% during the forecast period. The report on the aesthetic lasers market provides a holistic analysis, market size and forecast, trends, growth drivers, and challenges, as well as vendor analysis covering around 25 vendors.
The report offers an up-to-date analysis regarding the current market scenario, the latest trends and drivers, and the overall market environment. The market is driven by increasing global awareness about medical aesthetics, growing geriatric population, and rising demand for non-invasive cosmetic procedures.
| Market Scope | |
|---|---|
| Base Year | 2025 |
| End Year | 2029 |
| Series Year | 2025-2029 |
| Growth Momentum | Accelerate |
| YOY 2025 | 15% |
| CAGR | 18% |
| Incremental Value | $3440.7 mn |
Technavio's aesthetic lasers market is segmented as below:
By Type
- Standalone laser devices
- Multiplatform laser devices
By End-user
- Hospitals
- Clinics
- Medical spas
By Geographical Landscape
- North America
- Europe
- Asia
- Rest of World (ROW)
This study identifies the opportunities for growth in male aesthetics industry as one of the prime reasons driving the aesthetic lasers market growth during the next few years. Also, rise in medical tourism and advancements in laser technology will lead to sizable demand in the market.
The report on the aesthetic lasers market covers the following areas:
- Aesthetic Lasers Market sizing
- Aesthetic Lasers Market forecast
- Aesthetic Lasers Market industry analysis
The robust vendor analysis is designed to help clients improve their market position, and in line with this, this report provides a detailed analysis of several leading aesthetic lasers market vendors that include Australian Aesthetic Devices Pty Ltd, Bausch Health Companies Inc., Candela Corp., Cutera Inc., Cynosure LLC, DEKA M.E.L.A. S.r.l., Elesta SpA, Fotona d.o.o, Galderma S.A., Gooch and Housego Plc, Hologic Inc., Lumenis Be Ltd., Lutronic Inc., Lynton Lasers Ltd., Quanta System S.p.A., Sciton Inc., Shanghai Fosun Pharmaceutical Group Co. Ltd., SharpLight Technologies Inc., Sisram Medical Ltd, and Strata Skin Sciences Inc. Also, the aesthetic lasers market analysis report includes information on upcoming trends and challenges that will influence market growth. This is to help companies strategize and leverage all forthcoming growth opportunities.
The study was conducted using an objective combination of primary and secondary information including inputs from key participants in the industry. The report contains a comprehensive market and vendor landscape in addition to an analysis of the key vendors.
The publisher presents a detailed picture of the market by the way of study, synthesis, and summation of data from multiple sources by an analysis of key parameters such as profit, pricing, competition, and promotions. It presents various market facets by identifying the key industry influencers. The data presented is comprehensive, reliable, and a result of extensive primary and secondary research. The market research reports provide a complete competitive landscape and an in-depth vendor selection methodology and analysis using qualitative and quantitative research to forecast accurate market growth.
Table of Contents
1 Executive Summary
- 1.1 Market overview
- Executive Summary - Chart on Market Overview
- Executive Summary - Data Table on Market Overview
- Executive Summary - Chart on Global Market Characteristics
- Executive Summary - Chart on Market By Geographical Landscape
- Executive Summary - Chart on Market Segmentation by Type
- Executive Summary - Chart on Market Segmentation by End-user
- Executive Summary - Chart on Incremental Growth
- Executive Summary - Data Table on Incremental Growth
- Executive Summary - Chart on Company Market Positioning
2 Technavio Analysis
- 2.1 Analysis of price sensitivity, lifecycle, customer purchase basket, adoption rates, and purchase criteria
- Analysis of price sensitivity, lifecycle, customer purchase basket, adoption rates, and purchase criteria
- 2.2 Criticality of inputs and Factors of differentiation
- Overview on criticality of inputs and factors of differentiation
- 2.3 Factors of disruption
- Overview on factors of disruption
- 2.4 Impact of drivers and challenges
- Impact of drivers and challenges in 2024 and 2029
3 Market Landscape
- 3.1 Market ecosystem
- Parent Market
- Data Table on - Parent Market
- 3.2 Market characteristics
- Market characteristics analysis
- 3.3 Value chain analysis
- Value chain analysis
4 Market Sizing
- 4.1 Market definition
- Offerings of companies included in the market definition
- 4.2 Market segment analysis
- Market segments
- 4.3 Market size 2024
- 4.4 Market outlook: Forecast for 2024-2029
- Chart on Global - Market size and forecast 2024-2029 ($ million)
- Data Table on Global - Market size and forecast 2024-2029 ($ million)
- Chart on Global Market: Year-over-year growth 2024-2029 (%)
- Data Table on Global Market: Year-over-year growth 2024-2029 (%)
5 Historic Market Size
- 5.1 Global Aesthetic Lasers Market 2019 - 2023
- Historic Market Size - Data Table on Global Aesthetic Lasers Market 2019 - 2023 ($ million)
- 5.2 Type segment analysis 2019 - 2023
- Historic Market Size - Type Segment 2019 - 2023 ($ million)
- 5.3 End-user segment analysis 2019 - 2023
- Historic Market Size - End-user Segment 2019 - 2023 ($ million)
- 5.4 Geography segment analysis 2019 - 2023
- Historic Market Size - Geography Segment 2019 - 2023 ($ million)
- 5.5 Country segment analysis 2019 - 2023
- Historic Market Size - Country Segment 2019 - 2023 ($ million)
6 Qualitative Analysis
- 6.1 Impact of AI on Global Aesthetic Lasers Market
7 Five Forces Analysis
- 7.1 Five forces summary
- Five forces analysis - Comparison between 2024 and 2029
- 7.2 Bargaining power of buyers
- Bargaining power of buyers - Impact of key factors 2024 and 2029
- 7.3 Bargaining power of suppliers
- Bargaining power of suppliers - Impact of key factors in 2024 and 2029
- 7.4 Threat of new entrants
- Threat of new entrants - Impact of key factors in 2024 and 2029
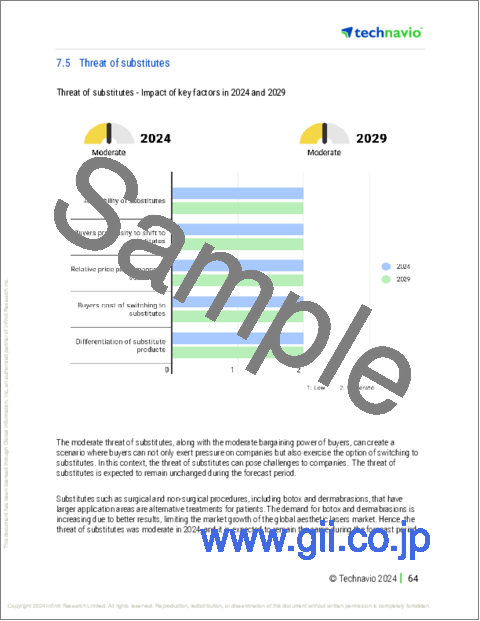
- 7.5 Threat of substitutes
- Threat of substitutes - Impact of key factors in 2024 and 2029
- 7.6 Threat of rivalry
- Threat of rivalry - Impact of key factors in 2024 and 2029
- 7.7 Market condition
- Chart on Market condition - Five forces 2024 and 2029
8 Market Segmentation by Type
- 8.1 Market segments
- Chart on Type - Market share 2024-2029 (%)
- Data Table on Type - Market share 2024-2029 (%)
- 8.2 Comparison by Type
- Chart on Comparison by Type
- Data Table on Comparison by Type
- 8.3 Standalone laser devices - Market size and forecast 2024-2029
- Chart on Standalone laser devices - Market size and forecast 2024-2029 ($ million)
- Data Table on Standalone laser devices - Market size and forecast 2024-2029 ($ million)
- Chart on Standalone laser devices - Year-over-year growth 2024-2029 (%)
- Data Table on Standalone laser devices - Year-over-year growth 2024-2029 (%)
- 8.4 Multiplatform laser devices - Market size and forecast 2024-2029
- Chart on Multiplatform laser devices - Market size and forecast 2024-2029 ($ million)
- Data Table on Multiplatform laser devices - Market size and forecast 2024-2029 ($ million)
- Chart on Multiplatform laser devices - Year-over-year growth 2024-2029 (%)
- Data Table on Multiplatform laser devices - Year-over-year growth 2024-2029 (%)
- 8.5 Market opportunity by Type
- Market opportunity by Type ($ million)
- Data Table on Market opportunity by Type ($ million)
9 Market Segmentation by End-user
- 9.1 Market segments
- Chart on End-user - Market share 2024-2029 (%)
- Data Table on End-user - Market share 2024-2029 (%)
- 9.2 Comparison by End-user
- Chart on Comparison by End-user
- Data Table on Comparison by End-user
- 9.3 Hospitals - Market size and forecast 2024-2029
- Chart on Hospitals - Market size and forecast 2024-2029 ($ million)
- Data Table on Hospitals - Market size and forecast 2024-2029 ($ million)
- Chart on Hospitals - Year-over-year growth 2024-2029 (%)
- Data Table on Hospitals - Year-over-year growth 2024-2029 (%)
- 9.4 Clinics - Market size and forecast 2024-2029
- Chart on Clinics - Market size and forecast 2024-2029 ($ million)
- Data Table on Clinics - Market size and forecast 2024-2029 ($ million)
- Chart on Clinics - Year-over-year growth 2024-2029 (%)
- Data Table on Clinics - Year-over-year growth 2024-2029 (%)
- 9.5 Medical spas - Market size and forecast 2024-2029
- Chart on Medical spas - Market size and forecast 2024-2029 ($ million)
- Data Table on Medical spas - Market size and forecast 2024-2029 ($ million)
- Chart on Medical spas - Year-over-year growth 2024-2029 (%)
- Data Table on Medical spas - Year-over-year growth 2024-2029 (%)
- 9.6 Market opportunity by End-user
- Market opportunity by End-user ($ million)
- Data Table on Market opportunity by End-user ($ million)
10 Customer Landscape
- 10.1 Customer landscape overview
- Analysis of price sensitivity, lifecycle, customer purchase basket, adoption rates, and purchase criteria
11 Geographic Landscape
- 11.1 Geographic segmentation
- Chart on Market share By Geographical Landscape 2024-2029 (%)
- Data Table on Market share By Geographical Landscape 2024-2029 (%)
- 11.2 Geographic comparison
- Chart on Geographic comparison
- Data Table on Geographic comparison
- 11.3 North America - Market size and forecast 2024-2029
- Chart on North America - Market size and forecast 2024-2029 ($ million)
- Data Table on North America - Market size and forecast 2024-2029 ($ million)
- Chart on North America - Year-over-year growth 2024-2029 (%)
- Data Table on North America - Year-over-year growth 2024-2029 (%)
- 11.4 Europe - Market size and forecast 2024-2029
- Chart on Europe - Market size and forecast 2024-2029 ($ million)
- Data Table on Europe - Market size and forecast 2024-2029 ($ million)
- Chart on Europe - Year-over-year growth 2024-2029 (%)
- Data Table on Europe - Year-over-year growth 2024-2029 (%)
- 11.5 Asia - Market size and forecast 2024-2029
- Chart on Asia - Market size and forecast 2024-2029 ($ million)
- Data Table on Asia - Market size and forecast 2024-2029 ($ million)
- Chart on Asia - Year-over-year growth 2024-2029 (%)
- Data Table on Asia - Year-over-year growth 2024-2029 (%)
- 11.6 Rest of World (ROW) - Market size and forecast 2024-2029
- Chart on Rest of World (ROW) - Market size and forecast 2024-2029 ($ million)
- Data Table on Rest of World (ROW) - Market size and forecast 2024-2029 ($ million)
- Chart on Rest of World (ROW) - Year-over-year growth 2024-2029 (%)
- Data Table on Rest of World (ROW) - Year-over-year growth 2024-2029 (%)
- 11.7 US - Market size and forecast 2024-2029
- Chart on US - Market size and forecast 2024-2029 ($ million)
- Data Table on US - Market size and forecast 2024-2029 ($ million)
- Chart on US - Year-over-year growth 2024-2029 (%)
- Data Table on US - Year-over-year growth 2024-2029 (%)
- 11.8 Canada - Market size and forecast 2024-2029
- Chart on Canada - Market size and forecast 2024-2029 ($ million)
- Data Table on Canada - Market size and forecast 2024-2029 ($ million)
- Chart on Canada - Year-over-year growth 2024-2029 (%)
- Data Table on Canada - Year-over-year growth 2024-2029 (%)
- 11.9 China - Market size and forecast 2024-2029
- Chart on China - Market size and forecast 2024-2029 ($ million)
- Data Table on China - Market size and forecast 2024-2029 ($ million)
- Chart on China - Year-over-year growth 2024-2029 (%)
- Data Table on China - Year-over-year growth 2024-2029 (%)
- 11.10 Germany - Market size and forecast 2024-2029
- Chart on Germany - Market size and forecast 2024-2029 ($ million)
- Data Table on Germany - Market size and forecast 2024-2029 ($ million)
- Chart on Germany - Year-over-year growth 2024-2029 (%)
- Data Table on Germany - Year-over-year growth 2024-2029 (%)
- 11.11 Australia - Market size and forecast 2024-2029
- Chart on Australia - Market size and forecast 2024-2029 ($ million)
- Data Table on Australia - Market size and forecast 2024-2029 ($ million)
- Chart on Australia - Year-over-year growth 2024-2029 (%)
- Data Table on Australia - Year-over-year growth 2024-2029 (%)
- 11.12 UK - Market size and forecast 2024-2029
- Chart on UK - Market size and forecast 2024-2029 ($ million)
- Data Table on UK - Market size and forecast 2024-2029 ($ million)
- Chart on UK - Year-over-year growth 2024-2029 (%)
- Data Table on UK - Year-over-year growth 2024-2029 (%)
- 11.13 Japan - Market size and forecast 2024-2029
- Chart on Japan - Market size and forecast 2024-2029 ($ million)
- Data Table on Japan - Market size and forecast 2024-2029 ($ million)
- Chart on Japan - Year-over-year growth 2024-2029 (%)
- Data Table on Japan - Year-over-year growth 2024-2029 (%)
- 11.14 India - Market size and forecast 2024-2029
- Chart on India - Market size and forecast 2024-2029 ($ million)
- Data Table on India - Market size and forecast 2024-2029 ($ million)
- Chart on India - Year-over-year growth 2024-2029 (%)
- Data Table on India - Year-over-year growth 2024-2029 (%)
- 11.15 Saudi Arabia - Market size and forecast 2024-2029
- Chart on Saudi Arabia - Market size and forecast 2024-2029 ($ million)
- Data Table on Saudi Arabia - Market size and forecast 2024-2029 ($ million)
- Chart on Saudi Arabia - Year-over-year growth 2024-2029 (%)
- Data Table on Saudi Arabia - Year-over-year growth 2024-2029 (%)
- 11.16 France - Market size and forecast 2024-2029
- Chart on France - Market size and forecast 2024-2029 ($ million)
- Data Table on France - Market size and forecast 2024-2029 ($ million)
- Chart on France - Year-over-year growth 2024-2029 (%)
- Data Table on France - Year-over-year growth 2024-2029 (%)
- 11.17 Market opportunity By Geographical Landscape
- Market opportunity By Geographical Landscape ($ million)
- Data Tables on Market opportunity By Geographical Landscape ($ million)
12 Drivers, Challenges, and Opportunity/Restraints
- 12.1 Market drivers
- 12.2 Market challenges
- 12.3 Impact of drivers and challenges
- Impact of drivers and challenges in 2024 and 2029
- 12.4 Market opportunities/restraints
13 Competitive Landscape
- 13.1 Overview
- 13.2 Competitive Landscape
- Overview on criticality of inputs and factors of differentiation
- 13.3 Landscape disruption
- Overview on factors of disruption
- 13.4 Industry risks
- Impact of key risks on business
14 Competitive Analysis
- 14.1 Companies profiled
- Companies covered
- 14.2 Company ranking index
- Company ranking index
- 14.3 Market positioning of companies
- Matrix on companies position and classification
- 14.4 Bausch Health Companies Inc.
- Bausch Health Companies Inc. - Overview
- Bausch Health Companies Inc. - Business segments
- Bausch Health Companies Inc. - Key news
- Bausch Health Companies Inc. - Key offerings
- Bausch Health Companies Inc. - Segment focus
- SWOT
- 14.5 Candela Corp.
- Candela Corp. - Overview
- Candela Corp. - Product / Service
- Candela Corp. - Key offerings
- SWOT
- 14.6 Cutera Inc.
- Cutera Inc. - Overview
- Cutera Inc. - Product / Service
- Cutera Inc. - Key news
- Cutera Inc. - Key offerings
- SWOT
- 14.7 Cynosure LLC
- Cynosure LLC - Overview
- Cynosure LLC - Product / Service
- Cynosure LLC - Key offerings
- SWOT
- 14.8 DEKA M.E.L.A. S.r.l.
- DEKA M.E.L.A. S.r.l. - Overview
- DEKA M.E.L.A. S.r.l. - Product / Service
- DEKA M.E.L.A. S.r.l. - Key offerings
- SWOT
- 14.9 Elesta SpA
- Elesta SpA - Overview
- Elesta SpA - Product / Service
- Elesta SpA - Key offerings
- SWOT
- 14.10 Fotona d.o.o
- Fotona d.o.o - Overview
- Fotona d.o.o - Product / Service
- Fotona d.o.o - Key offerings
- SWOT
- 14.11 Hologic Inc.
- Hologic Inc. - Overview
- Hologic Inc. - Business segments
- Hologic Inc. - Key news
- Hologic Inc. - Key offerings
- Hologic Inc. - Segment focus
- SWOT
- 14.12 Lumenis Be Ltd.
- Lumenis Be Ltd. - Overview
- Lumenis Be Ltd. - Product / Service
- Lumenis Be Ltd. - Key offerings
- SWOT
- 14.13 Lutronic Inc.
- Lutronic Inc. - Overview
- Lutronic Inc. - Product / Service
- Lutronic Inc. - Key offerings
- SWOT
- 14.14 Lynton Lasers Ltd.
- Lynton Lasers Ltd. - Overview
- Lynton Lasers Ltd. - Product / Service
- Lynton Lasers Ltd. - Key offerings
- SWOT
- 14.15 Quanta System S.p.A.
- Quanta System S.p.A. - Overview
- Quanta System S.p.A. - Product / Service
- Quanta System S.p.A. - Key offerings
- SWOT
- 14.16 Sciton Inc.
- Sciton Inc. - Overview
- Sciton Inc. - Product / Service
- Sciton Inc. - Key offerings
- SWOT
- 14.17 Sisram Medical Ltd
- Sisram Medical Ltd - Overview
- Sisram Medical Ltd - Product / Service
- Sisram Medical Ltd - Key offerings
- SWOT
- 14.18 Strata Skin Sciences Inc
- Strata Skin Sciences Inc - Overview
- Strata Skin Sciences Inc - Business segments
- Strata Skin Sciences Inc - Key offerings
- Strata Skin Sciences Inc - Segment focus
- SWOT
15 Appendix
- 15.1 Scope of the report
- 15.2 Inclusions and exclusions checklist
- Inclusions checklist
- Exclusions checklist
- 15.3 Currency conversion rates for US$
- Currency conversion rates for US$
- 15.4 Research methodology
- Research methodology
- 15.5 Data procurement
- Information sources
- 15.6 Data validation
- Data validation
- 15.7 Validation techniques employed for market sizing
- Validation techniques employed for market sizing
- 15.8 Data synthesis
- Data synthesis
- 15.9 360 degree market analysis
- 360 degree market analysis
- 15.10 List of abbreviations
- List of abbreviations

