|
|
市場調査レポート
商品コード
1634266
スマートスタジアムの世界市場(2025年~2029年)Global Smart Stadium Market 2025-2029 |
||||||

|
|||||||
カスタマイズ可能
|
|||||||


| スマートスタジアムの世界市場(2025年~2029年) |
|
出版日: 2025年01月07日
発行: TechNavio
ページ情報: 英文 217 Pages
納期: 即納可能
|

全表示
- 概要
- 図表
- 目次
スマートスタジアム市場(2025年~2029年)
世界のスマートスタジアムの市場規模は、2024年~2029年に679億9,920万米ドルに達し、予測期間中のCAGRは30.9%で成長すると予測されます。当レポートでは、スマートスタジアム市場の全体的な分析、市場規模・予測、動向、成長促進要因、課題、約25のベンダーを網羅したベンダー分析などを掲載しています。
本レポートは、現在の市場シナリオ、最新動向と促進要因、市場環境全体に関する最新分析を提供しています。同市場は、運営効率の向上、観客体験の改善、スポーツイベントの増加によって牽引されています。
| 市場範囲 | |
|---|---|
| 基準年 | 2025年 |
| 終了年 | 2029年 |
| 予測期間 | 2025年~2029年 |
| 成長モメンタム | 加速 |
| 前年比2025年 | 29.4% |
| CAGR | 30.9% |
| 増分額 | 679億9,920万米ドル |
本調査では、スタジアムにおける拡張現実(AR)の出現が、今後数年間のスマートスタジアム市場の成長を促進する主要な理由の1つであると特定しています。また、ビッグデータ解析の採用や人工知能(AI)の採用拡大も、市場の大きな需要につながります。
目次
第1章 エグゼクティブサマリー
- 市場概要
第2章 Technavioの分析
- 価格感度・ライフサイクル・顧客購入バスケット・採用率・購入基準の分析
- インプットの重要性と差別化の要因
- ディスラプションの要因
- 促進要因と課題の影響
第3章 市場情勢
- 市場エコシステム
- 市場の特徴
- バリューチェーン分析
第4章 市場規模
- 市場の定義
- 市場セグメント分析
- 市場規模(2024年)
- 市場の見通し(2024年~2029年)
第5章 市場規模実績
- スマートスタジアムの世界市場(2019年~2023年)
- ソフトウェアセグメント分析(2019年~2023年)
- 展開セグメント分析(2019年~2023年)
- 地域セグメント分析(2019年~2023年)
- 国セグメント分析(2019年~2023年)
第6章 定性分析
- AIの影響:スマートスタジアムの世界市場
第7章 ファイブフォース分析
- ファイブフォースの要約
- 買い手の交渉力
- 供給企業の交渉力
- 新規参入業者の脅威
- 代替品の脅威
- 競争の脅威
- 市況
第8章 市場セグメンテーション:ソフトウェア別
- 市場セグメント
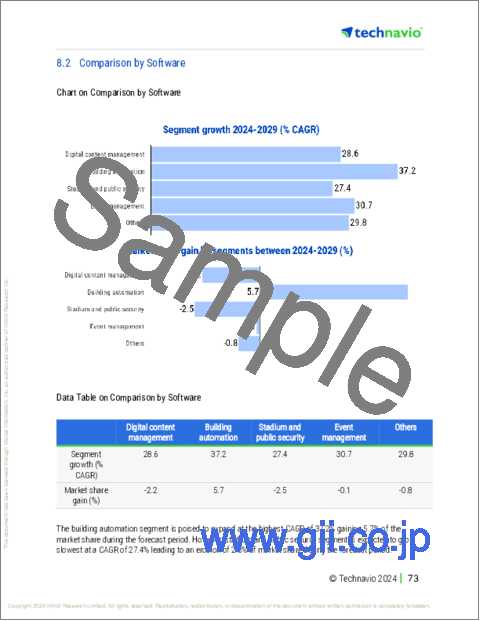
- 比較:ソフトウェア別
- デジタルコンテンツ管理:市場規模と予測(2024年~2029年)
- ビルオートメーション:市場規模と予測(2024年~2029年)
- スタジアムと治安:市場規模と予測(2024年~2029年)
- イベント管理:市場規模と予測(2024年~2029年)
- その他:市場規模と予測(2024年~2029年)
- 市場機会:ソフトウェア別
第9章 市場セグメンテーション:展開別
- 市場セグメント
- 比較:展開別
- オンプレミス:市場規模と予測(2024年~2029年)
- クラウドベース:市場規模と予測(2024年~2029年)
- 市場機会:展開別
第10章 顧客情勢
- 顧客情勢の概要
第11章 地域別情勢
- 地域別セグメンテーション
- 地域別比較
- 欧州:市場規模と予測(2024年~2029年)
- 北米:市場規模と予測(2024年~2029年)
- アジア太平洋:市場規模と予測(2024年~2029年)
- 南米:市場規模と予測(2024年~2029年)
- 中東・アフリカ:市場規模と予測(2024年~2029年)
- 米国:市場規模と予測(2024年~2029年)
- 英国:市場規模と予測(2024年~2029年)
- ドイツ:市場規模と予測(2024年~2029年)
- カナダ:市場規模と予測(2024年~2029年)
- フランス:市場規模と予測(2024年~2029年)
- 中国:市場規模と予測(2024年~2029年)
- イタリア:市場規模と予測(2024年~2029年)
- 日本:市場規模と予測(2024年~2029年)
- オランダ:市場規模と予測(2024年~2029年)
- スペイン:市場規模と予測(2024年~2029年)
- 市場機会:地域情勢別
第12章 促進要因・課題・機会・抑制要因
- 市場促進要因
- 市場の課題
- 促進要因と課題の影響
- 市場の機会・抑制要因
第13章 競合情勢
- 概要
- 競合情勢
- ディスラプションの状況
- 業界のリスク
第14章 競合分析
- 企業プロファイル
- 企業ランキング指数
- 企業の市場ポジショニング
- Avaya LLC
- Cisco Systems Inc.
- Dell Technologies Inc.
- Dignia Systems Ltd.
- DS worldwide Ltd.
- GP Smart Stadium
- Hawk Eye Innovations Ltd.
- Hewlett Packard Enterprise Co.
- Huawei Technologies Co. Ltd.
- Infosys Ltd.
- Intel Corp.
- International Business Machines Corp.
- Johnson Controls International Plc
- Lumen Technologies Inc.
- NEC Corp.
第15章 付録
Exhibits:
- Exhibits1: Executive Summary - Chart on Market Overview
- Exhibits2: Executive Summary - Data Table on Market Overview
- Exhibits3: Executive Summary - Chart on Global Market Characteristics
- Exhibits4: Executive Summary - Chart on Market By Geographical Landscape
- Exhibits5: Executive Summary - Chart on Market Segmentation by Software
- Exhibits6: Executive Summary - Chart on Market Segmentation by Deployment
- Exhibits7: Executive Summary - Chart on Incremental Growth
- Exhibits8: Executive Summary - Data Table on Incremental Growth
- Exhibits9: Executive Summary - Chart on Company Market Positioning
- Exhibits10: Analysis of price sensitivity, lifecycle, customer purchase basket, adoption rates, and purchase criteria
- Exhibits11: Overview on criticality of inputs and factors of differentiation
- Exhibits12: Overview on factors of disruption
- Exhibits13: Impact of drivers and challenges in 2024 and 2029
- Exhibits14: Parent Market
- Exhibits15: Data Table on - Parent Market
- Exhibits16: Market characteristics analysis
- Exhibits17: Value chain analysis
- Exhibits18: Offerings of companies included in the market definition
- Exhibits19: Market segments
- Exhibits20: Chart on Global - Market size and forecast 2024-2029 ($ million)
- Exhibits21: Data Table on Global - Market size and forecast 2024-2029 ($ million)
- Exhibits22: Chart on Global Market: Year-over-year growth 2024-2029 (%)
- Exhibits23: Data Table on Global Market: Year-over-year growth 2024-2029 (%)
- Exhibits24: Historic Market Size - Data Table on Global Smart Stadium Market 2019 - 2023 ($ million)
- Exhibits25: Historic Market Size - Software Segment 2019 - 2023 ($ million)
- Exhibits26: Historic Market Size - Deployment Segment 2019 - 2023 ($ million)
- Exhibits27: Historic Market Size - Geography Segment 2019 - 2023 ($ million)
- Exhibits28: Historic Market Size - Country Segment 2019 - 2023 ($ million)
- Exhibits29: Five forces analysis - Comparison between 2024 and 2029
- Exhibits30: Bargaining power of buyers - Impact of key factors 2024 and 2029
- Exhibits31: Bargaining power of suppliers - Impact of key factors in 2024 and 2029
- Exhibits32: Threat of new entrants - Impact of key factors in 2024 and 2029
- Exhibits33: Threat of substitutes - Impact of key factors in 2024 and 2029
- Exhibits34: Threat of rivalry - Impact of key factors in 2024 and 2029
- Exhibits35: Chart on Market condition - Five forces 2024 and 2029
- Exhibits36: Chart on Software - Market share 2024-2029 (%)
- Exhibits37: Data Table on Software - Market share 2024-2029 (%)
- Exhibits38: Chart on Comparison by Software
- Exhibits39: Data Table on Comparison by Software
- Exhibits40: Chart on Digital content management - Market size and forecast 2024-2029 ($ million)
- Exhibits41: Data Table on Digital content management - Market size and forecast 2024-2029 ($ million)
- Exhibits42: Chart on Digital content management - Year-over-year growth 2024-2029 (%)
- Exhibits43: Data Table on Digital content management - Year-over-year growth 2024-2029 (%)
- Exhibits44: Chart on Building automation - Market size and forecast 2024-2029 ($ million)
- Exhibits45: Data Table on Building automation - Market size and forecast 2024-2029 ($ million)
- Exhibits46: Chart on Building automation - Year-over-year growth 2024-2029 (%)
- Exhibits47: Data Table on Building automation - Year-over-year growth 2024-2029 (%)
- Exhibits48: Chart on Stadium and public security - Market size and forecast 2024-2029 ($ million)
- Exhibits49: Data Table on Stadium and public security - Market size and forecast 2024-2029 ($ million)
- Exhibits50: Chart on Stadium and public security - Year-over-year growth 2024-2029 (%)
- Exhibits51: Data Table on Stadium and public security - Year-over-year growth 2024-2029 (%)
- Exhibits52: Chart on Event management - Market size and forecast 2024-2029 ($ million)
- Exhibits53: Data Table on Event management - Market size and forecast 2024-2029 ($ million)
- Exhibits54: Chart on Event management - Year-over-year growth 2024-2029 (%)
- Exhibits55: Data Table on Event management - Year-over-year growth 2024-2029 (%)
- Exhibits56: Chart on Others - Market size and forecast 2024-2029 ($ million)
- Exhibits57: Data Table on Others - Market size and forecast 2024-2029 ($ million)
- Exhibits58: Chart on Others - Year-over-year growth 2024-2029 (%)
- Exhibits59: Data Table on Others - Year-over-year growth 2024-2029 (%)
- Exhibits60: Market opportunity by Software ($ million)
- Exhibits61: Data Table on Market opportunity by Software ($ million)
- Exhibits62: Chart on Deployment - Market share 2024-2029 (%)
- Exhibits63: Data Table on Deployment - Market share 2024-2029 (%)
- Exhibits64: Chart on Comparison by Deployment
- Exhibits65: Data Table on Comparison by Deployment
- Exhibits66: Chart on On-premises - Market size and forecast 2024-2029 ($ million)
- Exhibits67: Data Table on On-premises - Market size and forecast 2024-2029 ($ million)
- Exhibits68: Chart on On-premises - Year-over-year growth 2024-2029 (%)
- Exhibits69: Data Table on On-premises - Year-over-year growth 2024-2029 (%)
- Exhibits70: Chart on Cloud-based - Market size and forecast 2024-2029 ($ million)
- Exhibits71: Data Table on Cloud-based - Market size and forecast 2024-2029 ($ million)
- Exhibits72: Chart on Cloud-based - Year-over-year growth 2024-2029 (%)
- Exhibits73: Data Table on Cloud-based - Year-over-year growth 2024-2029 (%)
- Exhibits74: Market opportunity by Deployment ($ million)
- Exhibits75: Data Table on Market opportunity by Deployment ($ million)
- Exhibits76: Analysis of price sensitivity, lifecycle, customer purchase basket, adoption rates, and purchase criteria
- Exhibits77: Chart on Market share By Geographical Landscape 2024-2029 (%)
- Exhibits78: Data Table on Market share By Geographical Landscape 2024-2029 (%)
- Exhibits79: Chart on Geographic comparison
- Exhibits80: Data Table on Geographic comparison
- Exhibits81: Chart on Europe - Market size and forecast 2024-2029 ($ million)
- Exhibits82: Data Table on Europe - Market size and forecast 2024-2029 ($ million)
- Exhibits83: Chart on Europe - Year-over-year growth 2024-2029 (%)
- Exhibits84: Data Table on Europe - Year-over-year growth 2024-2029 (%)
- Exhibits85: Chart on North America - Market size and forecast 2024-2029 ($ million)
- Exhibits86: Data Table on North America - Market size and forecast 2024-2029 ($ million)
- Exhibits87: Chart on North America - Year-over-year growth 2024-2029 (%)
- Exhibits88: Data Table on North America - Year-over-year growth 2024-2029 (%)
- Exhibits89: Chart on APAC - Market size and forecast 2024-2029 ($ million)
- Exhibits90: Data Table on APAC - Market size and forecast 2024-2029 ($ million)
- Exhibits91: Chart on APAC - Year-over-year growth 2024-2029 (%)
- Exhibits92: Data Table on APAC - Year-over-year growth 2024-2029 (%)
- Exhibits93: Chart on South America - Market size and forecast 2024-2029 ($ million)
- Exhibits94: Data Table on South America - Market size and forecast 2024-2029 ($ million)
- Exhibits95: Chart on South America - Year-over-year growth 2024-2029 (%)
- Exhibits96: Data Table on South America - Year-over-year growth 2024-2029 (%)
- Exhibits97: Chart on Middle East and Africa - Market size and forecast 2024-2029 ($ million)
- Exhibits98: Data Table on Middle East and Africa - Market size and forecast 2024-2029 ($ million)
- Exhibits99: Chart on Middle East and Africa - Year-over-year growth 2024-2029 (%)
- Exhibits100: Data Table on Middle East and Africa - Year-over-year growth 2024-2029 (%)
- Exhibits101: Chart on US - Market size and forecast 2024-2029 ($ million)
- Exhibits102: Data Table on US - Market size and forecast 2024-2029 ($ million)
- Exhibits103: Chart on US - Year-over-year growth 2024-2029 (%)
- Exhibits104: Data Table on US - Year-over-year growth 2024-2029 (%)
- Exhibits105: Chart on UK - Market size and forecast 2024-2029 ($ million)
- Exhibits106: Data Table on UK - Market size and forecast 2024-2029 ($ million)
- Exhibits107: Chart on UK - Year-over-year growth 2024-2029 (%)
- Exhibits108: Data Table on UK - Year-over-year growth 2024-2029 (%)
- Exhibits109: Chart on Germany - Market size and forecast 2024-2029 ($ million)
- Exhibits110: Data Table on Germany - Market size and forecast 2024-2029 ($ million)
- Exhibits111: Chart on Germany - Year-over-year growth 2024-2029 (%)
- Exhibits112: Data Table on Germany - Year-over-year growth 2024-2029 (%)
- Exhibits113: Chart on Canada - Market size and forecast 2024-2029 ($ million)
- Exhibits114: Data Table on Canada - Market size and forecast 2024-2029 ($ million)
- Exhibits115: Chart on Canada - Year-over-year growth 2024-2029 (%)
- Exhibits116: Data Table on Canada - Year-over-year growth 2024-2029 (%)
- Exhibits117: Chart on France - Market size and forecast 2024-2029 ($ million)
- Exhibits118: Data Table on France - Market size and forecast 2024-2029 ($ million)
- Exhibits119: Chart on France - Year-over-year growth 2024-2029 (%)
- Exhibits120: Data Table on France - Year-over-year growth 2024-2029 (%)
- Exhibits121: Chart on China - Market size and forecast 2024-2029 ($ million)
- Exhibits122: Data Table on China - Market size and forecast 2024-2029 ($ million)
- Exhibits123: Chart on China - Year-over-year growth 2024-2029 (%)
- Exhibits124: Data Table on China - Year-over-year growth 2024-2029 (%)
- Exhibits125: Chart on Italy - Market size and forecast 2024-2029 ($ million)
- Exhibits126: Data Table on Italy - Market size and forecast 2024-2029 ($ million)
- Exhibits127: Chart on Italy - Year-over-year growth 2024-2029 (%)
- Exhibits128: Data Table on Italy - Year-over-year growth 2024-2029 (%)
- Exhibits129: Chart on Japan - Market size and forecast 2024-2029 ($ million)
- Exhibits130: Data Table on Japan - Market size and forecast 2024-2029 ($ million)
- Exhibits131: Chart on Japan - Year-over-year growth 2024-2029 (%)
- Exhibits132: Data Table on Japan - Year-over-year growth 2024-2029 (%)
- Exhibits133: Chart on The Netherlands - Market size and forecast 2024-2029 ($ million)
- Exhibits134: Data Table on The Netherlands - Market size and forecast 2024-2029 ($ million)
- Exhibits135: Chart on The Netherlands - Year-over-year growth 2024-2029 (%)
- Exhibits136: Data Table on The Netherlands - Year-over-year growth 2024-2029 (%)
- Exhibits137: Chart on Spain - Market size and forecast 2024-2029 ($ million)
- Exhibits138: Data Table on Spain - Market size and forecast 2024-2029 ($ million)
- Exhibits139: Chart on Spain - Year-over-year growth 2024-2029 (%)
- Exhibits140: Data Table on Spain - Year-over-year growth 2024-2029 (%)
- Exhibits141: Market opportunity By Geographical Landscape ($ million)
- Exhibits142: Data Tables on Market opportunity By Geographical Landscape ($ million)
- Exhibits143: Impact of drivers and challenges in 2024 and 2029
- Exhibits144: Overview on criticality of inputs and factors of differentiation
- Exhibits145: Overview on factors of disruption
- Exhibits146: Impact of key risks on business
- Exhibits147: Companies covered
- Exhibits148: Company ranking index
- Exhibits149: Matrix on companies position and classification
- Exhibits150: Avaya LLC - Overview
- Exhibits151: Avaya LLC - Product / Service
- Exhibits152: Avaya LLC - Key news
- Exhibits153: Avaya LLC - Key offerings
- Exhibits154: SWOT
- Exhibits155: Cisco Systems Inc. - Overview
- Exhibits156: Cisco Systems Inc. - Business segments
- Exhibits157: Cisco Systems Inc. - Key news
- Exhibits158: Cisco Systems Inc. - Key offerings
- Exhibits159: Cisco Systems Inc. - Segment focus
- Exhibits160: SWOT
- Exhibits161: Dell Technologies Inc. - Overview
- Exhibits162: Dell Technologies Inc. - Business segments
- Exhibits163: Dell Technologies Inc. - Key news
- Exhibits164: Dell Technologies Inc. - Key offerings
- Exhibits165: Dell Technologies Inc. - Segment focus
- Exhibits166: SWOT
- Exhibits167: Dignia Systems Ltd. - Overview
- Exhibits168: Dignia Systems Ltd. - Product / Service
- Exhibits169: Dignia Systems Ltd. - Key offerings
- Exhibits170: SWOT
- Exhibits171: DS worldwide Ltd. - Overview
- Exhibits172: DS worldwide Ltd. - Product / Service
- Exhibits173: DS worldwide Ltd. - Key offerings
- Exhibits174: SWOT
- Exhibits175: GP Smart Stadium - Overview
- Exhibits176: GP Smart Stadium - Product / Service
- Exhibits177: GP Smart Stadium - Key offerings
- Exhibits178: SWOT
- Exhibits179: Hawk Eye Innovations Ltd. - Overview
- Exhibits180: Hawk Eye Innovations Ltd. - Product / Service
- Exhibits181: Hawk Eye Innovations Ltd. - Key offerings
- Exhibits182: SWOT
- Exhibits183: Hewlett Packard Enterprise Co. - Overview
- Exhibits184: Hewlett Packard Enterprise Co. - Business segments
- Exhibits185: Hewlett Packard Enterprise Co. - Key news
- Exhibits186: Hewlett Packard Enterprise Co. - Key offerings
- Exhibits187: Hewlett Packard Enterprise Co. - Segment focus
- Exhibits188: SWOT
- Exhibits189: Huawei Technologies Co. Ltd. - Overview
- Exhibits190: Huawei Technologies Co. Ltd. - Product / Service
- Exhibits191: Huawei Technologies Co. Ltd. - Key news
- Exhibits192: Huawei Technologies Co. Ltd. - Key offerings
- Exhibits193: SWOT
- Exhibits194: Infosys Ltd. - Overview
- Exhibits195: Infosys Ltd. - Business segments
- Exhibits196: Infosys Ltd. - Key news
- Exhibits197: Infosys Ltd. - Key offerings
- Exhibits198: Infosys Ltd. - Segment focus
- Exhibits199: SWOT
- Exhibits200: Intel Corp. - Overview
- Exhibits201: Intel Corp. - Business segments
- Exhibits202: Intel Corp. - Key news
- Exhibits203: Intel Corp. - Key offerings
- Exhibits204: Intel Corp. - Segment focus
- Exhibits205: SWOT
- Exhibits206: International Business Machines Corp. - Overview
- Exhibits207: International Business Machines Corp. - Business segments
- Exhibits208: International Business Machines Corp. - Key news
- Exhibits209: International Business Machines Corp. - Key offerings
- Exhibits210: International Business Machines Corp. - Segment focus
- Exhibits211: SWOT
- Exhibits212: Johnson Controls International Plc - Overview
- Exhibits213: Johnson Controls International Plc - Business segments
- Exhibits214: Johnson Controls International Plc - Key news
- Exhibits215: Johnson Controls International Plc - Key offerings
- Exhibits216: Johnson Controls International Plc - Segment focus
- Exhibits217: SWOT
- Exhibits218: Lumen Technologies Inc. - Overview
- Exhibits219: Lumen Technologies Inc. - Business segments
- Exhibits220: Lumen Technologies Inc. - Key news
- Exhibits221: Lumen Technologies Inc. - Key offerings
- Exhibits222: Lumen Technologies Inc. - Segment focus
- Exhibits223: SWOT
- Exhibits224: NEC Corp. - Overview
- Exhibits225: NEC Corp. - Business segments
- Exhibits226: NEC Corp. - Key news
- Exhibits227: NEC Corp. - Key offerings
- Exhibits228: NEC Corp. - Segment focus
- Exhibits229: SWOT
- Exhibits230: Inclusions checklist
- Exhibits231: Exclusions checklist
- Exhibits232: Currency conversion rates for US$
- Exhibits233: Research methodology
- Exhibits234: Information sources
- Exhibits235: Data validation
- Exhibits236: Validation techniques employed for market sizing
- Exhibits237: Data synthesis
- Exhibits238: 360 degree market analysis
- Exhibits239: List of abbreviations
Smart Stadium Market 2025-2029
The smart stadium market is forecasted to grow by USD 67999.2 mn during 2024-2029, accelerating at a CAGR of 30.9% during the forecast period. The report on the smart stadium market provides a holistic analysis, market size and forecast, trends, growth drivers, and challenges, as well as vendor analysis covering around 25 vendors.
The report offers an up-to-date analysis regarding the current market scenario, the latest trends and drivers, and the overall market environment. The market is driven by improved operational efficiency, improved spectator experience, and increasing number of sporting events.
| Market Scope | |
|---|---|
| Base Year | 2025 |
| End Year | 2029 |
| Series Year | 2025-2029 |
| Growth Momentum | Accelerate |
| YOY 2025 | 29.4% |
| CAGR | 30.9% |
| Incremental Value | $67999.2 mn |
Technavio's smart stadium market is segmented as below:
By Software
- Digital content management
- Building automation
- Stadium and public security
- Event management
- Others
By Deployment
- On-premises
- Cloud-based
By Geographical Landscape
- Europe
- North America
- APAC
- South America
- Middle East and Africa
This study identifies the emergence of augmented reality (AR) in stadiums as one of the prime reasons driving the smart stadium market growth during the next few years. Also, adoption of big data analytics and growing adoption of artificial intelligence (AI) will lead to sizable demand in the market.
The report on the smart stadium market covers the following areas:
- Smart Stadium Market sizing
- Smart Stadium Market forecast
- Smart Stadium Market industry analysis
The robust vendor analysis is designed to help clients improve their market position, and in line with this, this report provides a detailed analysis of several leading smart stadium market vendors that include Avaya LLC, Cisco Systems Inc., DB Schenker, Dell Technologies Inc., Dignia Systems Ltd., DS worldwide Ltd., GP Smart Stadium, Hawk Eye Innovations Ltd., Hewlett Packard Enterprise Co., Honeywell International Inc., Huawei Technologies Co. Ltd., Infosys Ltd., Intel Corp., International Business Machines Corp., Johnson Controls International Plc, Lumen Technologies Inc., NEC Corp., Nippon Telegraph and Telephone Corp., Telefonaktiebolaget LM Ericsson, and Weblib. Also, the smart stadium market analysis report includes information on upcoming trends and challenges that will influence market growth. This is to help companies strategize and leverage all forthcoming growth opportunities.
The study was conducted using an objective combination of primary and secondary information including inputs from key participants in the industry. The report contains a comprehensive market and vendor landscape in addition to an analysis of the key vendors.
The publisher presents a detailed picture of the market by the way of study, synthesis, and summation of data from multiple sources by an analysis of key parameters such as profit, pricing, competition, and promotions. It presents various market facets by identifying the key industry influencers. The data presented is comprehensive, reliable, and a result of extensive primary and secondary research. The market research reports provide a complete competitive landscape and an in-depth vendor selection methodology and analysis using qualitative and quantitative research to forecast accurate market growth.
Table of Contents
1 Executive Summary
- 1.1 Market overview
- Executive Summary - Chart on Market Overview
- Executive Summary - Data Table on Market Overview
- Executive Summary - Chart on Global Market Characteristics
- Executive Summary - Chart on Market By Geographical Landscape
- Executive Summary - Chart on Market Segmentation by Software
- Executive Summary - Chart on Market Segmentation by Deployment
- Executive Summary - Chart on Incremental Growth
- Executive Summary - Data Table on Incremental Growth
- Executive Summary - Chart on Company Market Positioning
2 Technavio Analysis
- 2.1 Analysis of price sensitivity, lifecycle, customer purchase basket, adoption rates, and purchase criteria
- Analysis of price sensitivity, lifecycle, customer purchase basket, adoption rates, and purchase criteria
- 2.2 Criticality of inputs and Factors of differentiation
- Overview on criticality of inputs and factors of differentiation
- 2.3 Factors of disruption
- Overview on factors of disruption
- 2.4 Impact of drivers and challenges
- Impact of drivers and challenges in 2024 and 2029
3 Market Landscape
- 3.1 Market ecosystem
- Parent Market
- Data Table on - Parent Market
- 3.2 Market characteristics
- Market characteristics analysis
- 3.3 Value chain analysis
- Value chain analysis
4 Market Sizing
- 4.1 Market definition
- Offerings of companies included in the market definition
- 4.2 Market segment analysis
- Market segments
- 4.3 Market size 2024
- 4.4 Market outlook: Forecast for 2024-2029
- Chart on Global - Market size and forecast 2024-2029 ($ million)
- Data Table on Global - Market size and forecast 2024-2029 ($ million)
- Chart on Global Market: Year-over-year growth 2024-2029 (%)
- Data Table on Global Market: Year-over-year growth 2024-2029 (%)
5 Historic Market Size
- 5.1 Global Smart Stadium Market 2019 - 2023
- Historic Market Size - Data Table on Global Smart Stadium Market 2019 - 2023 ($ million)
- 5.2 Software segment analysis 2019 - 2023
- Historic Market Size - Software Segment 2019 - 2023 ($ million)
- 5.3 Deployment segment analysis 2019 - 2023
- Historic Market Size - Deployment Segment 2019 - 2023 ($ million)
- 5.4 Geography segment analysis 2019 - 2023
- Historic Market Size - Geography Segment 2019 - 2023 ($ million)
- 5.5 Country segment analysis 2019 - 2023
- Historic Market Size - Country Segment 2019 - 2023 ($ million)
6 Qualitative Analysis
- 6.1 Impact of AI On The Global Smart Stadium Market
7 Five Forces Analysis
- 7.1 Five forces summary
- Five forces analysis - Comparison between 2024 and 2029
- 7.2 Bargaining power of buyers
- Bargaining power of buyers - Impact of key factors 2024 and 2029
- 7.3 Bargaining power of suppliers
- Bargaining power of suppliers - Impact of key factors in 2024 and 2029
- 7.4 Threat of new entrants
- Threat of new entrants - Impact of key factors in 2024 and 2029
- 7.5 Threat of substitutes
- Threat of substitutes - Impact of key factors in 2024 and 2029
- 7.6 Threat of rivalry
- Threat of rivalry - Impact of key factors in 2024 and 2029
- 7.7 Market condition
- Chart on Market condition - Five forces 2024 and 2029
8 Market Segmentation by Software
- 8.1 Market segments
- Chart on Software - Market share 2024-2029 (%)
- Data Table on Software - Market share 2024-2029 (%)
- 8.2 Comparison by Software
- Chart on Comparison by Software
- Data Table on Comparison by Software
- 8.3 Digital content management - Market size and forecast 2024-2029
- Chart on Digital content management - Market size and forecast 2024-2029 ($ million)
- Data Table on Digital content management - Market size and forecast 2024-2029 ($ million)
- Chart on Digital content management - Year-over-year growth 2024-2029 (%)
- Data Table on Digital content management - Year-over-year growth 2024-2029 (%)
- 8.4 Building automation - Market size and forecast 2024-2029
- Chart on Building automation - Market size and forecast 2024-2029 ($ million)
- Data Table on Building automation - Market size and forecast 2024-2029 ($ million)
- Chart on Building automation - Year-over-year growth 2024-2029 (%)
- Data Table on Building automation - Year-over-year growth 2024-2029 (%)
- 8.5 Stadium and public security - Market size and forecast 2024-2029
- Chart on Stadium and public security - Market size and forecast 2024-2029 ($ million)
- Data Table on Stadium and public security - Market size and forecast 2024-2029 ($ million)
- Chart on Stadium and public security - Year-over-year growth 2024-2029 (%)
- Data Table on Stadium and public security - Year-over-year growth 2024-2029 (%)
- 8.6 Event management - Market size and forecast 2024-2029
- Chart on Event management - Market size and forecast 2024-2029 ($ million)
- Data Table on Event management - Market size and forecast 2024-2029 ($ million)
- Chart on Event management - Year-over-year growth 2024-2029 (%)
- Data Table on Event management - Year-over-year growth 2024-2029 (%)
- 8.7 Others - Market size and forecast 2024-2029
- Chart on Others - Market size and forecast 2024-2029 ($ million)
- Data Table on Others - Market size and forecast 2024-2029 ($ million)
- Chart on Others - Year-over-year growth 2024-2029 (%)
- Data Table on Others - Year-over-year growth 2024-2029 (%)
- 8.8 Market opportunity by Software
- Market opportunity by Software ($ million)
- Data Table on Market opportunity by Software ($ million)
9 Market Segmentation by Deployment
- 9.1 Market segments
- Chart on Deployment - Market share 2024-2029 (%)
- Data Table on Deployment - Market share 2024-2029 (%)
- 9.2 Comparison by Deployment
- Chart on Comparison by Deployment
- Data Table on Comparison by Deployment
- 9.3 On-premises - Market size and forecast 2024-2029
- Chart on On-premises - Market size and forecast 2024-2029 ($ million)
- Data Table on On-premises - Market size and forecast 2024-2029 ($ million)
- Chart on On-premises - Year-over-year growth 2024-2029 (%)
- Data Table on On-premises - Year-over-year growth 2024-2029 (%)
- 9.4 Cloud-based - Market size and forecast 2024-2029
- Chart on Cloud-based - Market size and forecast 2024-2029 ($ million)
- Data Table on Cloud-based - Market size and forecast 2024-2029 ($ million)
- Chart on Cloud-based - Year-over-year growth 2024-2029 (%)
- Data Table on Cloud-based - Year-over-year growth 2024-2029 (%)
- 9.5 Market opportunity by Deployment
- Market opportunity by Deployment ($ million)
- Data Table on Market opportunity by Deployment ($ million)
10 Customer Landscape
- 10.1 Customer landscape overview
- Analysis of price sensitivity, lifecycle, customer purchase basket, adoption rates, and purchase criteria
11 Geographic Landscape
- 11.1 Geographic segmentation
- Chart on Market share By Geographical Landscape 2024-2029 (%)
- Data Table on Market share By Geographical Landscape 2024-2029 (%)
- 11.2 Geographic comparison
- Chart on Geographic comparison
- Data Table on Geographic comparison
- 11.3 Europe - Market size and forecast 2024-2029
- Chart on Europe - Market size and forecast 2024-2029 ($ million)
- Data Table on Europe - Market size and forecast 2024-2029 ($ million)
- Chart on Europe - Year-over-year growth 2024-2029 (%)
- Data Table on Europe - Year-over-year growth 2024-2029 (%)
- 11.4 North America - Market size and forecast 2024-2029
- Chart on North America - Market size and forecast 2024-2029 ($ million)
- Data Table on North America - Market size and forecast 2024-2029 ($ million)
- Chart on North America - Year-over-year growth 2024-2029 (%)
- Data Table on North America - Year-over-year growth 2024-2029 (%)
- 11.5 APAC - Market size and forecast 2024-2029
- Chart on APAC - Market size and forecast 2024-2029 ($ million)
- Data Table on APAC - Market size and forecast 2024-2029 ($ million)
- Chart on APAC - Year-over-year growth 2024-2029 (%)
- Data Table on APAC - Year-over-year growth 2024-2029 (%)
- 11.6 South America - Market size and forecast 2024-2029
- Chart on South America - Market size and forecast 2024-2029 ($ million)
- Data Table on South America - Market size and forecast 2024-2029 ($ million)
- Chart on South America - Year-over-year growth 2024-2029 (%)
- Data Table on South America - Year-over-year growth 2024-2029 (%)
- 11.7 Middle East and Africa - Market size and forecast 2024-2029
- Chart on Middle East and Africa - Market size and forecast 2024-2029 ($ million)
- Data Table on Middle East and Africa - Market size and forecast 2024-2029 ($ million)
- Chart on Middle East and Africa - Year-over-year growth 2024-2029 (%)
- Data Table on Middle East and Africa - Year-over-year growth 2024-2029 (%)
- 11.8 US - Market size and forecast 2024-2029
- Chart on US - Market size and forecast 2024-2029 ($ million)
- Data Table on US - Market size and forecast 2024-2029 ($ million)
- Chart on US - Year-over-year growth 2024-2029 (%)
- Data Table on US - Year-over-year growth 2024-2029 (%)
- 11.9 UK - Market size and forecast 2024-2029
- Chart on UK - Market size and forecast 2024-2029 ($ million)
- Data Table on UK - Market size and forecast 2024-2029 ($ million)
- Chart on UK - Year-over-year growth 2024-2029 (%)
- Data Table on UK - Year-over-year growth 2024-2029 (%)
- 11.10 Germany - Market size and forecast 2024-2029
- Chart on Germany - Market size and forecast 2024-2029 ($ million)
- Data Table on Germany - Market size and forecast 2024-2029 ($ million)
- Chart on Germany - Year-over-year growth 2024-2029 (%)
- Data Table on Germany - Year-over-year growth 2024-2029 (%)
- 11.11 Canada - Market size and forecast 2024-2029
- Chart on Canada - Market size and forecast 2024-2029 ($ million)
- Data Table on Canada - Market size and forecast 2024-2029 ($ million)
- Chart on Canada - Year-over-year growth 2024-2029 (%)
- Data Table on Canada - Year-over-year growth 2024-2029 (%)
- 11.12 France - Market size and forecast 2024-2029
- Chart on France - Market size and forecast 2024-2029 ($ million)
- Data Table on France - Market size and forecast 2024-2029 ($ million)
- Chart on France - Year-over-year growth 2024-2029 (%)
- Data Table on France - Year-over-year growth 2024-2029 (%)
- 11.13 China - Market size and forecast 2024-2029
- Chart on China - Market size and forecast 2024-2029 ($ million)
- Data Table on China - Market size and forecast 2024-2029 ($ million)
- Chart on China - Year-over-year growth 2024-2029 (%)
- Data Table on China - Year-over-year growth 2024-2029 (%)
- 11.14 Italy - Market size and forecast 2024-2029
- Chart on Italy - Market size and forecast 2024-2029 ($ million)
- Data Table on Italy - Market size and forecast 2024-2029 ($ million)
- Chart on Italy - Year-over-year growth 2024-2029 (%)
- Data Table on Italy - Year-over-year growth 2024-2029 (%)
- 11.15 Japan - Market size and forecast 2024-2029
- Chart on Japan - Market size and forecast 2024-2029 ($ million)
- Data Table on Japan - Market size and forecast 2024-2029 ($ million)
- Chart on Japan - Year-over-year growth 2024-2029 (%)
- Data Table on Japan - Year-over-year growth 2024-2029 (%)
- 11.16 The Netherlands - Market size and forecast 2024-2029
- Chart on The Netherlands - Market size and forecast 2024-2029 ($ million)
- Data Table on The Netherlands - Market size and forecast 2024-2029 ($ million)
- Chart on The Netherlands - Year-over-year growth 2024-2029 (%)
- Data Table on The Netherlands - Year-over-year growth 2024-2029 (%)
- 11.17 Spain - Market size and forecast 2024-2029
- Chart on Spain - Market size and forecast 2024-2029 ($ million)
- Data Table on Spain - Market size and forecast 2024-2029 ($ million)
- Chart on Spain - Year-over-year growth 2024-2029 (%)
- Data Table on Spain - Year-over-year growth 2024-2029 (%)
- 11.18 Market opportunity By Geographical Landscape
- Market opportunity By Geographical Landscape ($ million)
- Data Tables on Market opportunity By Geographical Landscape ($ million)
12 Drivers, Challenges, and Opportunity/Restraints
- 12.1 Market drivers
- 12.2 Market challenges
- 12.3 Impact of drivers and challenges
- Impact of drivers and challenges in 2024 and 2029
- 12.4 Market opportunities/restraints
13 Competitive Landscape
- 13.1 Overview
- 13.2 Competitive Landscape
- Overview on criticality of inputs and factors of differentiation
- 13.3 Landscape disruption
- Overview on factors of disruption
- 13.4 Industry risks
- Impact of key risks on business
14 Competitive Analysis
- 14.1 Companies profiled
- Companies covered
- 14.2 Company ranking index
- Company ranking index
- 14.3 Market positioning of companies
- Matrix on companies position and classification
- 14.4 Avaya LLC
- Avaya LLC - Overview
- Avaya LLC - Product / Service
- Avaya LLC - Key news
- Avaya LLC - Key offerings
- SWOT
- 14.5 Cisco Systems Inc.
- Cisco Systems Inc. - Overview
- Cisco Systems Inc. - Business segments
- Cisco Systems Inc. - Key news
- Cisco Systems Inc. - Key offerings
- Cisco Systems Inc. - Segment focus
- SWOT
- 14.6 Dell Technologies Inc.
- Dell Technologies Inc. - Overview
- Dell Technologies Inc. - Business segments
- Dell Technologies Inc. - Key news
- Dell Technologies Inc. - Key offerings
- Dell Technologies Inc. - Segment focus
- SWOT
- 14.7 Dignia Systems Ltd.
- Dignia Systems Ltd. - Overview
- Dignia Systems Ltd. - Product / Service
- Dignia Systems Ltd. - Key offerings
- SWOT
- 14.8 DS worldwide Ltd.
- DS worldwide Ltd. - Overview
- DS worldwide Ltd. - Product / Service
- DS worldwide Ltd. - Key offerings
- SWOT
- 14.9 GP Smart Stadium
- GP Smart Stadium - Overview
- GP Smart Stadium - Product / Service
- GP Smart Stadium - Key offerings
- SWOT
- 14.10 Hawk Eye Innovations Ltd.
- Hawk Eye Innovations Ltd. - Overview
- Hawk Eye Innovations Ltd. - Product / Service
- Hawk Eye Innovations Ltd. - Key offerings
- SWOT
- 14.11 Hewlett Packard Enterprise Co.
- Hewlett Packard Enterprise Co. - Overview
- Hewlett Packard Enterprise Co. - Business segments
- Hewlett Packard Enterprise Co. - Key news
- Hewlett Packard Enterprise Co. - Key offerings
- Hewlett Packard Enterprise Co. - Segment focus
- SWOT
- 14.12 Huawei Technologies Co. Ltd.
- Huawei Technologies Co. Ltd. - Overview
- Huawei Technologies Co. Ltd. - Product / Service
- Huawei Technologies Co. Ltd. - Key news
- Huawei Technologies Co. Ltd. - Key offerings
- SWOT
- 14.13 Infosys Ltd.
- Infosys Ltd. - Overview
- Infosys Ltd. - Business segments
- Infosys Ltd. - Key news
- Infosys Ltd. - Key offerings
- Infosys Ltd. - Segment focus
- SWOT
- 14.14 Intel Corp.
- Intel Corp. - Overview
- Intel Corp. - Business segments
- Intel Corp. - Key news
- Intel Corp. - Key offerings
- Intel Corp. - Segment focus
- SWOT
- 14.15 International Business Machines Corp.
- International Business Machines Corp. - Overview
- International Business Machines Corp. - Business segments
- International Business Machines Corp. - Key news
- International Business Machines Corp. - Key offerings
- International Business Machines Corp. - Segment focus
- SWOT
- 14.16 Johnson Controls International Plc
- Johnson Controls International Plc - Overview
- Johnson Controls International Plc - Business segments
- Johnson Controls International Plc - Key news
- Johnson Controls International Plc - Key offerings
- Johnson Controls International Plc - Segment focus
- SWOT
- 14.17 Lumen Technologies Inc.
- Lumen Technologies Inc. - Overview
- Lumen Technologies Inc. - Business segments
- Lumen Technologies Inc. - Key news
- Lumen Technologies Inc. - Key offerings
- Lumen Technologies Inc. - Segment focus
- SWOT
- 14.18 NEC Corp.
- NEC Corp. - Overview
- NEC Corp. - Business segments
- NEC Corp. - Key news
- NEC Corp. - Key offerings
- NEC Corp. - Segment focus
- SWOT
15 Appendix
- 15.1 Scope of the report
- 15.2 Inclusions and exclusions checklist
- Inclusions checklist
- Exclusions checklist
- 15.3 Currency conversion rates for US$
- Currency conversion rates for US$
- 15.4 Research methodology
- Research methodology
- 15.5 Data procurement
- Information sources
- 15.6 Data validation
- Data validation
- 15.7 Validation techniques employed for market sizing
- Validation techniques employed for market sizing
- 15.8 Data synthesis
- Data synthesis
- 15.9 360 degree market analysis
- 360 degree market analysis
- 15.10 List of abbreviations
- List of abbreviations

