|
|
市場調査レポート
商品コード
1645493
シャンパンの世界市場、2025-2029年Global Champagne Market 2025-2029 |
||||||

|
|||||||
カスタマイズ可能
|
|||||||

| シャンパンの世界市場、2025-2029年 |
|
出版日: 2025年01月10日
発行: TechNavio
ページ情報: 英文 195 Pages
納期: 即納可能
|

全表示
- 概要
- 図表
- 目次
シャンパン市場は2024-2029年に30億1,820万米ドル、予測期間中のCAGRは6.7%で成長すると予測されます。
当レポートでは、シャンパン市場の全体的な分析、市場規模・予測、動向、成長促進要因、課題、約25のベンダーを網羅したベンダー分析などを掲載しています。
現在の市場シナリオ、最新動向と促進要因、市場環境全体に関する最新分析を提供しています。シャンパン市場は、ミレニアル世代からのシャンパン需要の増加、世界のシャンパン市場における最近の製品発売、お祝い用のシャンパン需要の増加などが牽引しています。
| 市場範囲 | |
|---|---|
| 基準年 | 2025 |
| 終了年 | 2029 |
| 予測期間 | 2025-2029 |
| 成長モメンタム | 加速 |
| 前年比2025年 | 5.9% |
| CAGR | 6.7% |
| 増分額 | 30億1,820万米ドル |
本調査では、eコマース分野の拡大が、今後数年間のシャンパン市場の成長を牽引する主な要因のひとつであるとしています。また、プライベートブランド(PB)の台頭や、オーガニック・ナチュラルシャンパンの売上増加も、市場の大きな需要につながると思われます。
目次
第1章 エグゼクティブサマリー
- 市場概要
第2章 Technavio分析
- 価格・ライフサイクル・顧客購入バスケット・採用率・購入基準の分析
- インプットの重要性と差別化の要因
- 混乱の要因
- 促進要因と課題の影響
第3章 市場情勢
- 市場エコシステム
- 市場の特徴
- バリューチェーン分析
第4章 市場規模
- 市場の定義
- 市場セグメント分析
- 市場規模 2024
- 市場の見通し 2024-2029
第5章 市場規模実績
- シャンパンの世界市場 2019-2023
- 流通チャネルセグメント分析 2019-2023
- 価格帯セグメント分析 2019-2023
- 地域別セグメント分析 2019-2023
- 国別セグメント分析 2019-2023
第6章 定性分析
- AIの影響:シャンパンの世界市場
第7章 ファイブフォース分析
- ファイブフォースの要約
- 買い手の交渉力
- 供給企業の交渉力
- 新規参入業者の脅威
- 代替品の脅威
- 競争の脅威
- 市況
第8章 市場セグメンテーション:流通チャネル別
- 市場セグメント
- 比較:流通チャネル別
- オフライン:市場規模と予測 2024-2029
- オンライン:市場規模と予測 2024-2029
- 市場機会:流通チャネル別
第9章 市場セグメンテーション:価格帯別
- 市場セグメント
- 比較:価格帯別
- エコノミー:市場規模と予測 2024-2029
- ミッドレンジ:市場規模と予測 2024-2029
- ラグジュアリー:市場規模と予測 2024-2029
- 市場機会:価格帯別
第10章 顧客情勢
- 顧客情勢の概要
第11章 地域別情勢
- 地域別セグメンテーション
- 地域別比較
- 欧州:市場規模と予測 2024-2029
- 北米:市場規模と予測 2024-2029
- アジア太平洋:市場規模と予測 2024-2029
- 南米:市場規模と予測 2024-2029
- 中東・アフリカ:市場規模と予測 2024-2029
- 米国:市場規模と予測 2024-2029
- ドイツ:市場規模と予測 2024-2029
- フランス:市場規模と予測 2024-2029
- 中国:市場規模と予測 2024-2029
- イタリア:市場規模と予測 2024-2029
- 日本:市場規模と予測 2024-2029
- カナダ:市場規模と予測 2024-2029
- 英国:市場規模と予測 2024-2029
- インド:市場規模と予測 2024-2029
- ブラジル:市場規模と予測 2024-2029
- 市場機会:地域情勢別
第12章 促進要因・課題・機会・抑制要因
- 市場促進要因
- 市場の課題
- 促進要因と課題の影響
- 市場の機会・抑制要因
第13章 競合情勢
- 概要
- 競合情勢
- 混乱の状況
- 業界のリスク
第14章 競合分析
- 企業プロファイル
- 企業ランキング指数
- 企業の市場ポジショニング
- Champagne GH Martel
- Champagne Laurent Perrier
- Champagne Louis Roederer
- Champagne Nicolas Feuillatte
- Champagne Piper Heidsieck
- Champagne Taittinger CCVC
- Champagne Veuve A.Devaux
- Constellation Brands Inc.
- E. and J. Gallo Winery
- F. Korbel and Bros
- LANSON BCC
- LVMH Moet Hennessy Louis Vuitton SE
- Pernod Ricard SA
- THIENOT SAS Co.
- VRANKEN POMMERY MONOPOLE
第15章 付録
Exhibits:
- Exhibits1: Executive Summary - Chart on Market Overview
- Exhibits2: Executive Summary - Data Table on Market Overview
- Exhibits3: Executive Summary - Chart on Global Market Characteristics
- Exhibits4: Executive Summary - Chart on Market By Geographical Landscape
- Exhibits5: Executive Summary - Chart on Market Segmentation by Distribution Channel
- Exhibits6: Executive Summary - Chart on Market Segmentation by Price Range
- Exhibits7: Executive Summary - Chart on Incremental Growth
- Exhibits8: Executive Summary - Data Table on Incremental Growth
- Exhibits9: Executive Summary - Chart on Company Market Positioning
- Exhibits10: Analysis of price sensitivity, lifecycle, customer purchase basket, adoption rates, and purchase criteria
- Exhibits11: Overview on criticality of inputs and factors of differentiation
- Exhibits12: Overview on factors of disruption
- Exhibits13: Impact of drivers and challenges in 2024 and 2029
- Exhibits14: Parent Market
- Exhibits15: Data Table on - Parent Market
- Exhibits16: Market characteristics analysis
- Exhibits17: Value chain analysis
- Exhibits18: Offerings of companies included in the market definition
- Exhibits19: Market segments
- Exhibits20: Chart on Global - Market size and forecast 2024-2029 ($ million)
- Exhibits21: Data Table on Global - Market size and forecast 2024-2029 ($ million)
- Exhibits22: Chart on Global Market: Year-over-year growth 2024-2029 (%)
- Exhibits23: Data Table on Global Market: Year-over-year growth 2024-2029 (%)
- Exhibits24: Historic Market Size - Data Table on Global Champagne Market 2019 - 2023 ($ million)
- Exhibits25: Historic Market Size - Distribution Channel Segment 2019 - 2023 ($ million)
- Exhibits26: Historic Market Size - Price Range Segment 2019 - 2023 ($ million)
- Exhibits27: Historic Market Size - Geography Segment 2019 - 2023 ($ million)
- Exhibits28: Historic Market Size - Country Segment 2019 - 2023 ($ million)
- Exhibits29: Five forces analysis - Comparison between 2024 and 2029
- Exhibits30: Bargaining power of buyers - Impact of key factors 2024 and 2029
- Exhibits31: Bargaining power of suppliers - Impact of key factors in 2024 and 2029
- Exhibits32: Threat of new entrants - Impact of key factors in 2024 and 2029
- Exhibits33: Threat of substitutes - Impact of key factors in 2024 and 2029
- Exhibits34: Threat of rivalry - Impact of key factors in 2024 and 2029
- Exhibits35: Chart on Market condition - Five forces 2024 and 2029
- Exhibits36: Chart on Distribution Channel - Market share 2024-2029 (%)
- Exhibits37: Data Table on Distribution Channel - Market share 2024-2029 (%)
- Exhibits38: Chart on Comparison by Distribution Channel
- Exhibits39: Data Table on Comparison by Distribution Channel
- Exhibits40: Chart on Offline - Market size and forecast 2024-2029 ($ million)
- Exhibits41: Data Table on Offline - Market size and forecast 2024-2029 ($ million)
- Exhibits42: Chart on Offline - Year-over-year growth 2024-2029 (%)
- Exhibits43: Data Table on Offline - Year-over-year growth 2024-2029 (%)
- Exhibits44: Chart on Online - Market size and forecast 2024-2029 ($ million)
- Exhibits45: Data Table on Online - Market size and forecast 2024-2029 ($ million)
- Exhibits46: Chart on Online - Year-over-year growth 2024-2029 (%)
- Exhibits47: Data Table on Online - Year-over-year growth 2024-2029 (%)
- Exhibits48: Market opportunity by Distribution Channel ($ million)
- Exhibits49: Data Table on Market opportunity by Distribution Channel ($ million)
- Exhibits50: Chart on Price Range - Market share 2024-2029 (%)
- Exhibits51: Data Table on Price Range - Market share 2024-2029 (%)
- Exhibits52: Chart on Comparison by Price Range
- Exhibits53: Data Table on Comparison by Price Range
- Exhibits54: Chart on Economy - Market size and forecast 2024-2029 ($ million)
- Exhibits55: Data Table on Economy - Market size and forecast 2024-2029 ($ million)
- Exhibits56: Chart on Economy - Year-over-year growth 2024-2029 (%)
- Exhibits57: Data Table on Economy - Year-over-year growth 2024-2029 (%)
- Exhibits58: Chart on Mid-range - Market size and forecast 2024-2029 ($ million)
- Exhibits59: Data Table on Mid-range - Market size and forecast 2024-2029 ($ million)
- Exhibits60: Chart on Mid-range - Year-over-year growth 2024-2029 (%)
- Exhibits61: Data Table on Mid-range - Year-over-year growth 2024-2029 (%)
- Exhibits62: Chart on Luxury - Market size and forecast 2024-2029 ($ million)
- Exhibits63: Data Table on Luxury - Market size and forecast 2024-2029 ($ million)
- Exhibits64: Chart on Luxury - Year-over-year growth 2024-2029 (%)
- Exhibits65: Data Table on Luxury - Year-over-year growth 2024-2029 (%)
- Exhibits66: Market opportunity by Price Range ($ million)
- Exhibits67: Data Table on Market opportunity by Price Range ($ million)
- Exhibits68: Analysis of price sensitivity, lifecycle, customer purchase basket, adoption rates, and purchase criteria
- Exhibits69: Chart on Market share By Geographical Landscape 2024-2029 (%)
- Exhibits70: Data Table on Market share By Geographical Landscape 2024-2029 (%)
- Exhibits71: Chart on Geographic comparison
- Exhibits72: Data Table on Geographic comparison
- Exhibits73: Chart on Europe - Market size and forecast 2024-2029 ($ million)
- Exhibits74: Data Table on Europe - Market size and forecast 2024-2029 ($ million)
- Exhibits75: Chart on Europe - Year-over-year growth 2024-2029 (%)
- Exhibits76: Data Table on Europe - Year-over-year growth 2024-2029 (%)
- Exhibits77: Chart on North America - Market size and forecast 2024-2029 ($ million)
- Exhibits78: Data Table on North America - Market size and forecast 2024-2029 ($ million)
- Exhibits79: Chart on North America - Year-over-year growth 2024-2029 (%)
- Exhibits80: Data Table on North America - Year-over-year growth 2024-2029 (%)
- Exhibits81: Chart on APAC - Market size and forecast 2024-2029 ($ million)
- Exhibits82: Data Table on APAC - Market size and forecast 2024-2029 ($ million)
- Exhibits83: Chart on APAC - Year-over-year growth 2024-2029 (%)
- Exhibits84: Data Table on APAC - Year-over-year growth 2024-2029 (%)
- Exhibits85: Chart on South America - Market size and forecast 2024-2029 ($ million)
- Exhibits86: Data Table on South America - Market size and forecast 2024-2029 ($ million)
- Exhibits87: Chart on South America - Year-over-year growth 2024-2029 (%)
- Exhibits88: Data Table on South America - Year-over-year growth 2024-2029 (%)
- Exhibits89: Chart on Middle East and Africa - Market size and forecast 2024-2029 ($ million)
- Exhibits90: Data Table on Middle East and Africa - Market size and forecast 2024-2029 ($ million)
- Exhibits91: Chart on Middle East and Africa - Year-over-year growth 2024-2029 (%)
- Exhibits92: Data Table on Middle East and Africa - Year-over-year growth 2024-2029 (%)
- Exhibits93: Chart on US - Market size and forecast 2024-2029 ($ million)
- Exhibits94: Data Table on US - Market size and forecast 2024-2029 ($ million)
- Exhibits95: Chart on US - Year-over-year growth 2024-2029 (%)
- Exhibits96: Data Table on US - Year-over-year growth 2024-2029 (%)
- Exhibits97: Chart on Germany - Market size and forecast 2024-2029 ($ million)
- Exhibits98: Data Table on Germany - Market size and forecast 2024-2029 ($ million)
- Exhibits99: Chart on Germany - Year-over-year growth 2024-2029 (%)
- Exhibits100: Data Table on Germany - Year-over-year growth 2024-2029 (%)
- Exhibits101: Chart on France - Market size and forecast 2024-2029 ($ million)
- Exhibits102: Data Table on France - Market size and forecast 2024-2029 ($ million)
- Exhibits103: Chart on France - Year-over-year growth 2024-2029 (%)
- Exhibits104: Data Table on France - Year-over-year growth 2024-2029 (%)
- Exhibits105: Chart on China - Market size and forecast 2024-2029 ($ million)
- Exhibits106: Data Table on China - Market size and forecast 2024-2029 ($ million)
- Exhibits107: Chart on China - Year-over-year growth 2024-2029 (%)
- Exhibits108: Data Table on China - Year-over-year growth 2024-2029 (%)
- Exhibits109: Chart on Italy - Market size and forecast 2024-2029 ($ million)
- Exhibits110: Data Table on Italy - Market size and forecast 2024-2029 ($ million)
- Exhibits111: Chart on Italy - Year-over-year growth 2024-2029 (%)
- Exhibits112: Data Table on Italy - Year-over-year growth 2024-2029 (%)
- Exhibits113: Chart on Japan - Market size and forecast 2024-2029 ($ million)
- Exhibits114: Data Table on Japan - Market size and forecast 2024-2029 ($ million)
- Exhibits115: Chart on Japan - Year-over-year growth 2024-2029 (%)
- Exhibits116: Data Table on Japan - Year-over-year growth 2024-2029 (%)
- Exhibits117: Chart on Canada - Market size and forecast 2024-2029 ($ million)
- Exhibits118: Data Table on Canada - Market size and forecast 2024-2029 ($ million)
- Exhibits119: Chart on Canada - Year-over-year growth 2024-2029 (%)
- Exhibits120: Data Table on Canada - Year-over-year growth 2024-2029 (%)
- Exhibits121: Chart on UK - Market size and forecast 2024-2029 ($ million)
- Exhibits122: Data Table on UK - Market size and forecast 2024-2029 ($ million)
- Exhibits123: Chart on UK - Year-over-year growth 2024-2029 (%)
- Exhibits124: Data Table on UK - Year-over-year growth 2024-2029 (%)
- Exhibits125: Chart on India - Market size and forecast 2024-2029 ($ million)
- Exhibits126: Data Table on India - Market size and forecast 2024-2029 ($ million)
- Exhibits127: Chart on India - Year-over-year growth 2024-2029 (%)
- Exhibits128: Data Table on India - Year-over-year growth 2024-2029 (%)
- Exhibits129: Chart on Brazil - Market size and forecast 2024-2029 ($ million)
- Exhibits130: Data Table on Brazil - Market size and forecast 2024-2029 ($ million)
- Exhibits131: Chart on Brazil - Year-over-year growth 2024-2029 (%)
- Exhibits132: Data Table on Brazil - Year-over-year growth 2024-2029 (%)
- Exhibits133: Market opportunity By Geographical Landscape ($ million)
- Exhibits134: Data Tables on Market opportunity By Geographical Landscape ($ million)
- Exhibits135: Impact of drivers and challenges in 2024 and 2029
- Exhibits136: Overview on criticality of inputs and factors of differentiation
- Exhibits137: Overview on factors of disruption
- Exhibits138: Impact of key risks on business
- Exhibits139: Companies covered
- Exhibits140: Company ranking index
- Exhibits141: Matrix on companies position and classification
- Exhibits142: Champagne GH Martel - Overview
- Exhibits143: Champagne GH Martel - Product / Service
- Exhibits144: Champagne GH Martel - Key offerings
- Exhibits145: SWOT
- Exhibits146: Champagne Laurent Perrier - Overview
- Exhibits147: Champagne Laurent Perrier - Product / Service
- Exhibits148: Champagne Laurent Perrier - Key offerings
- Exhibits149: SWOT
- Exhibits150: Champagne Louis Roederer - Overview
- Exhibits151: Champagne Louis Roederer - Product / Service
- Exhibits152: Champagne Louis Roederer - Key offerings
- Exhibits153: SWOT
- Exhibits154: Champagne Nicolas Feuillatte - Overview
- Exhibits155: Champagne Nicolas Feuillatte - Product / Service
- Exhibits156: Champagne Nicolas Feuillatte - Key offerings
- Exhibits157: SWOT
- Exhibits158: Champagne Piper Heidsieck - Overview
- Exhibits159: Champagne Piper Heidsieck - Product / Service
- Exhibits160: Champagne Piper Heidsieck - Key offerings
- Exhibits161: SWOT
- Exhibits162: Champagne Taittinger CCVC - Overview
- Exhibits163: Champagne Taittinger CCVC - Product / Service
- Exhibits164: Champagne Taittinger CCVC - Key offerings
- Exhibits165: SWOT
- Exhibits166: Champagne Veuve A.Devaux - Overview
- Exhibits167: Champagne Veuve A.Devaux - Product / Service
- Exhibits168: Champagne Veuve A.Devaux - Key offerings
- Exhibits169: SWOT
- Exhibits170: Constellation Brands Inc. - Overview
- Exhibits171: Constellation Brands Inc. - Business segments
- Exhibits172: Constellation Brands Inc. - Key offerings
- Exhibits173: Constellation Brands Inc. - Segment focus
- Exhibits174: SWOT
- Exhibits175: E. and J. Gallo Winery - Overview
- Exhibits176: E. and J. Gallo Winery - Product / Service
- Exhibits177: E. and J. Gallo Winery - Key offerings
- Exhibits178: SWOT
- Exhibits179: F. Korbel and Bros - Overview
- Exhibits180: F. Korbel and Bros - Product / Service
- Exhibits181: F. Korbel and Bros - Key offerings
- Exhibits182: SWOT
- Exhibits183: LANSON BCC - Overview
- Exhibits184: LANSON BCC - Product / Service
- Exhibits185: LANSON BCC - Key offerings
- Exhibits186: SWOT
- Exhibits187: LVMH Moet Hennessy Louis Vuitton SE - Overview
- Exhibits188: LVMH Moet Hennessy Louis Vuitton SE - Business segments
- Exhibits189: LVMH Moet Hennessy Louis Vuitton SE - Key news
- Exhibits190: LVMH Moet Hennessy Louis Vuitton SE - Key offerings
- Exhibits191: LVMH Moet Hennessy Louis Vuitton SE - Segment focus
- Exhibits192: SWOT
- Exhibits193: Pernod Ricard SA - Overview
- Exhibits194: Pernod Ricard SA - Product / Service
- Exhibits195: Pernod Ricard SA - Key news
- Exhibits196: Pernod Ricard SA - Key offerings
- Exhibits197: SWOT
- Exhibits198: THIENOT SAS Co. - Overview
- Exhibits199: THIENOT SAS Co. - Product / Service
- Exhibits200: THIENOT SAS Co. - Key offerings
- Exhibits201: SWOT
- Exhibits202: VRANKEN POMMERY MONOPOLE - Overview
- Exhibits203: VRANKEN POMMERY MONOPOLE - Product / Service
- Exhibits204: VRANKEN POMMERY MONOPOLE - Key offerings
- Exhibits205: SWOT
- Exhibits206: Inclusions checklist
- Exhibits207: Exclusions checklist
- Exhibits208: Currency conversion rates for US$
- Exhibits209: Research methodology
- Exhibits210: Information sources
- Exhibits211: Data validation
- Exhibits212: Validation techniques employed for market sizing
- Exhibits213: Data synthesis
- Exhibits214: 360 degree market analysis
- Exhibits215: List of abbreviations
The champagne market is forecasted to grow by USD 3018.2 mn during 2024-2029, accelerating at a CAGR of 6.7% during the forecast period. The report on the champagne market provides a holistic analysis, market size and forecast, trends, growth drivers, and challenges, as well as vendor analysis covering around 25 vendors.
The report offers an up-to-date analysis regarding the current market scenario, the latest trends and drivers, and the overall market environment. The market is driven by growing demand for champagne from millennials, recent product launches in global champagne market, and increasing demand for champagne for celebrations.
| Market Scope | |
|---|---|
| Base Year | 2025 |
| End Year | 2029 |
| Series Year | 2025-2029 |
| Growth Momentum | Accelerate |
| YOY 2025 | 5.9% |
| CAGR | 6.7% |
| Incremental Value | $3018.2 mn |
Technavio's champagne market is segmented as below:
By Distribution Channel
- Offline
- Online
By Price Range
- Economy
- Mid-range
- Luxury
By Geographical Landscape
- Europe
- North America
- APAC
- South America
- Middle East and Africa
This study identifies the expansion of the e-commerce sector as one of the prime reasons driving the champagne market growth during the next few years. Also, increasing prominence of private-label brands and rise in sales of organic and natural champagnes will lead to sizable demand in the market.
The report on the champagne market covers the following areas:
- Champagne Market sizing
- Champagne Market forecast
- Champagne Market industry analysis
The robust vendor analysis is designed to help clients improve their market position, and in line with this, this report provides a detailed analysis of several leading champagne market vendors that include Champagne GH Martel, Champagne Laurent Perrier, Champagne Louis Roederer, Champagne Nicolas Feuillatte, Champagne Piper Heidsieck, Champagne Taittinger CCVC, Champagne Veuve A.Devaux, CLS REMY COINTREAU, Constellation Brands Inc., De Castellane, E. and J. Gallo Winery, F. Korbel and Bros, Joseph Perrier, Krug Champagne, LANSON BCC, LVMH Moet Hennessy Louis Vuitton SE, Pernod Ricard SA, THIENOT SAS Co., Veuve Clicquot Ponsardin, and VRANKEN POMMERY MONOPOLE. Also, the champagne market analysis report includes information on upcoming trends and challenges that will influence market growth. This is to help companies strategize and leverage all forthcoming growth opportunities.
The study was conducted using an objective combination of primary and secondary information including inputs from key participants in the industry. The report contains a comprehensive market and vendor landscape in addition to an analysis of the key vendors.
The publisher presents a detailed picture of the market by the way of study, synthesis, and summation of data from multiple sources by an analysis of key parameters such as profit, pricing, competition, and promotions. It presents various market facets by identifying the key industry influencers. The data presented is comprehensive, reliable, and a result of extensive primary and secondary research. The market research reports provide a complete competitive landscape and an in-depth vendor selection methodology and analysis using qualitative and quantitative research to forecast accurate market growth.
Table of Contents
1 Executive Summary
- 1.1 Market overview
- Executive Summary - Chart on Market Overview
- Executive Summary - Data Table on Market Overview
- Executive Summary - Chart on Global Market Characteristics
- Executive Summary - Chart on Market By Geographical Landscape
- Executive Summary - Chart on Market Segmentation by Distribution Channel
- Executive Summary - Chart on Market Segmentation by Price Range
- Executive Summary - Chart on Incremental Growth
- Executive Summary - Data Table on Incremental Growth
- Executive Summary - Chart on Company Market Positioning
2 Technavio Analysis
- 2.1 Analysis of price sensitivity, lifecycle, customer purchase basket, adoption rates, and purchase criteria
- Analysis of price sensitivity, lifecycle, customer purchase basket, adoption rates, and purchase criteria
- 2.2 Criticality of inputs and Factors of differentiation
- Overview on criticality of inputs and factors of differentiation
- 2.3 Factors of disruption
- Overview on factors of disruption
- 2.4 Impact of drivers and challenges
- Impact of drivers and challenges in 2024 and 2029
3 Market Landscape
- 3.1 Market ecosystem
- Parent Market
- Data Table on - Parent Market
- 3.2 Market characteristics
- Market characteristics analysis
- 3.3 Value chain analysis
- Value chain analysis
4 Market Sizing
- 4.1 Market definition
- Offerings of companies included in the market definition
- 4.2 Market segment analysis
- Market segments
- 4.3 Market size 2024
- 4.4 Market outlook: Forecast for 2024-2029
- Chart on Global - Market size and forecast 2024-2029 ($ million)
- Data Table on Global - Market size and forecast 2024-2029 ($ million)
- Chart on Global Market: Year-over-year growth 2024-2029 (%)
- Data Table on Global Market: Year-over-year growth 2024-2029 (%)
5 Historic Market Size
- 5.1 Global Champagne Market 2019 - 2023
- Historic Market Size - Data Table on Global Champagne Market 2019 - 2023 ($ million)
- 5.2 Distribution Channel segment analysis 2019 - 2023
- Historic Market Size - Distribution Channel Segment 2019 - 2023 ($ million)
- 5.3 Price Range segment analysis 2019 - 2023
- Historic Market Size - Price Range Segment 2019 - 2023 ($ million)
- 5.4 Geography segment analysis 2019 - 2023
- Historic Market Size - Geography Segment 2019 - 2023 ($ million)
- 5.5 Country segment analysis 2019 - 2023
- Historic Market Size - Country Segment 2019 - 2023 ($ million)
6 Qualitative Analysis
- 6.1 Impact of AI on The Global Champagne Market
7 Five Forces Analysis
- 7.1 Five forces summary
- Five forces analysis - Comparison between 2024 and 2029
- 7.2 Bargaining power of buyers
- Bargaining power of buyers - Impact of key factors 2024 and 2029
- 7.3 Bargaining power of suppliers
- Bargaining power of suppliers - Impact of key factors in 2024 and 2029
- 7.4 Threat of new entrants
- Threat of new entrants - Impact of key factors in 2024 and 2029
- 7.5 Threat of substitutes
- Threat of substitutes - Impact of key factors in 2024 and 2029
- 7.6 Threat of rivalry
- Threat of rivalry - Impact of key factors in 2024 and 2029
- 7.7 Market condition
- Chart on Market condition - Five forces 2024 and 2029
8 Market Segmentation by Distribution Channel
- 8.1 Market segments
- Chart on Distribution Channel - Market share 2024-2029 (%)
- Data Table on Distribution Channel - Market share 2024-2029 (%)
- 8.2 Comparison by Distribution Channel
- Chart on Comparison by Distribution Channel
- Data Table on Comparison by Distribution Channel
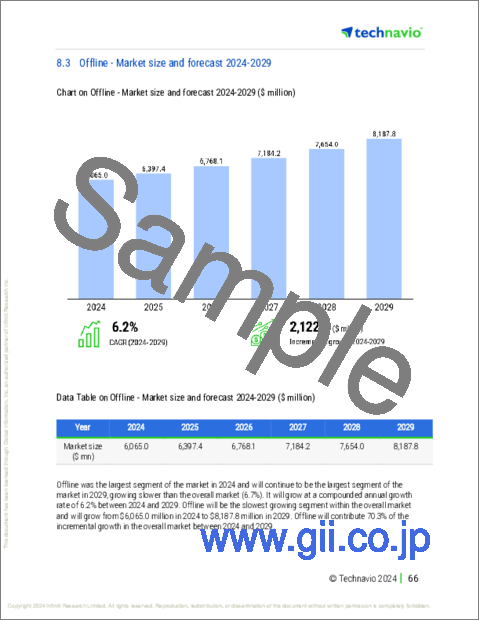
- 8.3 Offline - Market size and forecast 2024-2029
- Chart on Offline - Market size and forecast 2024-2029 ($ million)
- Data Table on Offline - Market size and forecast 2024-2029 ($ million)
- Chart on Offline - Year-over-year growth 2024-2029 (%)
- Data Table on Offline - Year-over-year growth 2024-2029 (%)
- 8.4 Online - Market size and forecast 2024-2029
- Chart on Online - Market size and forecast 2024-2029 ($ million)
- Data Table on Online - Market size and forecast 2024-2029 ($ million)
- Chart on Online - Year-over-year growth 2024-2029 (%)
- Data Table on Online - Year-over-year growth 2024-2029 (%)
- 8.5 Market opportunity by Distribution Channel
- Market opportunity by Distribution Channel ($ million)
- Data Table on Market opportunity by Distribution Channel ($ million)
9 Market Segmentation by Price Range
- 9.1 Market segments
- Chart on Price Range - Market share 2024-2029 (%)
- Data Table on Price Range - Market share 2024-2029 (%)
- 9.2 Comparison by Price Range
- Chart on Comparison by Price Range
- Data Table on Comparison by Price Range
- 9.3 Economy - Market size and forecast 2024-2029
- Chart on Economy - Market size and forecast 2024-2029 ($ million)
- Data Table on Economy - Market size and forecast 2024-2029 ($ million)
- Chart on Economy - Year-over-year growth 2024-2029 (%)
- Data Table on Economy - Year-over-year growth 2024-2029 (%)
- 9.4 Mid-range - Market size and forecast 2024-2029
- Chart on Mid-range - Market size and forecast 2024-2029 ($ million)
- Data Table on Mid-range - Market size and forecast 2024-2029 ($ million)
- Chart on Mid-range - Year-over-year growth 2024-2029 (%)
- Data Table on Mid-range - Year-over-year growth 2024-2029 (%)
- 9.5 Luxury - Market size and forecast 2024-2029
- Chart on Luxury - Market size and forecast 2024-2029 ($ million)
- Data Table on Luxury - Market size and forecast 2024-2029 ($ million)
- Chart on Luxury - Year-over-year growth 2024-2029 (%)
- Data Table on Luxury - Year-over-year growth 2024-2029 (%)
- 9.6 Market opportunity by Price Range
- Market opportunity by Price Range ($ million)
- Data Table on Market opportunity by Price Range ($ million)
10 Customer Landscape
- 10.1 Customer landscape overview
- Analysis of price sensitivity, lifecycle, customer purchase basket, adoption rates, and purchase criteria
11 Geographic Landscape
- 11.1 Geographic segmentation
- Chart on Market share By Geographical Landscape 2024-2029 (%)
- Data Table on Market share By Geographical Landscape 2024-2029 (%)
- 11.2 Geographic comparison
- Chart on Geographic comparison
- Data Table on Geographic comparison
- 11.3 Europe - Market size and forecast 2024-2029
- Chart on Europe - Market size and forecast 2024-2029 ($ million)
- Data Table on Europe - Market size and forecast 2024-2029 ($ million)
- Chart on Europe - Year-over-year growth 2024-2029 (%)
- Data Table on Europe - Year-over-year growth 2024-2029 (%)
- 11.4 North America - Market size and forecast 2024-2029
- Chart on North America - Market size and forecast 2024-2029 ($ million)
- Data Table on North America - Market size and forecast 2024-2029 ($ million)
- Chart on North America - Year-over-year growth 2024-2029 (%)
- Data Table on North America - Year-over-year growth 2024-2029 (%)
- 11.5 APAC - Market size and forecast 2024-2029
- Chart on APAC - Market size and forecast 2024-2029 ($ million)
- Data Table on APAC - Market size and forecast 2024-2029 ($ million)
- Chart on APAC - Year-over-year growth 2024-2029 (%)
- Data Table on APAC - Year-over-year growth 2024-2029 (%)
- 11.6 South America - Market size and forecast 2024-2029
- Chart on South America - Market size and forecast 2024-2029 ($ million)
- Data Table on South America - Market size and forecast 2024-2029 ($ million)
- Chart on South America - Year-over-year growth 2024-2029 (%)
- Data Table on South America - Year-over-year growth 2024-2029 (%)
- 11.7 Middle East and Africa - Market size and forecast 2024-2029
- Chart on Middle East and Africa - Market size and forecast 2024-2029 ($ million)
- Data Table on Middle East and Africa - Market size and forecast 2024-2029 ($ million)
- Chart on Middle East and Africa - Year-over-year growth 2024-2029 (%)
- Data Table on Middle East and Africa - Year-over-year growth 2024-2029 (%)
- 11.8 US - Market size and forecast 2024-2029
- Chart on US - Market size and forecast 2024-2029 ($ million)
- Data Table on US - Market size and forecast 2024-2029 ($ million)
- Chart on US - Year-over-year growth 2024-2029 (%)
- Data Table on US - Year-over-year growth 2024-2029 (%)
- 11.9 Germany - Market size and forecast 2024-2029
- Chart on Germany - Market size and forecast 2024-2029 ($ million)
- Data Table on Germany - Market size and forecast 2024-2029 ($ million)
- Chart on Germany - Year-over-year growth 2024-2029 (%)
- Data Table on Germany - Year-over-year growth 2024-2029 (%)
- 11.10 France - Market size and forecast 2024-2029
- Chart on France - Market size and forecast 2024-2029 ($ million)
- Data Table on France - Market size and forecast 2024-2029 ($ million)
- Chart on France - Year-over-year growth 2024-2029 (%)
- Data Table on France - Year-over-year growth 2024-2029 (%)
- 11.11 China - Market size and forecast 2024-2029
- Chart on China - Market size and forecast 2024-2029 ($ million)
- Data Table on China - Market size and forecast 2024-2029 ($ million)
- Chart on China - Year-over-year growth 2024-2029 (%)
- Data Table on China - Year-over-year growth 2024-2029 (%)
- 11.12 Italy - Market size and forecast 2024-2029
- Chart on Italy - Market size and forecast 2024-2029 ($ million)
- Data Table on Italy - Market size and forecast 2024-2029 ($ million)
- Chart on Italy - Year-over-year growth 2024-2029 (%)
- Data Table on Italy - Year-over-year growth 2024-2029 (%)
- 11.13 Japan - Market size and forecast 2024-2029
- Chart on Japan - Market size and forecast 2024-2029 ($ million)
- Data Table on Japan - Market size and forecast 2024-2029 ($ million)
- Chart on Japan - Year-over-year growth 2024-2029 (%)
- Data Table on Japan - Year-over-year growth 2024-2029 (%)
- 11.14 Canada - Market size and forecast 2024-2029
- Chart on Canada - Market size and forecast 2024-2029 ($ million)
- Data Table on Canada - Market size and forecast 2024-2029 ($ million)
- Chart on Canada - Year-over-year growth 2024-2029 (%)
- Data Table on Canada - Year-over-year growth 2024-2029 (%)
- 11.15 UK - Market size and forecast 2024-2029
- Chart on UK - Market size and forecast 2024-2029 ($ million)
- Data Table on UK - Market size and forecast 2024-2029 ($ million)
- Chart on UK - Year-over-year growth 2024-2029 (%)
- Data Table on UK - Year-over-year growth 2024-2029 (%)
- 11.16 India - Market size and forecast 2024-2029
- Chart on India - Market size and forecast 2024-2029 ($ million)
- Data Table on India - Market size and forecast 2024-2029 ($ million)
- Chart on India - Year-over-year growth 2024-2029 (%)
- Data Table on India - Year-over-year growth 2024-2029 (%)
- 11.17 Brazil - Market size and forecast 2024-2029
- Chart on Brazil - Market size and forecast 2024-2029 ($ million)
- Data Table on Brazil - Market size and forecast 2024-2029 ($ million)
- Chart on Brazil - Year-over-year growth 2024-2029 (%)
- Data Table on Brazil - Year-over-year growth 2024-2029 (%)
- 11.18 Market opportunity By Geographical Landscape
- Market opportunity By Geographical Landscape ($ million)
- Data Tables on Market opportunity By Geographical Landscape ($ million)
12 Drivers, Challenges, and Opportunity/Restraints
- 12.1 Market drivers
- 12.2 Market challenges
- 12.3 Impact of drivers and challenges
- Impact of drivers and challenges in 2024 and 2029
- 12.4 Market opportunities/restraints
13 Competitive Landscape
- 13.1 Overview
- 13.2 Competitive Landscape
- Overview on criticality of inputs and factors of differentiation
- 13.3 Landscape disruption
- Overview on factors of disruption
- 13.4 Industry risks
- Impact of key risks on business
14 Competitive Analysis
- 14.1 Companies profiled
- Companies covered
- 14.2 Company ranking index
- Company ranking index
- 14.3 Market positioning of companies
- Matrix on companies position and classification
- 14.4 Champagne GH Martel
- Champagne GH Martel - Overview
- Champagne GH Martel - Product / Service
- Champagne GH Martel - Key offerings
- SWOT
- 14.5 Champagne Laurent Perrier
- Champagne Laurent Perrier - Overview
- Champagne Laurent Perrier - Product / Service
- Champagne Laurent Perrier - Key offerings
- SWOT
- 14.6 Champagne Louis Roederer
- Champagne Louis Roederer - Overview
- Champagne Louis Roederer - Product / Service
- Champagne Louis Roederer - Key offerings
- SWOT
- 14.7 Champagne Nicolas Feuillatte
- Champagne Nicolas Feuillatte - Overview
- Champagne Nicolas Feuillatte - Product / Service
- Champagne Nicolas Feuillatte - Key offerings
- SWOT
- 14.8 Champagne Piper Heidsieck
- Champagne Piper Heidsieck - Overview
- Champagne Piper Heidsieck - Product / Service
- Champagne Piper Heidsieck - Key offerings
- SWOT
- 14.9 Champagne Taittinger CCVC
- Champagne Taittinger CCVC - Overview
- Champagne Taittinger CCVC - Product / Service
- Champagne Taittinger CCVC - Key offerings
- SWOT
- 14.10 Champagne Veuve A.Devaux
- Champagne Veuve A.Devaux - Overview
- Champagne Veuve A.Devaux - Product / Service
- Champagne Veuve A.Devaux - Key offerings
- SWOT
- 14.11 Constellation Brands Inc.
- Constellation Brands Inc. - Overview
- Constellation Brands Inc. - Business segments
- Constellation Brands Inc. - Key offerings
- Constellation Brands Inc. - Segment focus
- SWOT
- 14.12 E. and J. Gallo Winery
- E. and J. Gallo Winery - Overview
- E. and J. Gallo Winery - Product / Service
- E. and J. Gallo Winery - Key offerings
- SWOT
- 14.13 F. Korbel and Bros
- F. Korbel and Bros - Overview
- F. Korbel and Bros - Product / Service
- F. Korbel and Bros - Key offerings
- SWOT
- 14.14 LANSON BCC
- LANSON BCC - Overview
- LANSON BCC - Product / Service
- LANSON BCC - Key offerings
- SWOT
- 14.15 LVMH Moet Hennessy Louis Vuitton SE
- LVMH Moet Hennessy Louis Vuitton SE - Overview
- LVMH Moet Hennessy Louis Vuitton SE - Business segments
- LVMH Moet Hennessy Louis Vuitton SE - Key news
- LVMH Moet Hennessy Louis Vuitton SE - Key offerings
- LVMH Moet Hennessy Louis Vuitton SE - Segment focus
- SWOT
- 14.16 Pernod Ricard SA
- Pernod Ricard SA - Overview
- Pernod Ricard SA - Product / Service
- Pernod Ricard SA - Key news
- Pernod Ricard SA - Key offerings
- SWOT
- 14.17 THIENOT SAS Co.
- THIENOT SAS Co. - Overview
- THIENOT SAS Co. - Product / Service
- THIENOT SAS Co. - Key offerings
- SWOT
- 14.18 VRANKEN POMMERY MONOPOLE
- VRANKEN POMMERY MONOPOLE - Overview
- VRANKEN POMMERY MONOPOLE - Product / Service
- VRANKEN POMMERY MONOPOLE - Key offerings
- SWOT
15 Appendix
- 15.1 Scope of the report
- 15.2 Inclusions and exclusions checklist
- Inclusions checklist
- Exclusions checklist
- 15.3 Currency conversion rates for US$
- Currency conversion rates for US$
- 15.4 Research methodology
- Research methodology
- 15.5 Data procurement
- Information sources
- 15.6 Data validation
- Data validation
- 15.7 Validation techniques employed for market sizing
- Validation techniques employed for market sizing
- 15.8 Data synthesis
- Data synthesis
- 15.9 360 degree market analysis
- 360 degree market analysis
- 15.10 List of abbreviations
- List of abbreviations

