|
|
市場調査レポート
商品コード
1685032
クロスラミネートティンバーの世界市場 2025-2029Global Cross Laminated Timber Market 2025-2029 |
||||||

|
|||||||
カスタマイズ可能
|
|||||||


| クロスラミネートティンバーの世界市場 2025-2029 |
|
出版日: 2025年03月07日
発行: TechNavio
ページ情報: 英文 196 Pages
納期: 即納可能
|

全表示
- 概要
- 図表
- 目次
クロスラミネートティンバー市場は2024年から2029年に40億10万米ドル成長し、予測期間中のCAGRは20.5%で成長すると予測されます。
当レポートでは、クロスラミネートティンバー市場の全体的な分析、市場規模・予測、動向、成長促進要因、課題、約25のベンダーを網羅したベンダー分析などを掲載しています。
現在の市場シナリオ、最新動向と促進要因、市場環境全体に関する最新分析を提供しています。不動産・建設業界の成長、持続可能な建材への需要の高まり、耐久性の高いフローリングへの需要の高まりが市場を牽引しています。
| 市場範囲 | |
|---|---|
| 基準年 | 2025年 |
| 終了年 | 2029年 |
| 予測期間 | 2025年~2029年 |
| 成長モメンタム | 加速 |
| 前年比2025年 | 16.6% |
| CAGR | 20.5% |
| 増分額 | 40億10万米ドル |
本調査は、業界の主要参加者からのインプットを含め、一次情報と二次情報を客観的に組み合わせて実施しました。本レポートには、主要企業の分析に加え、包括的な市場規模データ、地域分析によるセグメント、ベンダー情勢が含まれています。レポートには実績データと予測データがあります。
本調査では、今後数年間のクロスラミネートティンバー市場の成長を促進する主な要因の一つとして、林業経営への注力を挙げています。また、天然林から人工林への木材供給の着実なシフトや、オフィススペースの増加が市場の大きな需要につながるとしています。
目次
第1章 エグゼクティブサマリー
- 市場概要
第2章 Technavio分析
- 価格感応性・ライフサイクル・顧客購入バスケット・採用率・購入基準の分析
- インプットの重要性と差別化の要因
- 混乱の要因
- 促進要因と課題の影響
第3章 市場情勢
- 市場エコシステム
- 市場の特徴
- バリューチェーン分析
第4章 市場規模
- 市場の定義
- 市場セグメント分析
- 市場規模、2024年
- 市場の見通し、2024年~2029年
第5章 市場規模実績
- クロスラミネートティンバーの世界市場、2019年~2023年
- エンドユーザーセグメント分析、2019年~2023年
- 用途セグメント分析、2019年~2023年
- タイプセグメント分析、2019年~2023年
- 地域別セグメント分析、2019年~2023年
- 国別セグメント分析、2019年~2023年
第6章 定性分析
- AIの影響:クロスラミネートティンバーの世界市場
第7章 ファイブフォース分析
- ファイブフォースの要約
- 買い手の交渉力
- 供給企業の交渉力
- 新規参入業者の脅威
- 代替品の脅威
- 競争の脅威
- 市況
第8章 市場セグメンテーション:エンドユーザー別
- 市場セグメント
- 比較:エンドユーザー別
- 非住宅:市場規模と予測、2024年~2029年
- 住宅用:市場規模と予測、2024年~2029年
- 市場機会:エンドユーザー別
第9章 市場セグメンテーション:用途別
- 市場セグメント
- 比較:用途別
- 構造的:市場規模と予測、2024年~2029年
- 非構造的:市場規模と予測、2024年~2029年
- 市場機会:用途別
第10章 市場セグメンテーション:タイプ別
- 市場セグメント
- 比較:タイプ別
- 接着接合:市場規模と予測、2024年~2029年
- 機械的に固定:市場規模と予測、2024年~2029年
- 市場機会:タイプ別
第11章 顧客情勢
- 顧客情勢の概要
第12章 地域別情勢
- 地域別セグメンテーション
- 地域別比較
- 欧州:市場規模と予測、2024年~2029年
- 北米:市場規模と予測、2024年~2029年
- アジア太平洋:市場規模と予測、2024年~2029年
- 南米:市場規模と予測、2024年~2029年
- 中東・アフリカ:市場規模と予測、2024年~2029年
- 米国:市場規模と予測、2024年~2029年
- ドイツ:市場規模と予測、2024年~2029年
- 中国:市場規模と予測、2024年~2029年
- 英国:市場規模と予測、2024年~2029年
- フランス:市場規模と予測、2024年~2029年
- イタリア:市場規模と予測、2024年~2029年
- カナダ:市場規模と予測、2024年~2029年
- オランダ:市場規模と予測、2024年~2029年
- 日本:市場規模と予測、2024年~2029年
- インド:市場規模と予測、2024年~2029年
- 市場機会:地域情勢別
第13章 促進要因、課題、機会/抑制要因
- 市場促進要因
- 市場の課題
- 促進要因と課題の影響
- 市場の機会/抑制要因
第14章 競合情勢
- 概要
- 競合情勢
- 混乱の状況
- 業界のリスク
第15章 競合分析
- 企業プロファイル
- 企業ランキング指数
- 企業の市場ポジショニング
- B and K Structures
- Binderholz GmbH
- Eugen Decker Holzindustrie KG
- HASSLACHER Holding GmbH
- HESS TIMBER GmbH
- KLH Massivholz GmbH
- Mayr Melnhof Holz Holding AG
- Mercer International Inc.
- Nordic Structures
- Pfeifer Holding GmbH
- Schilliger Holz AG
- SmartLam
- Sterling Lumber
- Stora Enso Oyj
- XLam Ltd.
第16章 付録
Exhibits:
- Exhibits1: Executive Summary - Chart on Market Overview
- Exhibits2: Executive Summary - Data Table on Market Overview
- Exhibits3: Executive Summary - Chart on Global Market Characteristics
- Exhibits4: Executive Summary - Chart on Market By Geographical Landscape
- Exhibits5: Executive Summary - Chart on Market Segmentation by End-user
- Exhibits6: Executive Summary - Chart on Market Segmentation by Application
- Exhibits7: Executive Summary - Chart on Market Segmentation by Type
- Exhibits8: Executive Summary - Chart on Incremental Growth
- Exhibits9: Executive Summary - Data Table on Incremental Growth
- Exhibits10: Executive Summary - Chart on Company Market Positioning
- Exhibits11: Analysis of price sensitivity, lifecycle, customer purchase basket, adoption rates, and purchase criteria
- Exhibits12: Overview on criticality of inputs and factors of differentiation
- Exhibits13: Overview on factors of disruption
- Exhibits14: Impact of drivers and challenges in 2024 and 2029
- Exhibits15: Parent Market
- Exhibits16: Data Table on - Parent Market
- Exhibits17: Market characteristics analysis
- Exhibits18: Value chain analysis
- Exhibits19: Offerings of companies included in the market definition
- Exhibits20: Market segments
- Exhibits21: Chart on Global - Market size and forecast 2024-2029 ($ million)
- Exhibits22: Data Table on Global - Market size and forecast 2024-2029 ($ million)
- Exhibits23: Chart on Global Market: Year-over-year growth 2024-2029 (%)
- Exhibits24: Data Table on Global Market: Year-over-year growth 2024-2029 (%)
- Exhibits25: Historic Market Size - Data Table on Global Cross Laminated Timber Market 2019 - 2023 ($ million)
- Exhibits26: Historic Market Size - End-user Segment 2019 - 2023 ($ million)
- Exhibits27: Historic Market Size - Application Segment 2019 - 2023 ($ million)
- Exhibits28: Historic Market Size - Type Segment 2019 - 2023 ($ million)
- Exhibits29: Historic Market Size - Geography Segment 2019 - 2023 ($ million)
- Exhibits30: Historic Market Size - Country Segment 2019 - 2023 ($ million)
- Exhibits31: Five forces analysis - Comparison between 2024 and 2029
- Exhibits32: Bargaining power of buyers - Impact of key factors 2024 and 2029
- Exhibits33: Bargaining power of suppliers - Impact of key factors in 2024 and 2029
- Exhibits34: Threat of new entrants - Impact of key factors in 2024 and 2029
- Exhibits35: Threat of substitutes - Impact of key factors in 2024 and 2029
- Exhibits36: Threat of rivalry - Impact of key factors in 2024 and 2029
- Exhibits37: Chart on Market condition - Five forces 2024 and 2029
- Exhibits38: Chart on End-user - Market share 2024-2029 (%)
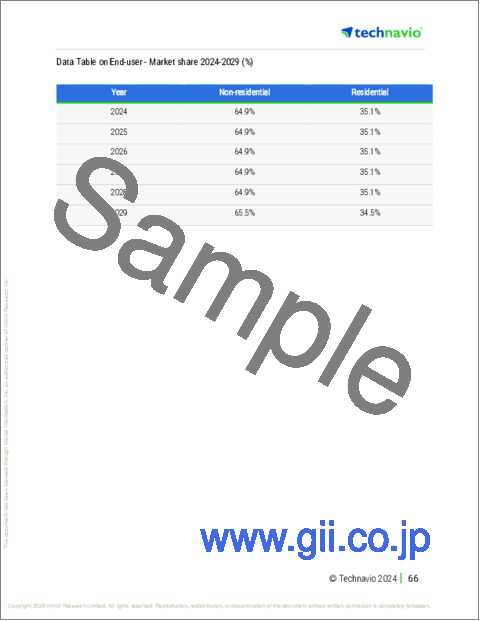
- Exhibits39: Data Table on End-user - Market share 2024-2029 (%)
- Exhibits40: Chart on Comparison by End-user
- Exhibits41: Data Table on Comparison by End-user
- Exhibits42: Chart on Non-residential - Market size and forecast 2024-2029 ($ million)
- Exhibits43: Data Table on Non-residential - Market size and forecast 2024-2029 ($ million)
- Exhibits44: Chart on Non-residential - Year-over-year growth 2024-2029 (%)
- Exhibits45: Data Table on Non-residential - Year-over-year growth 2024-2029 (%)
- Exhibits46: Chart on Residential - Market size and forecast 2024-2029 ($ million)
- Exhibits47: Data Table on Residential - Market size and forecast 2024-2029 ($ million)
- Exhibits48: Chart on Residential - Year-over-year growth 2024-2029 (%)
- Exhibits49: Data Table on Residential - Year-over-year growth 2024-2029 (%)
- Exhibits50: Market opportunity by End-user ($ million)
- Exhibits51: Data Table on Market opportunity by End-user ($ million)
- Exhibits52: Chart on Application - Market share 2024-2029 (%)
- Exhibits53: Data Table on Application - Market share 2024-2029 (%)
- Exhibits54: Chart on Comparison by Application
- Exhibits55: Data Table on Comparison by Application
- Exhibits56: Chart on Structural - Market size and forecast 2024-2029 ($ million)
- Exhibits57: Data Table on Structural - Market size and forecast 2024-2029 ($ million)
- Exhibits58: Chart on Structural - Year-over-year growth 2024-2029 (%)
- Exhibits59: Data Table on Structural - Year-over-year growth 2024-2029 (%)
- Exhibits60: Chart on Non-structural - Market size and forecast 2024-2029 ($ million)
- Exhibits61: Data Table on Non-structural - Market size and forecast 2024-2029 ($ million)
- Exhibits62: Chart on Non-structural - Year-over-year growth 2024-2029 (%)
- Exhibits63: Data Table on Non-structural - Year-over-year growth 2024-2029 (%)
- Exhibits64: Market opportunity by Application ($ million)
- Exhibits65: Data Table on Market opportunity by Application ($ million)
- Exhibits66: Chart on Type - Market share 2024-2029 (%)
- Exhibits67: Data Table on Type - Market share 2024-2029 (%)
- Exhibits68: Chart on Comparison by Type
- Exhibits69: Data Table on Comparison by Type
- Exhibits70: Chart on Adhesive bonded - Market size and forecast 2024-2029 ($ million)
- Exhibits71: Data Table on Adhesive bonded - Market size and forecast 2024-2029 ($ million)
- Exhibits72: Chart on Adhesive bonded - Year-over-year growth 2024-2029 (%)
- Exhibits73: Data Table on Adhesive bonded - Year-over-year growth 2024-2029 (%)
- Exhibits74: Chart on Mechanically fastened - Market size and forecast 2024-2029 ($ million)
- Exhibits75: Data Table on Mechanically fastened - Market size and forecast 2024-2029 ($ million)
- Exhibits76: Chart on Mechanically fastened - Year-over-year growth 2024-2029 (%)
- Exhibits77: Data Table on Mechanically fastened - Year-over-year growth 2024-2029 (%)
- Exhibits78: Market opportunity by Type ($ million)
- Exhibits79: Data Table on Market opportunity by Type ($ million)
- Exhibits80: Analysis of price sensitivity, lifecycle, customer purchase basket, adoption rates, and purchase criteria
- Exhibits81: Chart on Market share By Geographical Landscape 2024-2029 (%)
- Exhibits82: Data Table on Market share By Geographical Landscape 2024-2029 (%)
- Exhibits83: Chart on Geographic comparison
- Exhibits84: Data Table on Geographic comparison
- Exhibits85: Chart on Europe - Market size and forecast 2024-2029 ($ million)
- Exhibits86: Data Table on Europe - Market size and forecast 2024-2029 ($ million)
- Exhibits87: Chart on Europe - Year-over-year growth 2024-2029 (%)
- Exhibits88: Data Table on Europe - Year-over-year growth 2024-2029 (%)
- Exhibits89: Chart on North America - Market size and forecast 2024-2029 ($ million)
- Exhibits90: Data Table on North America - Market size and forecast 2024-2029 ($ million)
- Exhibits91: Chart on North America - Year-over-year growth 2024-2029 (%)
- Exhibits92: Data Table on North America - Year-over-year growth 2024-2029 (%)
- Exhibits93: Chart on APAC - Market size and forecast 2024-2029 ($ million)
- Exhibits94: Data Table on APAC - Market size and forecast 2024-2029 ($ million)
- Exhibits95: Chart on APAC - Year-over-year growth 2024-2029 (%)
- Exhibits96: Data Table on APAC - Year-over-year growth 2024-2029 (%)
- Exhibits97: Chart on South America - Market size and forecast 2024-2029 ($ million)
- Exhibits98: Data Table on South America - Market size and forecast 2024-2029 ($ million)
- Exhibits99: Chart on South America - Year-over-year growth 2024-2029 (%)
- Exhibits100: Data Table on South America - Year-over-year growth 2024-2029 (%)
- Exhibits101: Chart on Middle East and Africa - Market size and forecast 2024-2029 ($ million)
- Exhibits102: Data Table on Middle East and Africa - Market size and forecast 2024-2029 ($ million)
- Exhibits103: Chart on Middle East and Africa - Year-over-year growth 2024-2029 (%)
- Exhibits104: Data Table on Middle East and Africa - Year-over-year growth 2024-2029 (%)
- Exhibits105: Chart on US - Market size and forecast 2024-2029 ($ million)
- Exhibits106: Data Table on US - Market size and forecast 2024-2029 ($ million)
- Exhibits107: Chart on US - Year-over-year growth 2024-2029 (%)
- Exhibits108: Data Table on US - Year-over-year growth 2024-2029 (%)
- Exhibits109: Chart on Germany - Market size and forecast 2024-2029 ($ million)
- Exhibits110: Data Table on Germany - Market size and forecast 2024-2029 ($ million)
- Exhibits111: Chart on Germany - Year-over-year growth 2024-2029 (%)
- Exhibits112: Data Table on Germany - Year-over-year growth 2024-2029 (%)
- Exhibits113: Chart on China - Market size and forecast 2024-2029 ($ million)
- Exhibits114: Data Table on China - Market size and forecast 2024-2029 ($ million)
- Exhibits115: Chart on China - Year-over-year growth 2024-2029 (%)
- Exhibits116: Data Table on China - Year-over-year growth 2024-2029 (%)
- Exhibits117: Chart on UK - Market size and forecast 2024-2029 ($ million)
- Exhibits118: Data Table on UK - Market size and forecast 2024-2029 ($ million)
- Exhibits119: Chart on UK - Year-over-year growth 2024-2029 (%)
- Exhibits120: Data Table on UK - Year-over-year growth 2024-2029 (%)
- Exhibits121: Chart on France - Market size and forecast 2024-2029 ($ million)
- Exhibits122: Data Table on France - Market size and forecast 2024-2029 ($ million)
- Exhibits123: Chart on France - Year-over-year growth 2024-2029 (%)
- Exhibits124: Data Table on France - Year-over-year growth 2024-2029 (%)
- Exhibits125: Chart on Italy - Market size and forecast 2024-2029 ($ million)
- Exhibits126: Data Table on Italy - Market size and forecast 2024-2029 ($ million)
- Exhibits127: Chart on Italy - Year-over-year growth 2024-2029 (%)
- Exhibits128: Data Table on Italy - Year-over-year growth 2024-2029 (%)
- Exhibits129: Chart on Canada - Market size and forecast 2024-2029 ($ million)
- Exhibits130: Data Table on Canada - Market size and forecast 2024-2029 ($ million)
- Exhibits131: Chart on Canada - Year-over-year growth 2024-2029 (%)
- Exhibits132: Data Table on Canada - Year-over-year growth 2024-2029 (%)
- Exhibits133: Chart on The Netherlands - Market size and forecast 2024-2029 ($ million)
- Exhibits134: Data Table on The Netherlands - Market size and forecast 2024-2029 ($ million)
- Exhibits135: Chart on The Netherlands - Year-over-year growth 2024-2029 (%)
- Exhibits136: Data Table on The Netherlands - Year-over-year growth 2024-2029 (%)
- Exhibits137: Chart on Japan - Market size and forecast 2024-2029 ($ million)
- Exhibits138: Data Table on Japan - Market size and forecast 2024-2029 ($ million)
- Exhibits139: Chart on Japan - Year-over-year growth 2024-2029 (%)
- Exhibits140: Data Table on Japan - Year-over-year growth 2024-2029 (%)
- Exhibits141: Chart on India - Market size and forecast 2024-2029 ($ million)
- Exhibits142: Data Table on India - Market size and forecast 2024-2029 ($ million)
- Exhibits143: Chart on India - Year-over-year growth 2024-2029 (%)
- Exhibits144: Data Table on India - Year-over-year growth 2024-2029 (%)
- Exhibits145: Market opportunity By Geographical Landscape ($ million)
- Exhibits146: Data Tables on Market opportunity By Geographical Landscape ($ million)
- Exhibits147: Impact of drivers and challenges in 2024 and 2029
- Exhibits148: Overview on criticality of inputs and factors of differentiation
- Exhibits149: Overview on factors of disruption
- Exhibits150: Impact of key risks on business
- Exhibits151: Companies covered
- Exhibits152: Company ranking index
- Exhibits153: Matrix on companies position and classification
- Exhibits154: B and K Structures - Overview
- Exhibits155: B and K Structures - Product / Service
- Exhibits156: B and K Structures - Key offerings
- Exhibits157: SWOT
- Exhibits158: Binderholz GmbH - Overview
- Exhibits159: Binderholz GmbH - Product / Service
- Exhibits160: Binderholz GmbH - Key offerings
- Exhibits161: SWOT
- Exhibits162: Eugen Decker Holzindustrie KG - Overview
- Exhibits163: Eugen Decker Holzindustrie KG - Product / Service
- Exhibits164: Eugen Decker Holzindustrie KG - Key offerings
- Exhibits165: SWOT
- Exhibits166: HASSLACHER Holding GmbH - Overview
- Exhibits167: HASSLACHER Holding GmbH - Product / Service
- Exhibits168: HASSLACHER Holding GmbH - Key offerings
- Exhibits169: SWOT
- Exhibits170: HESS TIMBER GmbH - Overview
- Exhibits171: HESS TIMBER GmbH - Product / Service
- Exhibits172: HESS TIMBER GmbH - Key offerings
- Exhibits173: SWOT
- Exhibits174: KLH Massivholz GmbH - Overview
- Exhibits175: KLH Massivholz GmbH - Product / Service
- Exhibits176: KLH Massivholz GmbH - Key offerings
- Exhibits177: SWOT
- Exhibits178: Mayr Melnhof Holz Holding AG - Overview
- Exhibits179: Mayr Melnhof Holz Holding AG - Product / Service
- Exhibits180: Mayr Melnhof Holz Holding AG - Key offerings
- Exhibits181: SWOT
- Exhibits182: Mercer International Inc. - Overview
- Exhibits183: Mercer International Inc. - Business segments
- Exhibits184: Mercer International Inc. - Key offerings
- Exhibits185: Mercer International Inc. - Segment focus
- Exhibits186: SWOT
- Exhibits187: Nordic Structures - Overview
- Exhibits188: Nordic Structures - Product / Service
- Exhibits189: Nordic Structures - Key offerings
- Exhibits190: SWOT
- Exhibits191: Pfeifer Holding GmbH - Overview
- Exhibits192: Pfeifer Holding GmbH - Product / Service
- Exhibits193: Pfeifer Holding GmbH - Key offerings
- Exhibits194: SWOT
- Exhibits195: Schilliger Holz AG - Overview
- Exhibits196: Schilliger Holz AG - Product / Service
- Exhibits197: Schilliger Holz AG - Key offerings
- Exhibits198: SWOT
- Exhibits199: SmartLam - Overview
- Exhibits200: SmartLam - Product / Service
- Exhibits201: SmartLam - Key offerings
- Exhibits202: SWOT
- Exhibits203: Sterling Lumber - Overview
- Exhibits204: Sterling Lumber - Product / Service
- Exhibits205: Sterling Lumber - Key offerings
- Exhibits206: SWOT
- Exhibits207: Stora Enso Oyj - Overview
- Exhibits208: Stora Enso Oyj - Business segments
- Exhibits209: Stora Enso Oyj - Key offerings
- Exhibits210: Stora Enso Oyj - Segment focus
- Exhibits211: SWOT
- Exhibits212: XLam Ltd. - Overview
- Exhibits213: XLam Ltd. - Product / Service
- Exhibits214: XLam Ltd. - Key offerings
- Exhibits215: SWOT
- Exhibits216: Inclusions checklist
- Exhibits217: Exclusions checklist
- Exhibits218: Currency conversion rates for US$
- Exhibits219: Research methodology
- Exhibits220: Information sources
- Exhibits221: Data validation
- Exhibits222: Validation techniques employed for market sizing
- Exhibits223: Data synthesis
- Exhibits224: 360 degree market analysis
- Exhibits225: List of abbreviations
The cross laminated timber market is forecasted to grow by USD 4000.1 million during 2024-2029, accelerating at a CAGR of 20.5% during the forecast period. The report on the cross laminated timber market provides a holistic analysis, market size and forecast, trends, growth drivers, and challenges, as well as vendor analysis covering around 25 vendors.
The report offers an up-to-date analysis regarding the current market scenario, the latest trends and drivers, and the overall market environment. The market is driven by growth in real estate and construction industry, growing demand for sustainable building materials, and increasing demand for durable wood flooring.
| Market Scope | |
|---|---|
| Base Year | 2025 |
| End Year | 2029 |
| Series Year | 2025-2029 |
| Growth Momentum | Accelerate |
| YOY 2025 | 16.6% |
| CAGR | 20.5% |
| Incremental Value | $4000.1 mn |
The study was conducted using an objective combination of primary and secondary information including inputs from key participants in the industry. The report contains a comprehensive market size data, segment with regional analysis and vendor landscape in addition to an analysis of the key companies. Reports have historic and forecast data.
Technavio's cross laminated timber market is segmented as below:
By End-user
- Non-residential
- Residential
By Application
- Structural
- Non-structural
By Type
- Adhesive bonded
- Mechanically fastened
By Geographical Landscape
- Europe
- North America
- APAC
- South America
- Middle East and Africa
This study identifies the focus on forestry management as one of the prime reasons driving the cross laminated timber market growth during the next few years. Also, steady shift in wood supply from natural to plantation forests and increasing number of office spaces will lead to sizable demand in the market.
The report on the cross laminated timber market covers the following areas:
- Cross Laminated Timber Market sizing
- Cross Laminated Timber Market forecast
- Cross Laminated Timber Market industry analysis
The robust vendor analysis is designed to help clients improve their market position, and in line with this, this report provides a detailed analysis of several leading cross laminated timber market vendors that include B and K Structures, Binderholz GmbH, DRJ Wood Innovations, Eugen Decker Holzindustrie KG, Freres Engineered Wood, HASSLACHER Holding GmbH, HESS TIMBER GmbH, KLH Massivholz GmbH, Mayr Melnhof Holz Holding AG, Mercer International Inc., Nordic Structures, Pfeifer Holding GmbH, PFS Corp., Schilliger Holz AG, SmartLam, Sterling Lumber, Stora Enso Oyj, STRABAG SE, StructureCraft, and XLam Ltd.. Also, the cross laminated timber market analysis report includes information on upcoming trends and challenges that will influence market growth. This is to help companies strategize and leverage all forthcoming growth opportunities.
The publisher presents a detailed picture of the market by the way of study, synthesis, and summation of data from multiple sources by an analysis of key parameters such as profit, pricing, competition, and promotions. It presents various market facets by identifying the key industry influencers. The data presented is comprehensive, reliable, and a result of extensive primary and secondary research. The market research reports provide a complete competitive landscape and an in-depth vendor selection methodology and analysis using qualitative and quantitative research to forecast accurate market growth.
Table of Contents
1 Executive Summary
- 1.1 Market overview
- Executive Summary - Chart on Market Overview
- Executive Summary - Data Table on Market Overview
- Executive Summary - Chart on Global Market Characteristics
- Executive Summary - Chart on Market By Geographical Landscape
- Executive Summary - Chart on Market Segmentation by End-user
- Executive Summary - Chart on Market Segmentation by Application
- Executive Summary - Chart on Market Segmentation by Type
- Executive Summary - Chart on Incremental Growth
- Executive Summary - Data Table on Incremental Growth
- Executive Summary - Chart on Company Market Positioning
2 Technavio Analysis
- 2.1 Analysis of price sensitivity, lifecycle, customer purchase basket, adoption rates, and purchase criteria
- Analysis of price sensitivity, lifecycle, customer purchase basket, adoption rates, and purchase criteria
- 2.2 Criticality of inputs and Factors of differentiation
- Overview on criticality of inputs and factors of differentiation
- 2.3 Factors of disruption
- Overview on factors of disruption
- 2.4 Impact of drivers and challenges
- Impact of drivers and challenges in 2024 and 2029
3 Market Landscape
- 3.1 Market ecosystem
- Parent Market
- Data Table on - Parent Market
- 3.2 Market characteristics
- Market characteristics analysis
- 3.3 Value chain analysis
- Value chain analysis
4 Market Sizing
- 4.1 Market definition
- Offerings of companies included in the market definition
- 4.2 Market segment analysis
- Market segments
- 4.3 Market size 2024
- 4.4 Market outlook: Forecast for 2024-2029
- Chart on Global - Market size and forecast 2024-2029 ($ million)
- Data Table on Global - Market size and forecast 2024-2029 ($ million)
- Chart on Global Market: Year-over-year growth 2024-2029 (%)
- Data Table on Global Market: Year-over-year growth 2024-2029 (%)
5 Historic Market Size
- 5.1 Global Cross Laminated Timber Market 2019 - 2023
- Historic Market Size - Data Table on Global Cross Laminated Timber Market 2019 - 2023 ($ million)
- 5.2 End-user segment analysis 2019 - 2023
- Historic Market Size - End-user Segment 2019 - 2023 ($ million)
- 5.3 Application segment analysis 2019 - 2023
- Historic Market Size - Application Segment 2019 - 2023 ($ million)
- 5.4 Type segment analysis 2019 - 2023
- Historic Market Size - Type Segment 2019 - 2023 ($ million)
- 5.5 Geography segment analysis 2019 - 2023
- Historic Market Size - Geography Segment 2019 - 2023 ($ million)
- 5.6 Country segment analysis 2019 - 2023
- Historic Market Size - Country Segment 2019 - 2023 ($ million)
6 Qualitative Analysis
- 6.1 Impact of AI in global cross laminated timber market
7 Five Forces Analysis
- 7.1 Five forces summary
- Five forces analysis - Comparison between 2024 and 2029
- 7.2 Bargaining power of buyers
- Bargaining power of buyers - Impact of key factors 2024 and 2029
- 7.3 Bargaining power of suppliers
- Bargaining power of suppliers - Impact of key factors in 2024 and 2029
- 7.4 Threat of new entrants
- Threat of new entrants - Impact of key factors in 2024 and 2029
- 7.5 Threat of substitutes
- Threat of substitutes - Impact of key factors in 2024 and 2029
- 7.6 Threat of rivalry
- Threat of rivalry - Impact of key factors in 2024 and 2029
- 7.7 Market condition
- Chart on Market condition - Five forces 2024 and 2029
8 Market Segmentation by End-user
- 8.1 Market segments
- Chart on End-user - Market share 2024-2029 (%)
- Data Table on End-user - Market share 2024-2029 (%)
- 8.2 Comparison by End-user
- Chart on Comparison by End-user
- Data Table on Comparison by End-user
- 8.3 Non-residential - Market size and forecast 2024-2029
- Chart on Non-residential - Market size and forecast 2024-2029 ($ million)
- Data Table on Non-residential - Market size and forecast 2024-2029 ($ million)
- Chart on Non-residential - Year-over-year growth 2024-2029 (%)
- Data Table on Non-residential - Year-over-year growth 2024-2029 (%)
- 8.4 Residential - Market size and forecast 2024-2029
- Chart on Residential - Market size and forecast 2024-2029 ($ million)
- Data Table on Residential - Market size and forecast 2024-2029 ($ million)
- Chart on Residential - Year-over-year growth 2024-2029 (%)
- Data Table on Residential - Year-over-year growth 2024-2029 (%)
- 8.5 Market opportunity by End-user
- Market opportunity by End-user ($ million)
- Data Table on Market opportunity by End-user ($ million)
9 Market Segmentation by Application
- 9.1 Market segments
- Chart on Application - Market share 2024-2029 (%)
- Data Table on Application - Market share 2024-2029 (%)
- 9.2 Comparison by Application
- Chart on Comparison by Application
- Data Table on Comparison by Application
- 9.3 Structural - Market size and forecast 2024-2029
- Chart on Structural - Market size and forecast 2024-2029 ($ million)
- Data Table on Structural - Market size and forecast 2024-2029 ($ million)
- Chart on Structural - Year-over-year growth 2024-2029 (%)
- Data Table on Structural - Year-over-year growth 2024-2029 (%)
- 9.4 Non-structural - Market size and forecast 2024-2029
- Chart on Non-structural - Market size and forecast 2024-2029 ($ million)
- Data Table on Non-structural - Market size and forecast 2024-2029 ($ million)
- Chart on Non-structural - Year-over-year growth 2024-2029 (%)
- Data Table on Non-structural - Year-over-year growth 2024-2029 (%)
- 9.5 Market opportunity by Application
- Market opportunity by Application ($ million)
- Data Table on Market opportunity by Application ($ million)
10 Market Segmentation by Type
- 10.1 Market segments
- Chart on Type - Market share 2024-2029 (%)
- Data Table on Type - Market share 2024-2029 (%)
- 10.2 Comparison by Type
- Chart on Comparison by Type
- Data Table on Comparison by Type
- 10.3 Adhesive bonded - Market size and forecast 2024-2029
- Chart on Adhesive bonded - Market size and forecast 2024-2029 ($ million)
- Data Table on Adhesive bonded - Market size and forecast 2024-2029 ($ million)
- Chart on Adhesive bonded - Year-over-year growth 2024-2029 (%)
- Data Table on Adhesive bonded - Year-over-year growth 2024-2029 (%)
- 10.4 Mechanically fastened - Market size and forecast 2024-2029
- Chart on Mechanically fastened - Market size and forecast 2024-2029 ($ million)
- Data Table on Mechanically fastened - Market size and forecast 2024-2029 ($ million)
- Chart on Mechanically fastened - Year-over-year growth 2024-2029 (%)
- Data Table on Mechanically fastened - Year-over-year growth 2024-2029 (%)
- 10.5 Market opportunity by Type
- Market opportunity by Type ($ million)
- Data Table on Market opportunity by Type ($ million)
11 Customer Landscape
- 11.1 Customer landscape overview
- Analysis of price sensitivity, lifecycle, customer purchase basket, adoption rates, and purchase criteria
12 Geographic Landscape
- 12.1 Geographic segmentation
- Chart on Market share By Geographical Landscape 2024-2029 (%)
- Data Table on Market share By Geographical Landscape 2024-2029 (%)
- 12.2 Geographic comparison
- Chart on Geographic comparison
- Data Table on Geographic comparison
- 12.3 Europe - Market size and forecast 2024-2029
- Chart on Europe - Market size and forecast 2024-2029 ($ million)
- Data Table on Europe - Market size and forecast 2024-2029 ($ million)
- Chart on Europe - Year-over-year growth 2024-2029 (%)
- Data Table on Europe - Year-over-year growth 2024-2029 (%)
- 12.4 North America - Market size and forecast 2024-2029
- Chart on North America - Market size and forecast 2024-2029 ($ million)
- Data Table on North America - Market size and forecast 2024-2029 ($ million)
- Chart on North America - Year-over-year growth 2024-2029 (%)
- Data Table on North America - Year-over-year growth 2024-2029 (%)
- 12.5 APAC - Market size and forecast 2024-2029
- Chart on APAC - Market size and forecast 2024-2029 ($ million)
- Data Table on APAC - Market size and forecast 2024-2029 ($ million)
- Chart on APAC - Year-over-year growth 2024-2029 (%)
- Data Table on APAC - Year-over-year growth 2024-2029 (%)
- 12.6 South America - Market size and forecast 2024-2029
- Chart on South America - Market size and forecast 2024-2029 ($ million)
- Data Table on South America - Market size and forecast 2024-2029 ($ million)
- Chart on South America - Year-over-year growth 2024-2029 (%)
- Data Table on South America - Year-over-year growth 2024-2029 (%)
- 12.7 Middle East and Africa - Market size and forecast 2024-2029
- Chart on Middle East and Africa - Market size and forecast 2024-2029 ($ million)
- Data Table on Middle East and Africa - Market size and forecast 2024-2029 ($ million)
- Chart on Middle East and Africa - Year-over-year growth 2024-2029 (%)
- Data Table on Middle East and Africa - Year-over-year growth 2024-2029 (%)
- 12.8 US - Market size and forecast 2024-2029
- Chart on US - Market size and forecast 2024-2029 ($ million)
- Data Table on US - Market size and forecast 2024-2029 ($ million)
- Chart on US - Year-over-year growth 2024-2029 (%)
- Data Table on US - Year-over-year growth 2024-2029 (%)
- 12.9 Germany - Market size and forecast 2024-2029
- Chart on Germany - Market size and forecast 2024-2029 ($ million)
- Data Table on Germany - Market size and forecast 2024-2029 ($ million)
- Chart on Germany - Year-over-year growth 2024-2029 (%)
- Data Table on Germany - Year-over-year growth 2024-2029 (%)
- 12.10 China - Market size and forecast 2024-2029
- Chart on China - Market size and forecast 2024-2029 ($ million)
- Data Table on China - Market size and forecast 2024-2029 ($ million)
- Chart on China - Year-over-year growth 2024-2029 (%)
- Data Table on China - Year-over-year growth 2024-2029 (%)
- 12.11 UK - Market size and forecast 2024-2029
- Chart on UK - Market size and forecast 2024-2029 ($ million)
- Data Table on UK - Market size and forecast 2024-2029 ($ million)
- Chart on UK - Year-over-year growth 2024-2029 (%)
- Data Table on UK - Year-over-year growth 2024-2029 (%)
- 12.12 France - Market size and forecast 2024-2029
- Chart on France - Market size and forecast 2024-2029 ($ million)
- Data Table on France - Market size and forecast 2024-2029 ($ million)
- Chart on France - Year-over-year growth 2024-2029 (%)
- Data Table on France - Year-over-year growth 2024-2029 (%)
- 12.13 Italy - Market size and forecast 2024-2029
- Chart on Italy - Market size and forecast 2024-2029 ($ million)
- Data Table on Italy - Market size and forecast 2024-2029 ($ million)
- Chart on Italy - Year-over-year growth 2024-2029 (%)
- Data Table on Italy - Year-over-year growth 2024-2029 (%)
- 12.14 Canada - Market size and forecast 2024-2029
- Chart on Canada - Market size and forecast 2024-2029 ($ million)
- Data Table on Canada - Market size and forecast 2024-2029 ($ million)
- Chart on Canada - Year-over-year growth 2024-2029 (%)
- Data Table on Canada - Year-over-year growth 2024-2029 (%)
- 12.15 The Netherlands - Market size and forecast 2024-2029
- Chart on The Netherlands - Market size and forecast 2024-2029 ($ million)
- Data Table on The Netherlands - Market size and forecast 2024-2029 ($ million)
- Chart on The Netherlands - Year-over-year growth 2024-2029 (%)
- Data Table on The Netherlands - Year-over-year growth 2024-2029 (%)
- 12.16 Japan - Market size and forecast 2024-2029
- Chart on Japan - Market size and forecast 2024-2029 ($ million)
- Data Table on Japan - Market size and forecast 2024-2029 ($ million)
- Chart on Japan - Year-over-year growth 2024-2029 (%)
- Data Table on Japan - Year-over-year growth 2024-2029 (%)
- 12.17 India - Market size and forecast 2024-2029
- Chart on India - Market size and forecast 2024-2029 ($ million)
- Data Table on India - Market size and forecast 2024-2029 ($ million)
- Chart on India - Year-over-year growth 2024-2029 (%)
- Data Table on India - Year-over-year growth 2024-2029 (%)
- 12.18 Market opportunity By Geographical Landscape
- Market opportunity By Geographical Landscape ($ million)
- Data Tables on Market opportunity By Geographical Landscape ($ million)
13 Drivers, Challenges, and Opportunity/Restraints
- 13.1 Market drivers
- 13.2 Market challenges
- 13.3 Impact of drivers and challenges
- Impact of drivers and challenges in 2024 and 2029
- 13.4 Market opportunities/restraints
14 Competitive Landscape
- 14.1 Overview
- 14.2 Competitive Landscape
- Overview on criticality of inputs and factors of differentiation
- 14.3 Landscape disruption
- Overview on factors of disruption
- 14.4 Industry risks
- Impact of key risks on business
15 Competitive Analysis
- 15.1 Companies profiled
- Companies covered
- 15.2 Company ranking index
- Company ranking index
- 15.3 Market positioning of companies
- Matrix on companies position and classification
- 15.4 B and K Structures
- B and K Structures - Overview
- B and K Structures - Product / Service
- B and K Structures - Key offerings
- SWOT
- 15.5 Binderholz GmbH
- Binderholz GmbH - Overview
- Binderholz GmbH - Product / Service
- Binderholz GmbH - Key offerings
- SWOT
- 15.6 Eugen Decker Holzindustrie KG
- Eugen Decker Holzindustrie KG - Overview
- Eugen Decker Holzindustrie KG - Product / Service
- Eugen Decker Holzindustrie KG - Key offerings
- SWOT
- 15.7 HASSLACHER Holding GmbH
- HASSLACHER Holding GmbH - Overview
- HASSLACHER Holding GmbH - Product / Service
- HASSLACHER Holding GmbH - Key offerings
- SWOT
- 15.8 HESS TIMBER GmbH
- HESS TIMBER GmbH - Overview
- HESS TIMBER GmbH - Product / Service
- HESS TIMBER GmbH - Key offerings
- SWOT
- 15.9 KLH Massivholz GmbH
- KLH Massivholz GmbH - Overview
- KLH Massivholz GmbH - Product / Service
- KLH Massivholz GmbH - Key offerings
- SWOT
- 15.10 Mayr Melnhof Holz Holding AG
- Mayr Melnhof Holz Holding AG - Overview
- Mayr Melnhof Holz Holding AG - Product / Service
- Mayr Melnhof Holz Holding AG - Key offerings
- SWOT
- 15.11 Mercer International Inc.
- Mercer International Inc. - Overview
- Mercer International Inc. - Business segments
- Mercer International Inc. - Key offerings
- Mercer International Inc. - Segment focus
- SWOT
- 15.12 Nordic Structures
- Nordic Structures - Overview
- Nordic Structures - Product / Service
- Nordic Structures - Key offerings
- SWOT
- 15.13 Pfeifer Holding GmbH
- Pfeifer Holding GmbH - Overview
- Pfeifer Holding GmbH - Product / Service
- Pfeifer Holding GmbH - Key offerings
- SWOT
- 15.14 Schilliger Holz AG
- Schilliger Holz AG - Overview
- Schilliger Holz AG - Product / Service
- Schilliger Holz AG - Key offerings
- SWOT
- 15.15 SmartLam
- SmartLam - Overview
- SmartLam - Product / Service
- SmartLam - Key offerings
- SWOT
- 15.16 Sterling Lumber
- Sterling Lumber - Overview
- Sterling Lumber - Product / Service
- Sterling Lumber - Key offerings
- SWOT
- 15.17 Stora Enso Oyj
- Stora Enso Oyj - Overview
- Stora Enso Oyj - Business segments
- Stora Enso Oyj - Key offerings
- Stora Enso Oyj - Segment focus
- SWOT
- 15.18 XLam Ltd.
- XLam Ltd. - Overview
- XLam Ltd. - Product / Service
- XLam Ltd. - Key offerings
- SWOT
16 Appendix
- 16.1 Scope of the report
- 16.2 Inclusions and exclusions checklist
- Inclusions checklist
- Exclusions checklist
- 16.3 Currency conversion rates for US$
- Currency conversion rates for US$
- 16.4 Research methodology
- Research methodology
- 16.5 Data procurement
- Information sources
- 16.6 Data validation
- Data validation
- 16.7 Validation techniques employed for market sizing
- Validation techniques employed for market sizing
- 16.8 Data synthesis
- Data synthesis
- 16.9 360 degree market analysis
- 360 degree market analysis
- 16.10 List of abbreviations
- List of abbreviations

