|
|
市場調査レポート
商品コード
1738160
ライフサイエンス分析の世界市場 2025-2029Global Life Sciences Analytics Market 2025-2029 |
||||||

|
|||||||
カスタマイズ可能
|
|||||||


| ライフサイエンス分析の世界市場 2025-2029 |
|
出版日: 2025年05月22日
発行: TechNavio
ページ情報: 英文 222 Pages
納期: 即納可能
|

全表示
- 概要
- 図表
- 目次
ライフサイエンス分析市場は2024-2029年に263億6,500万米ドル、予測期間中のCAGRは20.6%で成長すると予測されます。
当レポートでは、ライフサイエンス分析市場の全体的な分析、市場規模・予測、動向、成長促進要因、課題、約25のベンダーを網羅したベンダー分析などを掲載しています。
現在の市場シナリオ、最新動向と促進要因、市場環境全体に関する最新分析を提供しています。市場は、ビッグデータとヘルスケア分析の統合の進展、電子カルテ(EHR)の導入拡大、個別化医療の重視の高まりによって牽引されています。
| 市場範囲 | |
|---|---|
| 基準年 | 2025 |
| 終了年 | 2029 |
| 予測期間 | 2025-2029 |
| 成長モメンタム | 加速 |
| 前年比 | 16.6% |
| CAGR | 20.6% |
| 増分額 | 263億6,500万米ドル |
本調査は、業界の主要参加者からのインプットを含め、一次情報と二次情報を客観的に組み合わせて実施しました。レポートには、主要企業の分析に加え、包括的な市場規模データ、地域別分析によるセグメント、ベンダー情勢が含まれています。レポートには過去データと予測データがあります。
本調査では、今後数年間のライフサイエンス分析市場の成長を促進する主な理由の一つとして、価値ベースの医療への注目の高まりを挙げています。また、AIと機械学習(ML)の採用が増加し、AI対応の感情認識技術が出現することで、同市場では大きな需要が見込まれます。
目次
第1章 エグゼクティブサマリー
- 市場概要
第2章 Technavio分析
- 価格・ライフサイクル・顧客購入バスケット・採用率・購入基準の分析
- インプットの重要性と差別化の要因
- 混乱の要因
- 促進要因と課題の影響
第3章 市場情勢
- 市場エコシステム
- 市場の特徴
- バリューチェーン分析
第4章 市場規模
- 市場の定義
- 市場セグメント分析
- 市場規模 2024
- 市場の見通し 2024-2029
第5章 市場規模実績
- ライフサイエンス分析の世界市場 2019-2023
- 展開セグメント分析 2019-2023
- エンドユーザーセグメント分析 2019-2023
- タイプセグメント分析 2019-2023
- 地域別セグメント分析 2019-2023
- 国別セグメント分析 2019-2023
第6章 定性分析
- AIの影響ライフサイエンス分析の世界市場
第7章 ファイブフォース分析
- ファイブフォースの要約
- 買い手の交渉力
- 供給企業の交渉力
- 新規参入業者の脅威
- 代替品の脅威
- 競争の脅威
- 市況
第8章 市場セグメンテーション:展開別
- 市場セグメント
- 比較:展開別
- クラウド:市場規模と予測 2024-2029
- オンプレミス:市場規模と予測 2024-2029
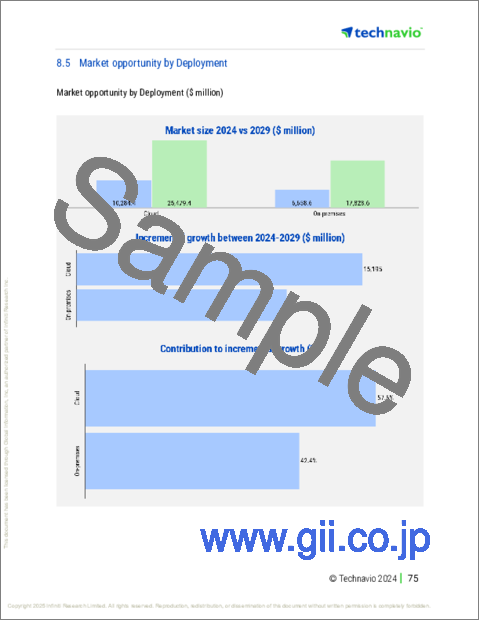
- 市場機会:展開別
第9章 市場セグメンテーション:エンドユーザー別
- 市場セグメント
- 比較:エンドユーザー別
- 製薬会社:市場規模と予測 2024-2029
- バイオテクノロジー企業:市場規模と予測 2024-2029
- その他:市場規模と予測 2024-2029
- 市場機会:エンドユーザー別
第10章 市場セグメンテーション:タイプ別
- 市場セグメント
- 比較:タイプ別
- 記述的分析:市場規模と予測 2024-2029
- 予測分析:市場規模と予測 2024-2029
- 処方的分析:市場規模と予測 2024-2029
- 診断分析:市場規模と予測 2024-2029
- 市場機会:タイプ別
第11章 顧客情勢
- 顧客情勢の概要
第12章 地域別情勢
- 地域別セグメンテーション
- 地域別比較
- 北米:市場規模と予測 2024-2029
- 欧州:市場規模と予測 2024-2029
- アジア:市場規模と予測 2024-2029
- 世界のその他の地域:市場規模と予測 2024-2029
- 米国:市場規模と予測 2024-2029
- 中国:市場規模と予測 2024-2029
- ドイツ:市場規模と予測 2024-2029
- カナダ:市場規模と予測 2024-2029
- 英国:市場規模と予測 2024-2029
- 日本:市場規模と予測 2024-2029
- インド:市場規模と予測 2024-2029
- フランス:市場規模と予測 2024-2029
- イタリア:市場規模と予測 2024-2029
- 韓国:市場規模と予測 2024-2029
- 市場機会:地域情勢別
第13章 促進要因・課題・機会・抑制要因
- 市場促進要因
- 市場の課題
- 促進要因と課題の影響
- 市場の機会・抑制要因
第14章 競合情勢
- 概要
- 競合情勢
- 混乱の状況
- 業界のリスク
第15章 競合分析
- 企業プロファイル
- 企業ランキング指数
- 企業の市場ポジショニング
- Accenture PLC
- Cognizant Technology Solutions Corp.
- Cotiviti Inc.
- ExlService Holdings Inc.
- International Business Machines Corp.
- IQVIA Holdings Inc.
- MaxisIT Inc.
- Microsoft Corp.
- Oracle Corp.
- SAS Institute Inc.
- TAKE Solutions Ltd.
- ThoughtSphere
- United Health Group Inc.
- Veradigm LLC
- Wipro Ltd.
第16章 付録
Exhibits:
- Exhibits1: Executive Summary - Chart on Market Overview
- Exhibits2: Executive Summary - Data Table on Market Overview
- Exhibits3: Executive Summary - Chart on Global Market Characteristics
- Exhibits4: Executive Summary - Chart on Market By Geographical Landscape
- Exhibits5: Executive Summary - Chart on Market Segmentation by Deployment
- Exhibits6: Executive Summary - Chart on Market Segmentation by End-user
- Exhibits7: Executive Summary - Chart on Market Segmentation by Type
- Exhibits8: Executive Summary - Chart on Incremental Growth
- Exhibits9: Executive Summary - Data Table on Incremental Growth
- Exhibits10: Executive Summary - Chart on Company Market Positioning
- Exhibits11: Analysis of price sensitivity, lifecycle, customer purchase basket, adoption rates, and purchase criteria
- Exhibits12: Overview on criticality of inputs and factors of differentiation
- Exhibits13: Overview on factors of disruption
- Exhibits14: Impact of drivers and challenges in 2024 and 2029
- Exhibits15: Parent Market
- Exhibits16: Data Table on - Parent Market
- Exhibits17: Market characteristics analysis
- Exhibits18: Value chain analysis
- Exhibits19: Offerings of companies included in the market definition
- Exhibits20: Market segments
- Exhibits21: Chart on Global - Market size and forecast 2024-2029 ($ million)
- Exhibits22: Data Table on Global - Market size and forecast 2024-2029 ($ million)
- Exhibits23: Chart on Global Market: Year-over-year growth 2024-2029 (%)
- Exhibits24: Data Table on Global Market: Year-over-year growth 2024-2029 (%)
- Exhibits25: Historic Market Size - Data Table on Global Life Sciences Analytics Market 2019 - 2023 ($ million)
- Exhibits26: Historic Market Size - Deployment Segment 2019 - 2023 ($ million)
- Exhibits27: Historic Market Size - End-user Segment 2019 - 2023 ($ million)
- Exhibits28: Historic Market Size - Type Segment 2019 - 2023 ($ million)
- Exhibits29: Historic Market Size - Geography Segment 2019 - 2023 ($ million)
- Exhibits30: Historic Market Size - Country Segment 2019 - 2023 ($ million)
- Exhibits31: Five forces analysis - Comparison between 2024 and 2029
- Exhibits32: Bargaining power of buyers - Impact of key factors 2024 and 2029
- Exhibits33: Bargaining power of suppliers - Impact of key factors in 2024 and 2029
- Exhibits34: Threat of new entrants - Impact of key factors in 2024 and 2029
- Exhibits35: Threat of substitutes - Impact of key factors in 2024 and 2029
- Exhibits36: Threat of rivalry - Impact of key factors in 2024 and 2029
- Exhibits37: Chart on Market condition - Five forces 2024 and 2029
- Exhibits38: Chart on Deployment - Market share 2024-2029 (%)
- Exhibits39: Data Table on Deployment - Market share 2024-2029 (%)
- Exhibits40: Chart on Comparison by Deployment
- Exhibits41: Data Table on Comparison by Deployment
- Exhibits42: Chart on Cloud - Market size and forecast 2024-2029 ($ million)
- Exhibits43: Data Table on Cloud - Market size and forecast 2024-2029 ($ million)
- Exhibits44: Chart on Cloud - Year-over-year growth 2024-2029 (%)
- Exhibits45: Data Table on Cloud - Year-over-year growth 2024-2029 (%)
- Exhibits46: Chart on On-premises - Market size and forecast 2024-2029 ($ million)
- Exhibits47: Data Table on On-premises - Market size and forecast 2024-2029 ($ million)
- Exhibits48: Chart on On-premises - Year-over-year growth 2024-2029 (%)
- Exhibits49: Data Table on On-premises - Year-over-year growth 2024-2029 (%)
- Exhibits50: Market opportunity by Deployment ($ million)
- Exhibits51: Data Table on Market opportunity by Deployment ($ million)
- Exhibits52: Chart on End-user - Market share 2024-2029 (%)
- Exhibits53: Data Table on End-user - Market share 2024-2029 (%)
- Exhibits54: Chart on Comparison by End-user
- Exhibits55: Data Table on Comparison by End-user
- Exhibits56: Chart on Pharmaceutical companies - Market size and forecast 2024-2029 ($ million)
- Exhibits57: Data Table on Pharmaceutical companies - Market size and forecast 2024-2029 ($ million)
- Exhibits58: Chart on Pharmaceutical companies - Year-over-year growth 2024-2029 (%)
- Exhibits59: Data Table on Pharmaceutical companies - Year-over-year growth 2024-2029 (%)
- Exhibits60: Chart on Biotechnology companies - Market size and forecast 2024-2029 ($ million)
- Exhibits61: Data Table on Biotechnology companies - Market size and forecast 2024-2029 ($ million)
- Exhibits62: Chart on Biotechnology companies - Year-over-year growth 2024-2029 (%)
- Exhibits63: Data Table on Biotechnology companies - Year-over-year growth 2024-2029 (%)
- Exhibits64: Chart on Others - Market size and forecast 2024-2029 ($ million)
- Exhibits65: Data Table on Others - Market size and forecast 2024-2029 ($ million)
- Exhibits66: Chart on Others - Year-over-year growth 2024-2029 (%)
- Exhibits67: Data Table on Others - Year-over-year growth 2024-2029 (%)
- Exhibits68: Market opportunity by End-user ($ million)
- Exhibits69: Data Table on Market opportunity by End-user ($ million)
- Exhibits70: Chart on Type - Market share 2024-2029 (%)
- Exhibits71: Data Table on Type - Market share 2024-2029 (%)
- Exhibits72: Chart on Comparison by Type
- Exhibits73: Data Table on Comparison by Type
- Exhibits74: Chart on Descriptive analytics - Market size and forecast 2024-2029 ($ million)
- Exhibits75: Data Table on Descriptive analytics - Market size and forecast 2024-2029 ($ million)
- Exhibits76: Chart on Descriptive analytics - Year-over-year growth 2024-2029 (%)
- Exhibits77: Data Table on Descriptive analytics - Year-over-year growth 2024-2029 (%)
- Exhibits78: Chart on Predictive analytics - Market size and forecast 2024-2029 ($ million)
- Exhibits79: Data Table on Predictive analytics - Market size and forecast 2024-2029 ($ million)
- Exhibits80: Chart on Predictive analytics - Year-over-year growth 2024-2029 (%)
- Exhibits81: Data Table on Predictive analytics - Year-over-year growth 2024-2029 (%)
- Exhibits82: Chart on Prescriptive analytics - Market size and forecast 2024-2029 ($ million)
- Exhibits83: Data Table on Prescriptive analytics - Market size and forecast 2024-2029 ($ million)
- Exhibits84: Chart on Prescriptive analytics - Year-over-year growth 2024-2029 (%)
- Exhibits85: Data Table on Prescriptive analytics - Year-over-year growth 2024-2029 (%)
- Exhibits86: Chart on Diagnostic analytics - Market size and forecast 2024-2029 ($ million)
- Exhibits87: Data Table on Diagnostic analytics - Market size and forecast 2024-2029 ($ million)
- Exhibits88: Chart on Diagnostic analytics - Year-over-year growth 2024-2029 (%)
- Exhibits89: Data Table on Diagnostic analytics - Year-over-year growth 2024-2029 (%)
- Exhibits90: Market opportunity by Type ($ million)
- Exhibits91: Data Table on Market opportunity by Type ($ million)
- Exhibits92: Analysis of price sensitivity, lifecycle, customer purchase basket, adoption rates, and purchase criteria
- Exhibits93: Chart on Market share By Geographical Landscape 2024-2029 (%)
- Exhibits94: Data Table on Market share By Geographical Landscape 2024-2029 (%)
- Exhibits95: Chart on Geographic comparison
- Exhibits96: Data Table on Geographic comparison
- Exhibits97: Chart on North America - Market size and forecast 2024-2029 ($ million)
- Exhibits98: Data Table on North America - Market size and forecast 2024-2029 ($ million)
- Exhibits99: Chart on North America - Year-over-year growth 2024-2029 (%)
- Exhibits100: Data Table on North America - Year-over-year growth 2024-2029 (%)
- Exhibits101: Chart on Europe - Market size and forecast 2024-2029 ($ million)
- Exhibits102: Data Table on Europe - Market size and forecast 2024-2029 ($ million)
- Exhibits103: Chart on Europe - Year-over-year growth 2024-2029 (%)
- Exhibits104: Data Table on Europe - Year-over-year growth 2024-2029 (%)
- Exhibits105: Chart on Asia - Market size and forecast 2024-2029 ($ million)
- Exhibits106: Data Table on Asia - Market size and forecast 2024-2029 ($ million)
- Exhibits107: Chart on Asia - Year-over-year growth 2024-2029 (%)
- Exhibits108: Data Table on Asia - Year-over-year growth 2024-2029 (%)
- Exhibits109: Chart on Rest of World (ROW) - Market size and forecast 2024-2029 ($ million)
- Exhibits110: Data Table on Rest of World (ROW) - Market size and forecast 2024-2029 ($ million)
- Exhibits111: Chart on Rest of World (ROW) - Year-over-year growth 2024-2029 (%)
- Exhibits112: Data Table on Rest of World (ROW) - Year-over-year growth 2024-2029 (%)
- Exhibits113: Chart on US - Market size and forecast 2024-2029 ($ million)
- Exhibits114: Data Table on US - Market size and forecast 2024-2029 ($ million)
- Exhibits115: Chart on US - Year-over-year growth 2024-2029 (%)
- Exhibits116: Data Table on US - Year-over-year growth 2024-2029 (%)
- Exhibits117: Chart on China - Market size and forecast 2024-2029 ($ million)
- Exhibits118: Data Table on China - Market size and forecast 2024-2029 ($ million)
- Exhibits119: Chart on China - Year-over-year growth 2024-2029 (%)
- Exhibits120: Data Table on China - Year-over-year growth 2024-2029 (%)
- Exhibits121: Chart on Germany - Market size and forecast 2024-2029 ($ million)
- Exhibits122: Data Table on Germany - Market size and forecast 2024-2029 ($ million)
- Exhibits123: Chart on Germany - Year-over-year growth 2024-2029 (%)
- Exhibits124: Data Table on Germany - Year-over-year growth 2024-2029 (%)
- Exhibits125: Chart on Canada - Market size and forecast 2024-2029 ($ million)
- Exhibits126: Data Table on Canada - Market size and forecast 2024-2029 ($ million)
- Exhibits127: Chart on Canada - Year-over-year growth 2024-2029 (%)
- Exhibits128: Data Table on Canada - Year-over-year growth 2024-2029 (%)
- Exhibits129: Chart on UK - Market size and forecast 2024-2029 ($ million)
- Exhibits130: Data Table on UK - Market size and forecast 2024-2029 ($ million)
- Exhibits131: Chart on UK - Year-over-year growth 2024-2029 (%)
- Exhibits132: Data Table on UK - Year-over-year growth 2024-2029 (%)
- Exhibits133: Chart on Japan - Market size and forecast 2024-2029 ($ million)
- Exhibits134: Data Table on Japan - Market size and forecast 2024-2029 ($ million)
- Exhibits135: Chart on Japan - Year-over-year growth 2024-2029 (%)
- Exhibits136: Data Table on Japan - Year-over-year growth 2024-2029 (%)
- Exhibits137: Chart on India - Market size and forecast 2024-2029 ($ million)
- Exhibits138: Data Table on India - Market size and forecast 2024-2029 ($ million)
- Exhibits139: Chart on India - Year-over-year growth 2024-2029 (%)
- Exhibits140: Data Table on India - Year-over-year growth 2024-2029 (%)
- Exhibits141: Chart on France - Market size and forecast 2024-2029 ($ million)
- Exhibits142: Data Table on France - Market size and forecast 2024-2029 ($ million)
- Exhibits143: Chart on France - Year-over-year growth 2024-2029 (%)
- Exhibits144: Data Table on France - Year-over-year growth 2024-2029 (%)
- Exhibits145: Chart on Italy - Market size and forecast 2024-2029 ($ million)
- Exhibits146: Data Table on Italy - Market size and forecast 2024-2029 ($ million)
- Exhibits147: Chart on Italy - Year-over-year growth 2024-2029 (%)
- Exhibits148: Data Table on Italy - Year-over-year growth 2024-2029 (%)
- Exhibits149: Chart on South Korea - Market size and forecast 2024-2029 ($ million)
- Exhibits150: Data Table on South Korea - Market size and forecast 2024-2029 ($ million)
- Exhibits151: Chart on South Korea - Year-over-year growth 2024-2029 (%)
- Exhibits152: Data Table on South Korea - Year-over-year growth 2024-2029 (%)
- Exhibits153: Market opportunity By Geographical Landscape ($ million)
- Exhibits154: Data Tables on Market opportunity By Geographical Landscape ($ million)
- Exhibits155: Impact of drivers and challenges in 2024 and 2029
- Exhibits156: Overview on criticality of inputs and factors of differentiation
- Exhibits157: Overview on factors of disruption
- Exhibits158: Impact of key risks on business
- Exhibits159: Companies covered
- Exhibits160: Company ranking index
- Exhibits161: Matrix on companies position and classification
- Exhibits162: Accenture PLC - Overview
- Exhibits163: Accenture PLC - Business segments
- Exhibits164: Accenture PLC - Key news
- Exhibits165: Accenture PLC - Key offerings
- Exhibits166: Accenture PLC - Segment focus
- Exhibits167: SWOT
- Exhibits168: Cognizant Technology Solutions Corp. - Overview
- Exhibits169: Cognizant Technology Solutions Corp. - Business segments
- Exhibits170: Cognizant Technology Solutions Corp. - Key news
- Exhibits171: Cognizant Technology Solutions Corp. - Key offerings
- Exhibits172: Cognizant Technology Solutions Corp. - Segment focus
- Exhibits173: SWOT
- Exhibits174: Cotiviti Inc. - Overview
- Exhibits175: Cotiviti Inc. - Product / Service
- Exhibits176: Cotiviti Inc. - Key offerings
- Exhibits177: SWOT
- Exhibits178: ExlService Holdings Inc. - Overview
- Exhibits179: ExlService Holdings Inc. - Business segments
- Exhibits180: ExlService Holdings Inc. - Key offerings
- Exhibits181: ExlService Holdings Inc. - Segment focus
- Exhibits182: SWOT
- Exhibits183: International Business Machines Corp. - Overview
- Exhibits184: International Business Machines Corp. - Business segments
- Exhibits185: International Business Machines Corp. - Key news
- Exhibits186: International Business Machines Corp. - Key offerings
- Exhibits187: International Business Machines Corp. - Segment focus
- Exhibits188: SWOT
- Exhibits189: IQVIA Holdings Inc. - Overview
- Exhibits190: IQVIA Holdings Inc. - Business segments
- Exhibits191: IQVIA Holdings Inc. - Key offerings
- Exhibits192: IQVIA Holdings Inc. - Segment focus
- Exhibits193: SWOT
- Exhibits194: MaxisIT Inc. - Overview
- Exhibits195: MaxisIT Inc. - Product / Service
- Exhibits196: MaxisIT Inc. - Key offerings
- Exhibits197: SWOT
- Exhibits198: Microsoft Corp. - Overview
- Exhibits199: Microsoft Corp. - Business segments
- Exhibits200: Microsoft Corp. - Key news
- Exhibits201: Microsoft Corp. - Key offerings
- Exhibits202: Microsoft Corp. - Segment focus
- Exhibits203: SWOT
- Exhibits204: Oracle Corp. - Overview
- Exhibits205: Oracle Corp. - Business segments
- Exhibits206: Oracle Corp. - Key news
- Exhibits207: Oracle Corp. - Key offerings
- Exhibits208: Oracle Corp. - Segment focus
- Exhibits209: SWOT
- Exhibits210: SAS Institute Inc. - Overview
- Exhibits211: SAS Institute Inc. - Product / Service
- Exhibits212: SAS Institute Inc. - Key news
- Exhibits213: SAS Institute Inc. - Key offerings
- Exhibits214: SWOT
- Exhibits215: TAKE Solutions Ltd. - Overview
- Exhibits216: TAKE Solutions Ltd. - Product / Service
- Exhibits217: TAKE Solutions Ltd. - Key offerings
- Exhibits218: SWOT
- Exhibits219: ThoughtSphere - Overview
- Exhibits220: ThoughtSphere - Product / Service
- Exhibits221: ThoughtSphere - Key offerings
- Exhibits222: SWOT
- Exhibits223: United Health Group Inc. - Overview
- Exhibits224: United Health Group Inc. - Business segments
- Exhibits225: United Health Group Inc. - Key offerings
- Exhibits226: United Health Group Inc. - Segment focus
- Exhibits227: SWOT
- Exhibits228: Veradigm LLC - Overview
- Exhibits229: Veradigm LLC - Product / Service
- Exhibits230: Veradigm LLC - Key offerings
- Exhibits231: SWOT
- Exhibits232: Wipro Ltd. - Overview
- Exhibits233: Wipro Ltd. - Business segments
- Exhibits234: Wipro Ltd. - Key news
- Exhibits235: Wipro Ltd. - Key offerings
- Exhibits236: Wipro Ltd. - Segment focus
- Exhibits237: SWOT
- Exhibits238: Inclusions checklist
- Exhibits239: Exclusions checklist
- Exhibits240: Currency conversion rates for US$
- Exhibits241: Research methodology
- Exhibits242: Information sources
- Exhibits243: Data validation
- Exhibits244: Validation techniques employed for market sizing
- Exhibits245: Data synthesis
- Exhibits246: 360 degree market analysis
- Exhibits247: List of abbreviations
The life sciences analytics market is forecasted to grow by USD 26,365 mn during 2024-2029, accelerating at a CAGR of 20.6% during the forecast period. The report on the life sciences analytics market provides a holistic analysis, market size and forecast, trends, growth drivers, and challenges, as well as vendor analysis covering around 25 vendors.
The report offers an up-to-date analysis regarding the current market scenario, the latest trends and drivers, and the overall market environment. The market is driven by growing integration of big data with healthcare analytics, increasing adoption of electronic health records (EHRs), and growing emphasis on personalized medicine.
| Market Scope | |
|---|---|
| Base Year | 2025 |
| End Year | 2029 |
| Series Year | 2025-2029 |
| Growth Momentum | Accelerate |
| YOY 2025 | 16.6% |
| CAGR | 20.6% |
| Incremental Value | $26,365.0 mn |
The study was conducted using an objective combination of primary and secondary information including inputs from key participants in the industry. The report contains a comprehensive market size data, segment with regional analysis and vendor landscape in addition to an analysis of the key companies. Reports have historic and forecast data.
Technavio's life sciences analytics market is segmented as below:
By Deployment
- Cloud
- On-premises
By End-user
- Pharmaceutical companies
- Biotechnology companies
- Others
By Type
- Descriptive analytics
- Predictive analytics
- Prescriptive analytics
- Diagnostic analytics
By Geographical Landscape
- North America
- Europe
- Asia
- Rest of World (ROW)
This study identifies the increasing focus on value-based medicine as one of the prime reasons driving the life sciences analytics market growth during the next few years. Also, rising adoption of ai and machine learning (ML) and emergence of ai-enabled emotion recognition technologies will lead to sizable demand in the market.
The report on the life sciences analytics market covers the following areas:
- Life Sciences Analytics Market sizing
- Life Sciences Analytics Market forecast
- Life Sciences Analytics Market industry analysis
The robust vendor analysis is designed to help clients improve their market position, and in line with this, this report provides a detailed analysis of several leading life sciences analytics market vendors that include Accenture PLC, Alteryx Inc., Amazon.com Inc., Cognizant Technology Solutions Corp., Cotiviti Inc., ExlService Holdings Inc., International Business Machines Corp., IQVIA Holdings Inc., MaxisIT Inc., Microsoft Corp., Oracle Corp., Pyramid Analytics BV, SAS Institute Inc., Sisense Ltd., TAKE Solutions Ltd., ThoughtSphere, United Health Group Inc., Veradigm LLC, and Wipro Ltd.. Also, the life sciences analytics market analysis report includes information on upcoming trends and challenges that will influence market growth. This is to help companies strategize and leverage all forthcoming growth opportunities.
The publisher presents a detailed picture of the market by the way of study, synthesis, and summation of data from multiple sources by an analysis of key parameters such as profit, pricing, competition, and promotions. It presents various market facets by identifying the key industry influencers. The data presented is comprehensive, reliable, and a result of extensive primary and secondary research. The market research reports provide a complete competitive landscape and an in-depth vendor selection methodology and analysis using qualitative and quantitative research to forecast accurate market growth.
Table of Contents
1 Executive Summary
- 1.1 Market overview
- Executive Summary - Chart on Market Overview
- Executive Summary - Data Table on Market Overview
- Executive Summary - Chart on Global Market Characteristics
- Executive Summary - Chart on Market By Geographical Landscape
- Executive Summary - Chart on Market Segmentation by Deployment
- Executive Summary - Chart on Market Segmentation by End-user
- Executive Summary - Chart on Market Segmentation by Type
- Executive Summary - Chart on Incremental Growth
- Executive Summary - Data Table on Incremental Growth
- Executive Summary - Chart on Company Market Positioning
2 Technavio Analysis
- 2.1 Analysis of price sensitivity, lifecycle, customer purchase basket, adoption rates, and purchase criteria
- Analysis of price sensitivity, lifecycle, customer purchase basket, adoption rates, and purchase criteria
- 2.2 Criticality of inputs and Factors of differentiation
- Overview on criticality of inputs and factors of differentiation
- 2.3 Factors of disruption
- Overview on factors of disruption
- 2.4 Impact of drivers and challenges
- Impact of drivers and challenges in 2024 and 2029
3 Market Landscape
- 3.1 Market ecosystem
- Parent Market
- Data Table on - Parent Market
- 3.2 Market characteristics
- Market characteristics analysis
- 3.3 Value chain analysis
- Value chain analysis
4 Market Sizing
- 4.1 Market definition
- Offerings of companies included in the market definition
- 4.2 Market segment analysis
- Market segments
- 4.3 Market size 2024
- 4.4 Market outlook: Forecast for 2024-2029
- Chart on Global - Market size and forecast 2024-2029 ($ million)
- Data Table on Global - Market size and forecast 2024-2029 ($ million)
- Chart on Global Market: Year-over-year growth 2024-2029 (%)
- Data Table on Global Market: Year-over-year growth 2024-2029 (%)
5 Historic Market Size
- 5.1 Global Life Sciences Analytics Market 2019 - 2023
- Historic Market Size - Data Table on Global Life Sciences Analytics Market 2019 - 2023 ($ million)
- 5.2 Deployment segment analysis 2019 - 2023
- Historic Market Size - Deployment Segment 2019 - 2023 ($ million)
- 5.3 End-user segment analysis 2019 - 2023
- Historic Market Size - End-user Segment 2019 - 2023 ($ million)
- 5.4 Type segment analysis 2019 - 2023
- Historic Market Size - Type Segment 2019 - 2023 ($ million)
- 5.5 Geography segment analysis 2019 - 2023
- Historic Market Size - Geography Segment 2019 - 2023 ($ million)
- 5.6 Country segment analysis 2019 - 2023
- Historic Market Size - Country Segment 2019 - 2023 ($ million)
6 Qualitative Analysis
- 6.1 Impact of AI in the Global Life Sciences Analytics Market
7 Five Forces Analysis
- 7.1 Five forces summary
- Five forces analysis - Comparison between 2024 and 2029
- 7.2 Bargaining power of buyers
- Bargaining power of buyers - Impact of key factors 2024 and 2029
- 7.3 Bargaining power of suppliers
- Bargaining power of suppliers - Impact of key factors in 2024 and 2029
- 7.4 Threat of new entrants
- Threat of new entrants - Impact of key factors in 2024 and 2029
- 7.5 Threat of substitutes
- Threat of substitutes - Impact of key factors in 2024 and 2029
- 7.6 Threat of rivalry
- Threat of rivalry - Impact of key factors in 2024 and 2029
- 7.7 Market condition
- Chart on Market condition - Five forces 2024 and 2029
8 Market Segmentation by Deployment
- 8.1 Market segments
- Chart on Deployment - Market share 2024-2029 (%)
- Data Table on Deployment - Market share 2024-2029 (%)
- 8.2 Comparison by Deployment
- Chart on Comparison by Deployment
- Data Table on Comparison by Deployment
- 8.3 Cloud - Market size and forecast 2024-2029
- Chart on Cloud - Market size and forecast 2024-2029 ($ million)
- Data Table on Cloud - Market size and forecast 2024-2029 ($ million)
- Chart on Cloud - Year-over-year growth 2024-2029 (%)
- Data Table on Cloud - Year-over-year growth 2024-2029 (%)
- 8.4 On-premises - Market size and forecast 2024-2029
- Chart on On-premises - Market size and forecast 2024-2029 ($ million)
- Data Table on On-premises - Market size and forecast 2024-2029 ($ million)
- Chart on On-premises - Year-over-year growth 2024-2029 (%)
- Data Table on On-premises - Year-over-year growth 2024-2029 (%)
- 8.5 Market opportunity by Deployment
- Market opportunity by Deployment ($ million)
- Data Table on Market opportunity by Deployment ($ million)
9 Market Segmentation by End-user
- 9.1 Market segments
- Chart on End-user - Market share 2024-2029 (%)
- Data Table on End-user - Market share 2024-2029 (%)
- 9.2 Comparison by End-user
- Chart on Comparison by End-user
- Data Table on Comparison by End-user
- 9.3 Pharmaceutical companies - Market size and forecast 2024-2029
- Chart on Pharmaceutical companies - Market size and forecast 2024-2029 ($ million)
- Data Table on Pharmaceutical companies - Market size and forecast 2024-2029 ($ million)
- Chart on Pharmaceutical companies - Year-over-year growth 2024-2029 (%)
- Data Table on Pharmaceutical companies - Year-over-year growth 2024-2029 (%)
- 9.4 Biotechnology companies - Market size and forecast 2024-2029
- Chart on Biotechnology companies - Market size and forecast 2024-2029 ($ million)
- Data Table on Biotechnology companies - Market size and forecast 2024-2029 ($ million)
- Chart on Biotechnology companies - Year-over-year growth 2024-2029 (%)
- Data Table on Biotechnology companies - Year-over-year growth 2024-2029 (%)
- 9.5 Others - Market size and forecast 2024-2029
- Chart on Others - Market size and forecast 2024-2029 ($ million)
- Data Table on Others - Market size and forecast 2024-2029 ($ million)
- Chart on Others - Year-over-year growth 2024-2029 (%)
- Data Table on Others - Year-over-year growth 2024-2029 (%)
- 9.6 Market opportunity by End-user
- Market opportunity by End-user ($ million)
- Data Table on Market opportunity by End-user ($ million)
10 Market Segmentation by Type
- 10.1 Market segments
- Chart on Type - Market share 2024-2029 (%)
- Data Table on Type - Market share 2024-2029 (%)
- 10.2 Comparison by Type
- Chart on Comparison by Type
- Data Table on Comparison by Type
- 10.3 Descriptive analytics - Market size and forecast 2024-2029
- Chart on Descriptive analytics - Market size and forecast 2024-2029 ($ million)
- Data Table on Descriptive analytics - Market size and forecast 2024-2029 ($ million)
- Chart on Descriptive analytics - Year-over-year growth 2024-2029 (%)
- Data Table on Descriptive analytics - Year-over-year growth 2024-2029 (%)
- 10.4 Predictive analytics - Market size and forecast 2024-2029
- Chart on Predictive analytics - Market size and forecast 2024-2029 ($ million)
- Data Table on Predictive analytics - Market size and forecast 2024-2029 ($ million)
- Chart on Predictive analytics - Year-over-year growth 2024-2029 (%)
- Data Table on Predictive analytics - Year-over-year growth 2024-2029 (%)
- 10.5 Prescriptive analytics - Market size and forecast 2024-2029
- Chart on Prescriptive analytics - Market size and forecast 2024-2029 ($ million)
- Data Table on Prescriptive analytics - Market size and forecast 2024-2029 ($ million)
- Chart on Prescriptive analytics - Year-over-year growth 2024-2029 (%)
- Data Table on Prescriptive analytics - Year-over-year growth 2024-2029 (%)
- 10.6 Diagnostic analytics - Market size and forecast 2024-2029
- Chart on Diagnostic analytics - Market size and forecast 2024-2029 ($ million)
- Data Table on Diagnostic analytics - Market size and forecast 2024-2029 ($ million)
- Chart on Diagnostic analytics - Year-over-year growth 2024-2029 (%)
- Data Table on Diagnostic analytics - Year-over-year growth 2024-2029 (%)
- 10.7 Market opportunity by Type
- Market opportunity by Type ($ million)
- Data Table on Market opportunity by Type ($ million)
11 Customer Landscape
- 11.1 Customer landscape overview
- Analysis of price sensitivity, lifecycle, customer purchase basket, adoption rates, and purchase criteria
12 Geographic Landscape
- 12.1 Geographic segmentation
- Chart on Market share By Geographical Landscape 2024-2029 (%)
- Data Table on Market share By Geographical Landscape 2024-2029 (%)
- 12.2 Geographic comparison
- Chart on Geographic comparison
- Data Table on Geographic comparison
- 12.3 North America - Market size and forecast 2024-2029
- Chart on North America - Market size and forecast 2024-2029 ($ million)
- Data Table on North America - Market size and forecast 2024-2029 ($ million)
- Chart on North America - Year-over-year growth 2024-2029 (%)
- Data Table on North America - Year-over-year growth 2024-2029 (%)
- 12.4 Europe - Market size and forecast 2024-2029
- Chart on Europe - Market size and forecast 2024-2029 ($ million)
- Data Table on Europe - Market size and forecast 2024-2029 ($ million)
- Chart on Europe - Year-over-year growth 2024-2029 (%)
- Data Table on Europe - Year-over-year growth 2024-2029 (%)
- 12.5 Asia - Market size and forecast 2024-2029
- Chart on Asia - Market size and forecast 2024-2029 ($ million)
- Data Table on Asia - Market size and forecast 2024-2029 ($ million)
- Chart on Asia - Year-over-year growth 2024-2029 (%)
- Data Table on Asia - Year-over-year growth 2024-2029 (%)
- 12.6 Rest of World (ROW) - Market size and forecast 2024-2029
- Chart on Rest of World (ROW) - Market size and forecast 2024-2029 ($ million)
- Data Table on Rest of World (ROW) - Market size and forecast 2024-2029 ($ million)
- Chart on Rest of World (ROW) - Year-over-year growth 2024-2029 (%)
- Data Table on Rest of World (ROW) - Year-over-year growth 2024-2029 (%)
- 12.7 US - Market size and forecast 2024-2029
- Chart on US - Market size and forecast 2024-2029 ($ million)
- Data Table on US - Market size and forecast 2024-2029 ($ million)
- Chart on US - Year-over-year growth 2024-2029 (%)
- Data Table on US - Year-over-year growth 2024-2029 (%)
- 12.8 China - Market size and forecast 2024-2029
- Chart on China - Market size and forecast 2024-2029 ($ million)
- Data Table on China - Market size and forecast 2024-2029 ($ million)
- Chart on China - Year-over-year growth 2024-2029 (%)
- Data Table on China - Year-over-year growth 2024-2029 (%)
- 12.9 Germany - Market size and forecast 2024-2029
- Chart on Germany - Market size and forecast 2024-2029 ($ million)
- Data Table on Germany - Market size and forecast 2024-2029 ($ million)
- Chart on Germany - Year-over-year growth 2024-2029 (%)
- Data Table on Germany - Year-over-year growth 2024-2029 (%)
- 12.10 Canada - Market size and forecast 2024-2029
- Chart on Canada - Market size and forecast 2024-2029 ($ million)
- Data Table on Canada - Market size and forecast 2024-2029 ($ million)
- Chart on Canada - Year-over-year growth 2024-2029 (%)
- Data Table on Canada - Year-over-year growth 2024-2029 (%)
- 12.11 UK - Market size and forecast 2024-2029
- Chart on UK - Market size and forecast 2024-2029 ($ million)
- Data Table on UK - Market size and forecast 2024-2029 ($ million)
- Chart on UK - Year-over-year growth 2024-2029 (%)
- Data Table on UK - Year-over-year growth 2024-2029 (%)
- 12.12 Japan - Market size and forecast 2024-2029
- Chart on Japan - Market size and forecast 2024-2029 ($ million)
- Data Table on Japan - Market size and forecast 2024-2029 ($ million)
- Chart on Japan - Year-over-year growth 2024-2029 (%)
- Data Table on Japan - Year-over-year growth 2024-2029 (%)
- 12.13 India - Market size and forecast 2024-2029
- Chart on India - Market size and forecast 2024-2029 ($ million)
- Data Table on India - Market size and forecast 2024-2029 ($ million)
- Chart on India - Year-over-year growth 2024-2029 (%)
- Data Table on India - Year-over-year growth 2024-2029 (%)
- 12.14 France - Market size and forecast 2024-2029
- Chart on France - Market size and forecast 2024-2029 ($ million)
- Data Table on France - Market size and forecast 2024-2029 ($ million)
- Chart on France - Year-over-year growth 2024-2029 (%)
- Data Table on France - Year-over-year growth 2024-2029 (%)
- 12.15 Italy - Market size and forecast 2024-2029
- Chart on Italy - Market size and forecast 2024-2029 ($ million)
- Data Table on Italy - Market size and forecast 2024-2029 ($ million)
- Chart on Italy - Year-over-year growth 2024-2029 (%)
- Data Table on Italy - Year-over-year growth 2024-2029 (%)
- 12.16 South Korea - Market size and forecast 2024-2029
- Chart on South Korea - Market size and forecast 2024-2029 ($ million)
- Data Table on South Korea - Market size and forecast 2024-2029 ($ million)
- Chart on South Korea - Year-over-year growth 2024-2029 (%)
- Data Table on South Korea - Year-over-year growth 2024-2029 (%)
- 12.17 Market opportunity By Geographical Landscape
- Market opportunity By Geographical Landscape ($ million)
- Data Tables on Market opportunity By Geographical Landscape ($ million)
13 Drivers, Challenges, and Opportunity/Restraints
- 13.1 Market drivers
- 13.2 Market challenges
- 13.3 Impact of drivers and challenges
- Impact of drivers and challenges in 2024 and 2029
- 13.4 Market opportunities/restraints
14 Competitive Landscape
- 14.1 Overview
- 14.2 Competitive Landscape
- Overview on criticality of inputs and factors of differentiation
- 14.3 Landscape disruption
- Overview on factors of disruption
- 14.4 Industry risks
- Impact of key risks on business
15 Competitive Analysis
- 15.1 Companies profiled
- Companies covered
- 15.2 Company ranking index
- Company ranking index
- 15.3 Market positioning of companies
- Matrix on companies position and classification
- 15.4 Accenture PLC
- Accenture PLC - Overview
- Accenture PLC - Business segments
- Accenture PLC - Key news
- Accenture PLC - Key offerings
- Accenture PLC - Segment focus
- SWOT
- 15.5 Cognizant Technology Solutions Corp.
- Cognizant Technology Solutions Corp. - Overview
- Cognizant Technology Solutions Corp. - Business segments
- Cognizant Technology Solutions Corp. - Key news
- Cognizant Technology Solutions Corp. - Key offerings
- Cognizant Technology Solutions Corp. - Segment focus
- SWOT
- 15.6 Cotiviti Inc.
- Cotiviti Inc. - Overview
- Cotiviti Inc. - Product / Service
- Cotiviti Inc. - Key offerings
- SWOT
- 15.7 ExlService Holdings Inc.
- ExlService Holdings Inc. - Overview
- ExlService Holdings Inc. - Business segments
- ExlService Holdings Inc. - Key offerings
- ExlService Holdings Inc. - Segment focus
- SWOT
- 15.8 International Business Machines Corp.
- International Business Machines Corp. - Overview
- International Business Machines Corp. - Business segments
- International Business Machines Corp. - Key news
- International Business Machines Corp. - Key offerings
- International Business Machines Corp. - Segment focus
- SWOT
- 15.9 IQVIA Holdings Inc.
- IQVIA Holdings Inc. - Overview
- IQVIA Holdings Inc. - Business segments
- IQVIA Holdings Inc. - Key offerings
- IQVIA Holdings Inc. - Segment focus
- SWOT
- 15.10 MaxisIT Inc.
- MaxisIT Inc. - Overview
- MaxisIT Inc. - Product / Service
- MaxisIT Inc. - Key offerings
- SWOT
- 15.11 Microsoft Corp.
- Microsoft Corp. - Overview
- Microsoft Corp. - Business segments
- Microsoft Corp. - Key news
- Microsoft Corp. - Key offerings
- Microsoft Corp. - Segment focus
- SWOT
- 15.12 Oracle Corp.
- Oracle Corp. - Overview
- Oracle Corp. - Business segments
- Oracle Corp. - Key news
- Oracle Corp. - Key offerings
- Oracle Corp. - Segment focus
- SWOT
- 15.13 SAS Institute Inc.
- SAS Institute Inc. - Overview
- SAS Institute Inc. - Product / Service
- SAS Institute Inc. - Key news
- SAS Institute Inc. - Key offerings
- SWOT
- 15.14 TAKE Solutions Ltd.
- TAKE Solutions Ltd. - Overview
- TAKE Solutions Ltd. - Product / Service
- TAKE Solutions Ltd. - Key offerings
- SWOT
- 15.15 ThoughtSphere
- ThoughtSphere - Overview
- ThoughtSphere - Product / Service
- ThoughtSphere - Key offerings
- SWOT
- 15.16 United Health Group Inc.
- United Health Group Inc. - Overview
- United Health Group Inc. - Business segments
- United Health Group Inc. - Key offerings
- United Health Group Inc. - Segment focus
- SWOT
- 15.17 Veradigm LLC
- Veradigm LLC - Overview
- Veradigm LLC - Product / Service
- Veradigm LLC - Key offerings
- SWOT
- 15.18 Wipro Ltd.
- Wipro Ltd. - Overview
- Wipro Ltd. - Business segments
- Wipro Ltd. - Key news
- Wipro Ltd. - Key offerings
- Wipro Ltd. - Segment focus
- SWOT
16 Appendix
- 16.1 Scope of the report
- 16.2 Inclusions and exclusions checklist
- Inclusions checklist
- Exclusions checklist
- 16.3 Currency conversion rates for US$
- Currency conversion rates for US$
- 16.4 Research methodology
- Research methodology
- 16.5 Data procurement
- Information sources
- 16.6 Data validation
- Data validation
- 16.7 Validation techniques employed for market sizing
- Validation techniques employed for market sizing
- 16.8 Data synthesis
- Data synthesis
- 16.9 360 degree market analysis
- 360 degree market analysis
- 16.10 List of abbreviations
- List of abbreviations

