|
|
市場調査レポート
商品コード
1911214
世界の非アルコール性脂肪性肝炎(NASH)市場2026-2030年Global Non-Alcoholic Steatohepatitis (NASH) Market 2026-2030 |
||||||
|
|||||||
カスタマイズ可能
|
|||||||

| 世界の非アルコール性脂肪性肝炎(NASH)市場2026-2030年 |
|
出版日: 2026年01月14日
発行: TechNavio
ページ情報: 英文 281 Pages
納期: 即納可能
|

概要
世界の非アルコール性脂肪性肝炎(NASH)市場は、2025年から2030年の間に400億5,620万米ドルの成長が見込まれており、予測期間中のCAGRは47.1%と予測されています。
本報告書では、世界の非アルコール性脂肪性肝炎(NASH)市場について、包括的な分析、市場規模と予測、動向、成長要因、課題に加え、約25社のベンダー分析を提供しております。
本レポートは、現在の市場状況、最新の動向と促進要因、市場環境全般に関する最新の分析を提供します。市場は、肥満およびメタボリックシンドロームの有病率上昇、世界の高齢化人口の増加、診断技術の進歩によって牽引されています。
本調査は、業界の主要関係者からの情報を含む、一次情報と二次情報の客観的な組み合わせを用いて実施されました。本レポートには、主要企業の分析に加え、包括的な市場規模データ、地域別分析を伴うセグメント、ベンダー情勢が含まれています。レポートには過去データと予測データが掲載されています。
| 市場範囲 | |
|---|---|
| 基準年 | 2026年 |
| 終了年 | 2030年 |
| 予測期間 | 2026-2030 |
| 成長モメンタム | 加速 |
| 前年比2026年 | 41.3% |
| CAGR | 47.1% |
| 増分額 | 400億5,620万米ドル |
本調査では、今後数年間における非アルコール性脂肪性肝炎(NASH)の世界市場成長を牽引する主要要因の一つとして、患者様の関与と教育の向上を挙げております。また、併用療法の出現とデジタルヘルスソリューションの統合により、市場において相当な需要が見込まれます。
目次
第1章 エグゼクティブサマリー
- 市場概要
第2章 Technavio分析
- 価格・ライフサイクル・顧客購入バスケット・採用率・購入基準の分析
- インプットの重要性と差別化の要因
- 混乱の要因
- 促進要因と課題の影響
第3章 市場情勢
- 市場エコシステム
- 市場の特徴
- バリューチェーン分析
第4章 市場規模
- 市場の定義
- 市場セグメント分析
- 市場規模 2025
- 市場の見通し 2025-2030
第5章 市場規模実績
- 世界の非アルコール性脂肪性肝炎(NASH)市場 2020-2024
- 流通チャネルセグメント分析 2020-2024
- 用途別セグメント分析 2020-2024
- 製品セグメント分析 2020-2024
- 地域別セグメント分析 2020-2024
- 国別セグメント分析 2020-2024
第6章 定性分析
- AIが世界の非アルコール性脂肪性肝炎(NASH)市場
第7章 ファイブフォース分析
- ファイブフォースの要約
- 買い手の交渉力
- 供給企業の交渉力
- 新規参入業者の脅威
- 代替品の脅威
- 競争の脅威
- 市況
第8章 市場セグメンテーション:流通チャネル別
- 市場セグメント
- 比較:流通チャネル別
- オフライン:市場規模と予測 2025-2030
- オンライン:市場規模と予測 2025-2030
- 市場機会:流通チャネル別
第9章 市場セグメンテーション:用途別
- 市場セグメント
- 比較:用途別
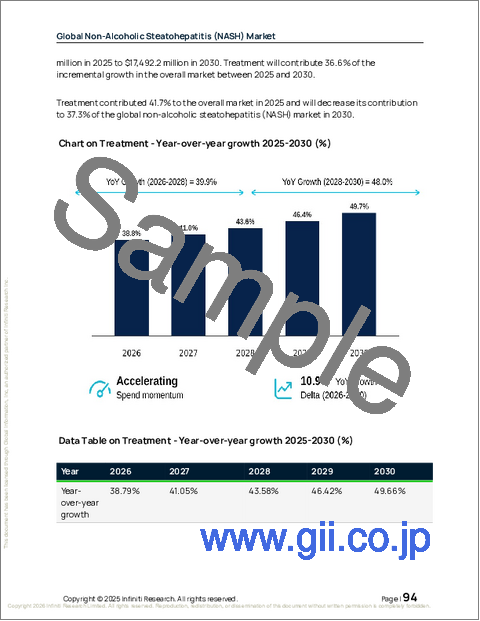
- 診断:市場規模と予測 2025-2030
- 治療:市場規模と予測 2025-2030
- 市場機会:用途別
第10章 市場セグメンテーション:製品別
- 市場セグメント
- 比較:製品別
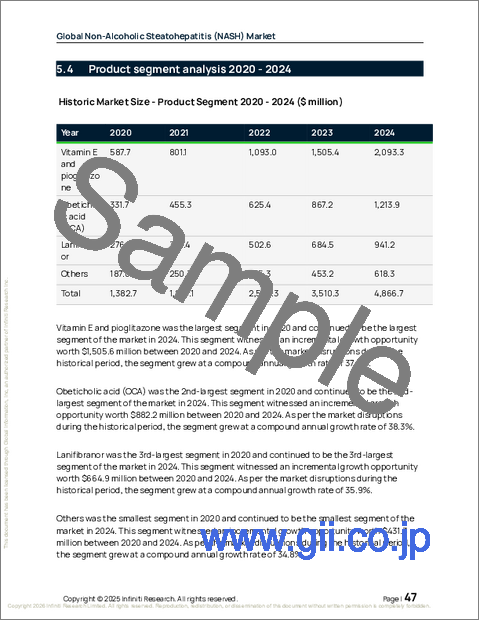
- ビタミンEおよびピオグリタゾン:市場規模と予測 2025-2030
- オベチコール酸(OCA):市場規模と予測 2025-2030
- ラニフィブラノール:市場規模と予測 2025-2030
- その他:市場規模と予測 2025-2030
- 市場機会:製品別
第11章 顧客情勢
- 顧客情勢の概要
第12章 地域別情勢
- 地域別セグメンテーション
- 地域別比較
- 北米:市場規模と予測 2025-2030
- 欧州:市場規模と予測 2025-2030
- アジア:市場規模と予測 2025-2030
- 世界のその他の地域:市場規模と予測 2025-2030
- 市場機会:地域別
第13章 促進要因、課題、および機会
- 市場促進要因
- 市場の課題
- 促進要因と課題の影響
- 市場機会
第14章 競合情勢
- 概要
- 競合情勢
- 混乱の状況
- 業界のリスク
第15章 競合分析
- 企業プロファイル
- 企業ランキング指標
- 企業の市場ポジショニング
- AbbVie Inc.
- Bristol Myers Squibb Co.
- Cirius Therapeutics
- GENFIT SA
- Gilead Sciences Inc.
- Intercept Pharmaceuticals Inc.
- Inventiva S.A.
- Madrigal Pharmaceuticals Inc.
- Merck and Co. Inc.
- Novo Nordisk AS
- Pfizer Inc.
- Prometheus Laboratories
- Siemens Healthineers AG
- Takeda Pharmaceutical Ltd.
- Zydus Lifesciences Ltd.

