|
|
市場調査レポート
商品コード
1657211
電子廃棄物リサイクルの世界市場 2025~2029年Global Electronic Waste Recycling Market 2025-2029 |
||||||

|
|||||||
カスタマイズ可能
|
|||||||


| 電子廃棄物リサイクルの世界市場 2025~2029年 |
|
出版日: 2025年02月08日
発行: TechNavio
ページ情報: 英文 230 Pages
納期: 即納可能
|

全表示
- 概要
- 目次
電子廃棄物リサイクル市場は、2024~2029年にかけて327億3,530万米ドル、予測期間中のCAGRは21.6%で成長すると予測されています。
当レポートでは、電子廃棄物リサイクル市場の全体的な分析、市場規模・予測、動向、成長促進要因、課題、約25のベンダーを網羅したベンダー分析などを掲載しています。
現在の市場シナリオ、最新動向と促進要因、市場環境全体に関する最新分析を提供しています。市場は、電子廃棄物管理に関する厳しい政府規制、世界の産業活動の増加、循環型経済イニシアチブの採用への関心の高まりによって牽引されています。
| 市場範囲 | |
|---|---|
| 基準年 | 2025年 |
| 終了年 | 2029年 |
| 予測期間 | 2025~2029年 |
| 成長モメンタム | 加速 |
| 前年比[2025年] | 16.7% |
| CAGR | 21.6% |
| 増分額 | 327億3,530万米ドル |
本調査は、産業の主要参加者からのインプットを含め、一次情報と二次情報を客観的に組み合わせて実施しました。レポートには、主要企業の分析に加え、包括的な市場規模データ、地域分析によるセグメント、ベンダー情勢が含まれています。レポートには過去データと予測データがあります。
本調査では、今後数年間の電子廃棄物リサイクル市場の成長を促進する主要理由の一つとして、市場ベンダーによるM&Aの増加を挙げています。また、e-wasteリサイクルのための処理工場の拡大や、協力につながるプログラムや会議が、市場の大きな需要につながると考えられます。
目次
第1章 エグゼクティブサマリー
- 市場概要
第2章 Technavio分析
- 価格・ライフサイクル・顧客購入バスケット・採用率・購入基準の分析
- インプットの重要性と差別化の要因
- 混乱の要因
- 促進要因と課題の影響
第3章 市場情勢
- 市場エコシステム
- 市場の特徴
- バリューチェーン分析
第4章 市場規模
- 市場の定義
- 市場セグメント分析
- 市場規模 2024年
- 市場の展望 2024~2029年
第5章 市場規模実績
- 電子廃棄物リサイクルの世界市場 2019~2023年
- 材料別セグメント分析 2019~2023年
- 供給源別セグメント分析 2019~2023年
- 方法別セグメント分析 2019~2023年
- 地域別セグメント分析 2019~2023年
- 国別セグメント分析 2019~2023年
第6章 定性分析
- AIの影響:電子廃棄物リサイクルの世界市場
第7章 ファイブフォース分析
- ファイブフォースの要約
- 買い手の交渉力
- 供給企業の交渉力
- 新規参入業者の脅威
- 代替品の脅威
- 競争の脅威
- 市況
第8章 市場セグメンテーション:材料別
- 市場セグメント
- 比較:材料別
- 金属と化学品:市場規模と予測 2024~2029年
- プラスチック:市場規模と予測 2024~2029年
- ガラス:市場規模と予測 2024~2029年
- 市場機会:材料別
第9章 市場セグメンテーション:供給源別
- 市場セグメント
- 比較:供給源別
- 民生用電子機器製品:市場規模と予測 2024~2029年
- エンターテインメントと民生用電子機器製品:市場規模と予測 2024~2029年
- ITと通信:市場規模と予測 2024~2029年
- 医療機器:市場規模と予測 2024~2029年
- その他:市場規模と予測 2024~2029年
- 市場機会:供給源別
第10章 市場セグメンテーション:方法別
- 市場セグメント
- 比較:方法別
- 機械的リサイクル:市場規模と予測 2024~2029年
- 熱分解:市場規模と予測 2024~2029年
- 埋立処分:市場規模と予測 2024~2029年
- バイオリーチング:市場規模と予測 2024~2029年
- 市場機会:方法別
第11章 顧客情勢
- 顧客情勢概要
第12章 地域別情勢
- 地域別セグメンテーション
- 比較:地域別
- 欧州:市場規模と予測 2024~2029年
- アジア太平洋:市場規模と予測 2024~2029年
- 北米:市場規模と予測 2024~2029年
- 南米:市場規模と予測 2024~2029年
- 中東・アフリカ:市場規模と予測 2024~2029年
- 中国:市場規模と予測 2024~2029年
- 米国:市場規模と予測 2024~2029年
- 日本:市場規模と予測 2024~2029年
- 英国:市場規模と予測 2024~2029年
- カナダ:市場規模と予測 2024~2029年
- フランス:市場規模と予測 2024~2029年
- インド:市場規模と予測 2024~2029年
- ブラジル:市場規模と予測 2024~2029年
- ドイツ:市場規模と予測 2024~2029年
- アラブ首長国連邦:市場規模と予測 2024~2029年
- 地域情勢による市場機会
第13章 促進要因・課題・機会・抑制要因
- 市場促進要因
- 市場課題
- 促進要因と課題の影響
- 市場機会・抑制要因
第14章 競合情勢
- 概要
- 競合情勢
- 混乱の状況
- 産業のリスク
第15章 競合分析
- 企業プロファイル
- 企業ランキング指数
- 企業の市場ポジショニング
- Aurubis AG
- Boliden Group
- CIMELIA RESOURCE RECOVERY PTE LTD.
- E Parisaraa Pvt. Ltd.
- Egyptian Electronics Recycling Co.
- Electronic Recyclers International Inc.
- Global Ewaste Solutions
- Kuusakoski Oy
- MBA Polymers Inc.
- Sembcorp Industries Ltd.
- Sims Ltd.
- Stena Metall Group
- Tetronics
- Umicore SA
- Waste Management Inc.
第16章 付録
The electronic waste recycling market is forecasted to grow by USD 32735.3 million during 2024-2029, accelerating at a CAGR of 21.6% during the forecast period. The report on the electronic waste recycling market provides a holistic analysis, market size and forecast, trends, growth drivers, and challenges, as well as vendor analysis covering around 25 vendors.
The report offers an up-to-date analysis regarding the current market scenario, the latest trends and drivers, and the overall market environment. The market is driven by stringent government regulations for e-waste management, increase in industrial activities globally, and growing focus on adoption of circular economy initiatives.
| Market Scope | |
|---|---|
| Base Year | 2025 |
| End Year | 2029 |
| Series Year | 2025-2029 |
| Growth Momentum | Accelerate |
| YOY 2025 | 16.7% |
| CAGR | 21.6% |
| Incremental Value | $32735.3 mn |
The study was conducted using an objective combination of primary and secondary information including inputs from key participants in the industry. The report contains a comprehensive market size data, segment with regional analysis and vendor landscape in addition to an analysis of the key companies. Reports have historic and forecast data.
Technavio's electronic waste recycling market is segmented as below:
By Material
- Metals and chemicals
- Plastic
- Glass
By Source
- Household appliances
- Entertainment and consumer electronics
- IT and telecom
- Medical equipment
- Others
By Method
- Mechanical recycling
- Pyrolysis
- Landfill disposal
- Bioleaching
By Geographical Landscape
- Europe
- APAC
- North America
- South America
- Middle East and Africa
This study identifies the increasing number of mergers and acquisitions by market vendors as one of the prime reasons driving the electronic waste recycling market growth during the next few years. Also, expansion of processing plants for e-waste recycling and programs and conferences leading to collaborations will lead to sizable demand in the market.
The report on the electronic waste recycling market covers the following areas:
- Electronic Waste Recycling Market sizing
- Electronic Waste Recycling Market forecast
- Electronic Waste Recycling Market industry analysis
The robust vendor analysis is designed to help clients improve their market position, and in line with this, this report provides a detailed analysis of several leading electronic waste recycling market vendors that include ALBA Group PLC and Co. KG, Aurubis AG, Boliden Group, CIMELIA RESOURCE RECOVERY PTE LTD., E Parisaraa Pvt. Ltd., Egyptian Electronics Recycling Co., Electrocycling GmbH, Electronic Recyclers International Inc., Global Ewaste Solutions, Good Point Recycling, Kuusakoski Oy, MBA Polymers Inc., Sembcorp Industries Ltd., Sims Ltd., Stena Metall Group, TES Singapore Pte Ltd., Tetronics, Umicore SA, Veolia, and Waste Management Inc.. Also, the electronic waste recycling market analysis report includes information on upcoming trends and challenges that will influence market growth. This is to help companies strategize and leverage all forthcoming growth opportunities.
The publisher presents a detailed picture of the market by the way of study, synthesis, and summation of data from multiple sources by an analysis of key parameters such as profit, pricing, competition, and promotions. It presents various market facets by identifying the key industry influencers. The data presented is comprehensive, reliable, and a result of extensive primary and secondary research. The market research reports provide a complete competitive landscape and an in-depth vendor selection methodology and analysis using qualitative and quantitative research to forecast accurate market growth.
Table of Contents
1 Executive Summary
- 1.1 Market overview
- Executive Summary - Chart on Market Overview
- Executive Summary - Data Table on Market Overview
- Executive Summary - Chart on Global Market Characteristics
- Executive Summary - Chart on Market By Geographical Landscape
- Executive Summary - Chart on Market Segmentation by Material
- Executive Summary - Chart on Market Segmentation by Source
- Executive Summary - Chart on Market Segmentation by Method
- Executive Summary - Chart on Incremental Growth
- Executive Summary - Data Table on Incremental Growth
- Executive Summary - Chart on Company Market Positioning
2 Technavio Analysis
- 2.1 Analysis of price sensitivity, lifecycle, customer purchase basket, adoption rates, and purchase criteria
- Analysis of price sensitivity, lifecycle, customer purchase basket, adoption rates, and purchase criteria
- 2.2 Criticality of inputs and Factors of differentiation
- Overview on criticality of inputs and factors of differentiation
- 2.3 Factors of disruption
- Overview on factors of disruption
- 2.4 Impact of drivers and challenges
- Impact of drivers and challenges in 2024 and 2029
3 Market Landscape
- 3.1 Market ecosystem
- Parent Market
- Data Table on - Parent Market
- 3.2 Market characteristics
- Market characteristics analysis
- 3.3 Value chain analysis
- Value chain analysis
4 Market Sizing
- 4.1 Market definition
- Offerings of companies included in the market definition
- 4.2 Market segment analysis
- Market segments
- 4.3 Market size 2024
- 4.4 Market outlook: Forecast for 2024-2029
- Chart on Global - Market size and forecast 2024-2029 ($ million)
- Data Table on Global - Market size and forecast 2024-2029 ($ million)
- Chart on Global Market: Year-over-year growth 2024-2029 (%)
- Data Table on Global Market: Year-over-year growth 2024-2029 (%)
5 Historic Market Size
- 5.1 Global Electronic Waste Recycling Market 2019 - 2023
- Historic Market Size - Data Table on Global Electronic Waste Recycling Market 2019 - 2023 ($ million)
- 5.2 Material segment analysis 2019 - 2023
- Historic Market Size - Material Segment 2019 - 2023 ($ million)
- 5.3 Source segment analysis 2019 - 2023
- Historic Market Size - Source Segment 2019 - 2023 ($ million)
- 5.4 Method segment analysis 2019 - 2023
- Historic Market Size - Method Segment 2019 - 2023 ($ million)
- 5.5 Geography segment analysis 2019 - 2023
- Historic Market Size - Geography Segment 2019 - 2023 ($ million)
- 5.6 Country segment analysis 2019 - 2023
- Historic Market Size - Country Segment 2019 - 2023 ($ million)
6 Qualitative Analysis
- 6.1 The AI impact on Global Electronic Waste Recycling Market
7 Five Forces Analysis
- 7.1 Five forces summary
- Five forces analysis - Comparison between 2024 and 2029
- 7.2 Bargaining power of buyers
- Bargaining power of buyers - Impact of key factors 2024 and 2029
- 7.3 Bargaining power of suppliers
- Bargaining power of suppliers - Impact of key factors in 2024 and 2029
- 7.4 Threat of new entrants
- Threat of new entrants - Impact of key factors in 2024 and 2029
- 7.5 Threat of substitutes
- Threat of substitutes - Impact of key factors in 2024 and 2029
- 7.6 Threat of rivalry
- Threat of rivalry - Impact of key factors in 2024 and 2029
- 7.7 Market condition
- Chart on Market condition - Five forces 2024 and 2029
8 Market Segmentation by Material
- 8.1 Market segments
- Chart on Material - Market share 2024-2029 (%)
- Data Table on Material - Market share 2024-2029 (%)
- 8.2 Comparison by Material
- Chart on Comparison by Material
- Data Table on Comparison by Material
- 8.3 Metals and chemicals - Market size and forecast 2024-2029
- Chart on Metals and chemicals - Market size and forecast 2024-2029 ($ million)
- Data Table on Metals and chemicals - Market size and forecast 2024-2029 ($ million)
- Chart on Metals and chemicals - Year-over-year growth 2024-2029 (%)
- Data Table on Metals and chemicals - Year-over-year growth 2024-2029 (%)
- 8.4 Plastic - Market size and forecast 2024-2029
- Chart on Plastic - Market size and forecast 2024-2029 ($ million)
- Data Table on Plastic - Market size and forecast 2024-2029 ($ million)
- Chart on Plastic - Year-over-year growth 2024-2029 (%)
- Data Table on Plastic - Year-over-year growth 2024-2029 (%)
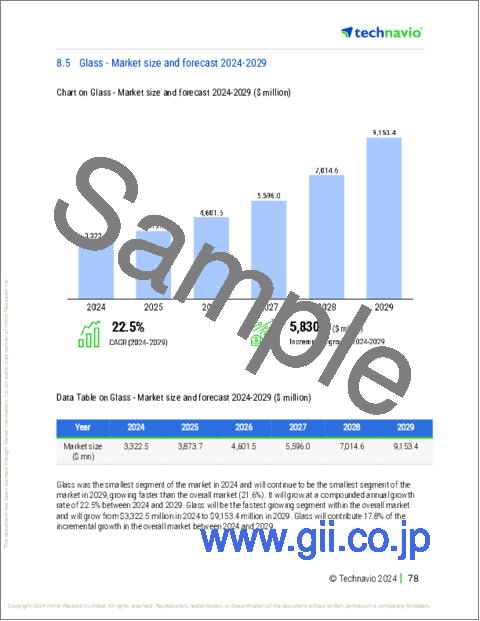
- 8.5 Glass - Market size and forecast 2024-2029
- Chart on Glass - Market size and forecast 2024-2029 ($ million)
- Data Table on Glass - Market size and forecast 2024-2029 ($ million)
- Chart on Glass - Year-over-year growth 2024-2029 (%)
- Data Table on Glass - Year-over-year growth 2024-2029 (%)
- 8.6 Market opportunity by Material
- Market opportunity by Material ($ million)
- Data Table on Market opportunity by Material ($ million)
9 Market Segmentation by Source
- 9.1 Market segments
- Chart on Source - Market share 2024-2029 (%)
- Data Table on Source - Market share 2024-2029 (%)
- 9.2 Comparison by Source
- Chart on Comparison by Source
- Data Table on Comparison by Source
- 9.3 Household appliances - Market size and forecast 2024-2029
- Chart on Household appliances - Market size and forecast 2024-2029 ($ million)
- Data Table on Household appliances - Market size and forecast 2024-2029 ($ million)
- Chart on Household appliances - Year-over-year growth 2024-2029 (%)
- Data Table on Household appliances - Year-over-year growth 2024-2029 (%)
- 9.4 Entertainment and consumer electronics - Market size and forecast 2024-2029
- Chart on Entertainment and consumer electronics - Market size and forecast 2024-2029 ($ million)
- Data Table on Entertainment and consumer electronics - Market size and forecast 2024-2029 ($ million)
- Chart on Entertainment and consumer electronics - Year-over-year growth 2024-2029 (%)
- Data Table on Entertainment and consumer electronics - Year-over-year growth 2024-2029 (%)
- 9.5 IT and telecom - Market size and forecast 2024-2029
- Chart on IT and telecom - Market size and forecast 2024-2029 ($ million)
- Data Table on IT and telecom - Market size and forecast 2024-2029 ($ million)
- Chart on IT and telecom - Year-over-year growth 2024-2029 (%)
- Data Table on IT and telecom - Year-over-year growth 2024-2029 (%)
- 9.6 Medical equipment - Market size and forecast 2024-2029
- Chart on Medical equipment - Market size and forecast 2024-2029 ($ million)
- Data Table on Medical equipment - Market size and forecast 2024-2029 ($ million)
- Chart on Medical equipment - Year-over-year growth 2024-2029 (%)
- Data Table on Medical equipment - Year-over-year growth 2024-2029 (%)
- 9.7 Others - Market size and forecast 2024-2029
- Chart on Others - Market size and forecast 2024-2029 ($ million)
- Data Table on Others - Market size and forecast 2024-2029 ($ million)
- Chart on Others - Year-over-year growth 2024-2029 (%)
- Data Table on Others - Year-over-year growth 2024-2029 (%)
- 9.8 Market opportunity by Source
- Market opportunity by Source ($ million)
- Data Table on Market opportunity by Source ($ million)
10 Market Segmentation by Method
- 10.1 Market segments
- Chart on Method - Market share 2024-2029 (%)
- Data Table on Method - Market share 2024-2029 (%)
- 10.2 Comparison by Method
- Chart on Comparison by Method
- Data Table on Comparison by Method
- 10.3 Mechanical recycling - Market size and forecast 2024-2029
- Chart on Mechanical recycling - Market size and forecast 2024-2029 ($ million)
- Data Table on Mechanical recycling - Market size and forecast 2024-2029 ($ million)
- Chart on Mechanical recycling - Year-over-year growth 2024-2029 (%)
- Data Table on Mechanical recycling - Year-over-year growth 2024-2029 (%)
- 10.4 Pyrolysis - Market size and forecast 2024-2029
- Chart on Pyrolysis - Market size and forecast 2024-2029 ($ million)
- Data Table on Pyrolysis - Market size and forecast 2024-2029 ($ million)
- Chart on Pyrolysis - Year-over-year growth 2024-2029 (%)
- Data Table on Pyrolysis - Year-over-year growth 2024-2029 (%)
- 10.5 Landfill disposal - Market size and forecast 2024-2029
- Chart on Landfill disposal - Market size and forecast 2024-2029 ($ million)
- Data Table on Landfill disposal - Market size and forecast 2024-2029 ($ million)
- Chart on Landfill disposal - Year-over-year growth 2024-2029 (%)
- Data Table on Landfill disposal - Year-over-year growth 2024-2029 (%)
- 10.6 Bioleaching - Market size and forecast 2024-2029
- Chart on Bioleaching - Market size and forecast 2024-2029 ($ million)
- Data Table on Bioleaching - Market size and forecast 2024-2029 ($ million)
- Chart on Bioleaching - Year-over-year growth 2024-2029 (%)
- Data Table on Bioleaching - Year-over-year growth 2024-2029 (%)
- 10.7 Market opportunity by Method
- Market opportunity by Method ($ million)
- Data Table on Market opportunity by Method ($ million)
11 Customer Landscape
- 11.1 Customer landscape overview
- Analysis of price sensitivity, lifecycle, customer purchase basket, adoption rates, and purchase criteria
12 Geographic Landscape
- 12.1 Geographic segmentation
- Chart on Market share By Geographical Landscape 2024-2029 (%)
- Data Table on Market share By Geographical Landscape 2024-2029 (%)
- 12.2 Geographic comparison
- Chart on Geographic comparison
- Data Table on Geographic comparison
- 12.3 Europe - Market size and forecast 2024-2029
- Chart on Europe - Market size and forecast 2024-2029 ($ million)
- Data Table on Europe - Market size and forecast 2024-2029 ($ million)
- Chart on Europe - Year-over-year growth 2024-2029 (%)
- Data Table on Europe - Year-over-year growth 2024-2029 (%)
- 12.4 APAC - Market size and forecast 2024-2029
- Chart on APAC - Market size and forecast 2024-2029 ($ million)
- Data Table on APAC - Market size and forecast 2024-2029 ($ million)
- Chart on APAC - Year-over-year growth 2024-2029 (%)
- Data Table on APAC - Year-over-year growth 2024-2029 (%)
- 12.5 North America - Market size and forecast 2024-2029
- Chart on North America - Market size and forecast 2024-2029 ($ million)
- Data Table on North America - Market size and forecast 2024-2029 ($ million)
- Chart on North America - Year-over-year growth 2024-2029 (%)
- Data Table on North America - Year-over-year growth 2024-2029 (%)
- 12.6 South America - Market size and forecast 2024-2029
- Chart on South America - Market size and forecast 2024-2029 ($ million)
- Data Table on South America - Market size and forecast 2024-2029 ($ million)
- Chart on South America - Year-over-year growth 2024-2029 (%)
- Data Table on South America - Year-over-year growth 2024-2029 (%)
- 12.7 Middle East and Africa - Market size and forecast 2024-2029
- Chart on Middle East and Africa - Market size and forecast 2024-2029 ($ million)
- Data Table on Middle East and Africa - Market size and forecast 2024-2029 ($ million)
- Chart on Middle East and Africa - Year-over-year growth 2024-2029 (%)
- Data Table on Middle East and Africa - Year-over-year growth 2024-2029 (%)
- 12.8 China - Market size and forecast 2024-2029
- Chart on China - Market size and forecast 2024-2029 ($ million)
- Data Table on China - Market size and forecast 2024-2029 ($ million)
- Chart on China - Year-over-year growth 2024-2029 (%)
- Data Table on China - Year-over-year growth 2024-2029 (%)
- 12.9 US - Market size and forecast 2024-2029
- Chart on US - Market size and forecast 2024-2029 ($ million)
- Data Table on US - Market size and forecast 2024-2029 ($ million)
- Chart on US - Year-over-year growth 2024-2029 (%)
- Data Table on US - Year-over-year growth 2024-2029 (%)
- 12.10 Japan - Market size and forecast 2024-2029
- Chart on Japan - Market size and forecast 2024-2029 ($ million)
- Data Table on Japan - Market size and forecast 2024-2029 ($ million)
- Chart on Japan - Year-over-year growth 2024-2029 (%)
- Data Table on Japan - Year-over-year growth 2024-2029 (%)
- 12.11 UK - Market size and forecast 2024-2029
- Chart on UK - Market size and forecast 2024-2029 ($ million)
- Data Table on UK - Market size and forecast 2024-2029 ($ million)
- Chart on UK - Year-over-year growth 2024-2029 (%)
- Data Table on UK - Year-over-year growth 2024-2029 (%)
- 12.12 Canada - Market size and forecast 2024-2029
- Chart on Canada - Market size and forecast 2024-2029 ($ million)
- Data Table on Canada - Market size and forecast 2024-2029 ($ million)
- Chart on Canada - Year-over-year growth 2024-2029 (%)
- Data Table on Canada - Year-over-year growth 2024-2029 (%)
- 12.13 France - Market size and forecast 2024-2029
- Chart on France - Market size and forecast 2024-2029 ($ million)
- Data Table on France - Market size and forecast 2024-2029 ($ million)
- Chart on France - Year-over-year growth 2024-2029 (%)
- Data Table on France - Year-over-year growth 2024-2029 (%)
- 12.14 India - Market size and forecast 2024-2029
- Chart on India - Market size and forecast 2024-2029 ($ million)
- Data Table on India - Market size and forecast 2024-2029 ($ million)
- Chart on India - Year-over-year growth 2024-2029 (%)
- Data Table on India - Year-over-year growth 2024-2029 (%)
- 12.15 Brazil - Market size and forecast 2024-2029
- Chart on Brazil - Market size and forecast 2024-2029 ($ million)
- Data Table on Brazil - Market size and forecast 2024-2029 ($ million)
- Chart on Brazil - Year-over-year growth 2024-2029 (%)
- Data Table on Brazil - Year-over-year growth 2024-2029 (%)
- 12.16 Germany - Market size and forecast 2024-2029
- Chart on Germany - Market size and forecast 2024-2029 ($ million)
- Data Table on Germany - Market size and forecast 2024-2029 ($ million)
- Chart on Germany - Year-over-year growth 2024-2029 (%)
- Data Table on Germany - Year-over-year growth 2024-2029 (%)
- 12.17 UAE - Market size and forecast 2024-2029
- Chart on UAE - Market size and forecast 2024-2029 ($ million)
- Data Table on UAE - Market size and forecast 2024-2029 ($ million)
- Chart on UAE - Year-over-year growth 2024-2029 (%)
- Data Table on UAE - Year-over-year growth 2024-2029 (%)
- 12.18 Market opportunity By Geographical Landscape
- Market opportunity By Geographical Landscape ($ million)
- Data Tables on Market opportunity By Geographical Landscape ($ million)
13 Drivers, Challenges, and Opportunity/Restraints
- 13.1 Market drivers
- 13.2 Market challenges
- 13.3 Impact of drivers and challenges
- Impact of drivers and challenges in 2024 and 2029
- 13.4 Market opportunities/restraints
14 Competitive Landscape
- 14.1 Overview
- 14.2 Competitive Landscape
- Overview on criticality of inputs and factors of differentiation
- 14.3 Landscape disruption
- Overview on factors of disruption
- 14.4 Industry risks
- Impact of key risks on business
15 Competitive Analysis
- 15.1 Companies profiled
- Companies covered
- 15.2 Company ranking index
- Company ranking index
- 15.3 Market positioning of companies
- Matrix on companies position and classification
- 15.4 Aurubis AG
- Aurubis AG - Overview
- Aurubis AG - Business segments
- Aurubis AG - Key news
- Aurubis AG - Key offerings
- Aurubis AG - Segment focus
- SWOT
- 15.5 Boliden Group
- Boliden Group - Overview
- Boliden Group - Product / Service
- Boliden Group - Key offerings
- SWOT
- 15.6 CIMELIA RESOURCE RECOVERY PTE LTD.
- CIMELIA RESOURCE RECOVERY PTE LTD. - Overview
- CIMELIA RESOURCE RECOVERY PTE LTD. - Product / Service
- CIMELIA RESOURCE RECOVERY PTE LTD. - Key offerings
- SWOT
- 15.7 E Parisaraa Pvt. Ltd.
- E Parisaraa Pvt. Ltd. - Overview
- E Parisaraa Pvt. Ltd. - Product / Service
- E Parisaraa Pvt. Ltd. - Key offerings
- SWOT
- 15.8 Egyptian Electronics Recycling Co.
- Egyptian Electronics Recycling Co. - Overview
- Egyptian Electronics Recycling Co. - Product / Service
- Egyptian Electronics Recycling Co. - Key offerings
- SWOT
- 15.9 Electronic Recyclers International Inc.
- Electronic Recyclers International Inc. - Overview
- Electronic Recyclers International Inc. - Product / Service
- Electronic Recyclers International Inc. - Key offerings
- SWOT
- 15.10 Global Ewaste Solutions
- Global Ewaste Solutions - Overview
- Global Ewaste Solutions - Product / Service
- Global Ewaste Solutions - Key offerings
- SWOT
- 15.11 Kuusakoski Oy
- Kuusakoski Oy - Overview
- Kuusakoski Oy - Business segments
- Kuusakoski Oy - Key offerings
- Kuusakoski Oy - Segment focus
- SWOT
- 15.12 MBA Polymers Inc.
- MBA Polymers Inc. - Overview
- MBA Polymers Inc. - Product / Service
- MBA Polymers Inc. - Key news
- MBA Polymers Inc. - Key offerings
- SWOT
- 15.13 Sembcorp Industries Ltd.
- Sembcorp Industries Ltd. - Overview
- Sembcorp Industries Ltd. - Product / Service
- Sembcorp Industries Ltd. - Key offerings
- SWOT
- 15.14 Sims Ltd.
- Sims Ltd. - Overview
- Sims Ltd. - Business segments
- Sims Ltd. - Key news
- Sims Ltd. - Key offerings
- Sims Ltd. - Segment focus
- SWOT
- 15.15 Stena Metall Group
- Stena Metall Group - Overview
- Stena Metall Group - Product / Service
- Stena Metall Group - Key offerings
- SWOT
- 15.16 Tetronics
- Tetronics - Overview
- Tetronics - Product / Service
- Tetronics - Key offerings
- SWOT
- 15.17 Umicore SA
- Umicore SA - Overview
- Umicore SA - Business segments
- Umicore SA - Key news
- Umicore SA - Key offerings
- Umicore SA - Segment focus
- SWOT
- 15.18 Waste Management Inc.
- Waste Management Inc. - Overview
- Waste Management Inc. - Business segments
- Waste Management Inc. - Key news
- Waste Management Inc. - Key offerings
- Waste Management Inc. - Segment focus
- SWOT
16 Appendix
- 16.1 Scope of the report
- 16.2 Inclusions and exclusions checklist
- Inclusions checklist
- Exclusions checklist
- 16.3 Currency conversion rates for US$
- Currency conversion rates for US$
- 16.4 Research methodology
- Research methodology
- 16.5 Data procurement
- Information sources
- 16.6 Data validation
- Data validation
- 16.7 Validation techniques employed for market sizing
- Validation techniques employed for market sizing
- 16.8 Data synthesis
- Data synthesis
- 16.9 360 degree market analysis
- 360 degree market analysis
- 16.10 List of abbreviations
- List of abbreviations

