|
|
市場調査レポート
商品コード
1693104
女性用個人用保護具(PPE)の世界市場 2025~2029年Global Personal Protective Equipment (PPE) Market for Women 2025-2029 |
||||||

|
|||||||
カスタマイズ可能
|
|||||||


| 女性用個人用保護具(PPE)の世界市場 2025~2029年 |
|
出版日: 2025年03月20日
発行: TechNavio
ページ情報: 英文 220 Pages
納期: 即納可能
|

全表示
- 概要
- 図表
- 目次
女性用個人用保護具(PPE)は2024-2029年に142億9,290万米ドル、予測期間中のCAGRは11.1%で成長すると予測されています。
当レポートでは、女性用個人用保護具(PPE)の全体的な分析、市場規模・予測、動向、成長促進要因、課題、約25のベンダーを網羅したベンダー分析などを掲載しています。
現在の市場シナリオ、最新動向と促進要因、市場環境全体に関する最新分析を提供しています。市場は、感染性の生物学的危険の発生率および蔓延率の増加、労働集約型産業における女性の身体的傷害のリスク、厳格な労働安全規制によって牽引されています。
| 市場範囲 | |
|---|---|
| 基準年 | 2025 |
| 終了年 | 2029 |
| 予測期間 | 2025-2029 |
| 成長モメンタム | 加速 |
| 前年比2025年 | 8.9% |
| CAGR | 11.1% |
| 増分額 | 142億9,290万米ドル |
本調査は、業界の主要参加者からのインプットを含め、一次情報と二次情報を客観的に組み合わせて実施しました。レポートには、主要企業の分析に加え、包括的な市場規模データ、地域別分析によるセグメント、ベンダー情勢が含まれています。レポートには過去データと予測データがあります。
本調査では、今後数年間の女性用個人用保護具(PPE)の成長を促進する主な要因の1つとして、小売店やオンラインチャネルを通じた流通の拡大を挙げています。また、女性用PPEにおける抗菌技術の統合と技術的進歩への注力は、市場の大きな需要につながります。
目次
第1章 エグゼクティブサマリー
- 市場概要
第2章 Technavio分析
- 価格・ライフサイクル・顧客購入バスケット・採用率・購入基準の分析
- インプットの重要性と差別化の要因
- 混乱の要因
- 促進要因と課題の影響
第3章 市場情勢
- 市場エコシステム
- 市場の特徴
- バリューチェーン分析
第4章 市場規模
- 市場の定義
- 市場セグメント分析
- 市場規模 2024
- 市場の見通し 2024-2029
第5章 市場規模実績
- 女性用個人用保護具(PPE)の世界市場 2019-2023
- エンドユーザー別セグメント分析 2019-2023
- 製品別セグメント分析 2019-2023
- 地域別セグメント分析 2019-2023
- 国別セグメント分析 2019-2023
第6章 定性分析
- AIの影響:女性用個人用保護具(PPE)の世界市場
第7章 ファイブフォース分析
- ファイブフォースの要約
- 買い手の交渉力
- 供給企業の交渉力
- 新規参入業者の脅威
- 代替品の脅威
- 競争の脅威
- 市況
第8章 市場セグメンテーション:エンドユーザー別
- 市場セグメント
- 比較:エンドユーザー別
- ヘルスケア:市場規模と予測 2024-2029
- 製造業:市場規模と予測 2024-2029
- 建設:市場規模と予測 2024-2029
- 石油・ガス:市場規模と予測 2024-2029
- その他:市場規模と予測 2024-2029
- 市場機会:エンドユーザー別
第9章 市場セグメンテーション:製品別
- 市場セグメント
- 比較:製品別
- 防護服:市場規模と予測 2024-2029
- 手と腕の保護:市場規模と予測 2024-2029
- 保護靴:市場規模と予測 2024-2029
- 呼吸器の保護:市場規模と予測 2024-2029
- その他:市場規模と予測 2024-2029
- 市場機会:製品別
第10章 顧客情勢
- 顧客情勢の概要
第11章 地域別情勢
- 地域別セグメンテーション
- 地域別比較
- 北米:市場規模と予測 2024-2029
- 欧州:市場規模と予測 2024-2029
- アジア太平洋:市場規模と予測 2024-2029
- 中東・アフリカ:市場規模と予測 2024-2029
- 南米:市場規模と予測 2024-2029
- 米国:市場規模と予測 2024-2029
- 中国:市場規模と予測 2024-2029
- 英国:市場規模と予測 2024-2029
- カナダ:市場規模と予測 2024-2029
- ドイツ:市場規模と予測 2024-2029
- 日本:市場規模と予測 2024-2029
- インド:市場規模と予測 2024-2029
- フランス:市場規模と予測 2024-2029
- イタリア:市場規模と予測 2024-2029
- オランダ:市場規模と予測 2024-2029
- 市場機会:地域情勢別
第12章 促進要因・課題・機会・抑制要因
- 市場促進要因
- 市場の課題
- 促進要因と課題の影響
- 市場の機会・抑制要因
第13章 競合情勢
- 概要
- 競合情勢
- 混乱の状況
- 業界のリスク
第14章 競合分析
- 企業プロファイル
- 企業ランキング指数
- 企業の市場ポジショニング
- Ansell Ltd.
- Biffa Plc
- Bullard
- Bunzl Plc
- COFRA Srl
- Delta Plus Group
- DuPont de Nemours Inc.
- Gateway Safety Inc.
- GVS S.p.A.
- MSA Safety Inc.
- Protective Industrial Products Inc.
- Skanska AB
- Synergy Group
- UVEX WINTER HOLDING GmbH and Co. KG
第15章 付録
Exhibits:
- Exhibits1: Executive Summary - Chart on Market Overview
- Exhibits2: Executive Summary - Data Table on Market Overview
- Exhibits3: Executive Summary - Chart on Global Market Characteristics
- Exhibits4: Executive Summary - Chart on Market By Geographical Landscape
- Exhibits5: Executive Summary - Chart on Market Segmentation by End-user
- Exhibits6: Executive Summary - Chart on Market Segmentation by Product
- Exhibits7: Executive Summary - Chart on Incremental Growth
- Exhibits8: Executive Summary - Data Table on Incremental Growth
- Exhibits9: Executive Summary - Chart on Company Market Positioning
- Exhibits10: Analysis of price sensitivity, lifecycle, customer purchase basket, adoption rates, and purchase criteria
- Exhibits11: Overview on criticality of inputs and factors of differentiation
- Exhibits12: Overview on factors of disruption
- Exhibits13: Impact of drivers and challenges in 2024 and 2029
- Exhibits14: Parent Market
- Exhibits15: Data Table on - Parent Market
- Exhibits16: Market characteristics analysis
- Exhibits17: Value chain analysis
- Exhibits18: Offerings of companies included in the market definition
- Exhibits19: Market segments
- Exhibits20: Chart on Global - Market size and forecast 2024-2029 ($ million)
- Exhibits21: Data Table on Global - Market size and forecast 2024-2029 ($ million)
- Exhibits22: Chart on Global Market: Year-over-year growth 2024-2029 (%)
- Exhibits23: Data Table on Global Market: Year-over-year growth 2024-2029 (%)
- Exhibits24: Historic Market Size - Data Table on Global Personal Protective Equipment (PPE) Market For Women 2019 - 2023 ($ million)
- Exhibits25: Historic Market Size - End-user Segment 2019 - 2023 ($ million)
- Exhibits26: Historic Market Size - Product Segment 2019 - 2023 ($ million)
- Exhibits27: Historic Market Size - Geography Segment 2019 - 2023 ($ million)
- Exhibits28: Historic Market Size - Country Segment 2019 - 2023 ($ million)
- Exhibits29: Five forces analysis - Comparison between 2024 and 2029
- Exhibits30: Bargaining power of buyers - Impact of key factors 2024 and 2029
- Exhibits31: Bargaining power of suppliers - Impact of key factors in 2024 and 2029
- Exhibits32: Threat of new entrants - Impact of key factors in 2024 and 2029
- Exhibits33: Threat of substitutes - Impact of key factors in 2024 and 2029
- Exhibits34: Threat of rivalry - Impact of key factors in 2024 and 2029
- Exhibits35: Chart on Market condition - Five forces 2024 and 2029
- Exhibits36: Chart on End-user - Market share 2024-2029 (%)
- Exhibits37: Data Table on End-user - Market share 2024-2029 (%)
- Exhibits38: Chart on Comparison by End-user
- Exhibits39: Data Table on Comparison by End-user
- Exhibits40: Chart on Healthcare - Market size and forecast 2024-2029 ($ million)
- Exhibits41: Data Table on Healthcare - Market size and forecast 2024-2029 ($ million)
- Exhibits42: Chart on Healthcare - Year-over-year growth 2024-2029 (%)
- Exhibits43: Data Table on Healthcare - Year-over-year growth 2024-2029 (%)
- Exhibits44: Chart on Manufacturing - Market size and forecast 2024-2029 ($ million)
- Exhibits45: Data Table on Manufacturing - Market size and forecast 2024-2029 ($ million)
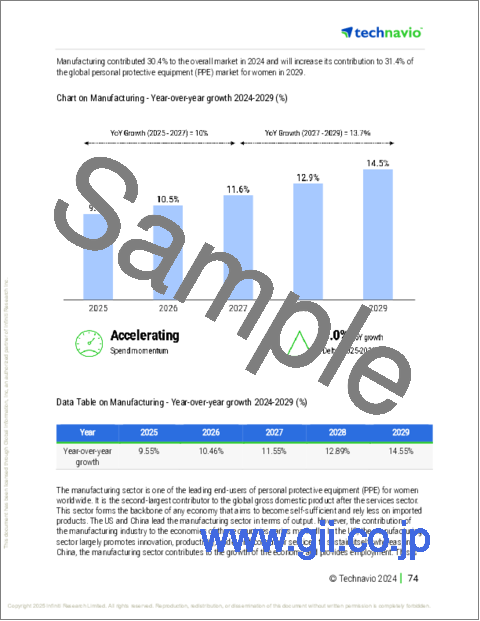
- Exhibits46: Chart on Manufacturing - Year-over-year growth 2024-2029 (%)
- Exhibits47: Data Table on Manufacturing - Year-over-year growth 2024-2029 (%)
- Exhibits48: Chart on Construction - Market size and forecast 2024-2029 ($ million)
- Exhibits49: Data Table on Construction - Market size and forecast 2024-2029 ($ million)
- Exhibits50: Chart on Construction - Year-over-year growth 2024-2029 (%)
- Exhibits51: Data Table on Construction - Year-over-year growth 2024-2029 (%)
- Exhibits52: Chart on Oil and gas - Market size and forecast 2024-2029 ($ million)
- Exhibits53: Data Table on Oil and gas - Market size and forecast 2024-2029 ($ million)
- Exhibits54: Chart on Oil and gas - Year-over-year growth 2024-2029 (%)
- Exhibits55: Data Table on Oil and gas - Year-over-year growth 2024-2029 (%)
- Exhibits56: Chart on Others - Market size and forecast 2024-2029 ($ million)
- Exhibits57: Data Table on Others - Market size and forecast 2024-2029 ($ million)
- Exhibits58: Chart on Others - Year-over-year growth 2024-2029 (%)
- Exhibits59: Data Table on Others - Year-over-year growth 2024-2029 (%)
- Exhibits60: Market opportunity by End-user ($ million)
- Exhibits61: Data Table on Market opportunity by End-user ($ million)
- Exhibits62: Chart on Product - Market share 2024-2029 (%)
- Exhibits63: Data Table on Product - Market share 2024-2029 (%)
- Exhibits64: Chart on Comparison by Product
- Exhibits65: Data Table on Comparison by Product
- Exhibits66: Chart on Protective clothing - Market size and forecast 2024-2029 ($ million)
- Exhibits67: Data Table on Protective clothing - Market size and forecast 2024-2029 ($ million)
- Exhibits68: Chart on Protective clothing - Year-over-year growth 2024-2029 (%)
- Exhibits69: Data Table on Protective clothing - Year-over-year growth 2024-2029 (%)
- Exhibits70: Chart on Hand and arm protection - Market size and forecast 2024-2029 ($ million)
- Exhibits71: Data Table on Hand and arm protection - Market size and forecast 2024-2029 ($ million)
- Exhibits72: Chart on Hand and arm protection - Year-over-year growth 2024-2029 (%)
- Exhibits73: Data Table on Hand and arm protection - Year-over-year growth 2024-2029 (%)
- Exhibits74: Chart on Protective footwear - Market size and forecast 2024-2029 ($ million)
- Exhibits75: Data Table on Protective footwear - Market size and forecast 2024-2029 ($ million)
- Exhibits76: Chart on Protective footwear - Year-over-year growth 2024-2029 (%)
- Exhibits77: Data Table on Protective footwear - Year-over-year growth 2024-2029 (%)
- Exhibits78: Chart on Respiratory protection - Market size and forecast 2024-2029 ($ million)
- Exhibits79: Data Table on Respiratory protection - Market size and forecast 2024-2029 ($ million)
- Exhibits80: Chart on Respiratory protection - Year-over-year growth 2024-2029 (%)
- Exhibits81: Data Table on Respiratory protection - Year-over-year growth 2024-2029 (%)
- Exhibits82: Chart on Others - Market size and forecast 2024-2029 ($ million)
- Exhibits83: Data Table on Others - Market size and forecast 2024-2029 ($ million)
- Exhibits84: Chart on Others - Year-over-year growth 2024-2029 (%)
- Exhibits85: Data Table on Others - Year-over-year growth 2024-2029 (%)
- Exhibits86: Market opportunity by Product ($ million)
- Exhibits87: Data Table on Market opportunity by Product ($ million)
- Exhibits88: Analysis of price sensitivity, lifecycle, customer purchase basket, adoption rates, and purchase criteria
- Exhibits89: Chart on Market share By Geographical Landscape 2024-2029 (%)
- Exhibits90: Data Table on Market share By Geographical Landscape 2024-2029 (%)
- Exhibits91: Chart on Geographic comparison
- Exhibits92: Data Table on Geographic comparison
- Exhibits93: Chart on North America - Market size and forecast 2024-2029 ($ million)
- Exhibits94: Data Table on North America - Market size and forecast 2024-2029 ($ million)
- Exhibits95: Chart on North America - Year-over-year growth 2024-2029 (%)
- Exhibits96: Data Table on North America - Year-over-year growth 2024-2029 (%)
- Exhibits97: Chart on Europe - Market size and forecast 2024-2029 ($ million)
- Exhibits98: Data Table on Europe - Market size and forecast 2024-2029 ($ million)
- Exhibits99: Chart on Europe - Year-over-year growth 2024-2029 (%)
- Exhibits100: Data Table on Europe - Year-over-year growth 2024-2029 (%)
- Exhibits101: Chart on APAC - Market size and forecast 2024-2029 ($ million)
- Exhibits102: Data Table on APAC - Market size and forecast 2024-2029 ($ million)
- Exhibits103: Chart on APAC - Year-over-year growth 2024-2029 (%)
- Exhibits104: Data Table on APAC - Year-over-year growth 2024-2029 (%)
- Exhibits105: Chart on Middle East and Africa - Market size and forecast 2024-2029 ($ million)
- Exhibits106: Data Table on Middle East and Africa - Market size and forecast 2024-2029 ($ million)
- Exhibits107: Chart on Middle East and Africa - Year-over-year growth 2024-2029 (%)
- Exhibits108: Data Table on Middle East and Africa - Year-over-year growth 2024-2029 (%)
- Exhibits109: Chart on South America - Market size and forecast 2024-2029 ($ million)
- Exhibits110: Data Table on South America - Market size and forecast 2024-2029 ($ million)
- Exhibits111: Chart on South America - Year-over-year growth 2024-2029 (%)
- Exhibits112: Data Table on South America - Year-over-year growth 2024-2029 (%)
- Exhibits113: Chart on US - Market size and forecast 2024-2029 ($ million)
- Exhibits114: Data Table on US - Market size and forecast 2024-2029 ($ million)
- Exhibits115: Chart on US - Year-over-year growth 2024-2029 (%)
- Exhibits116: Data Table on US - Year-over-year growth 2024-2029 (%)
- Exhibits117: Chart on China - Market size and forecast 2024-2029 ($ million)
- Exhibits118: Data Table on China - Market size and forecast 2024-2029 ($ million)
- Exhibits119: Chart on China - Year-over-year growth 2024-2029 (%)
- Exhibits120: Data Table on China - Year-over-year growth 2024-2029 (%)
- Exhibits121: Chart on UK - Market size and forecast 2024-2029 ($ million)
- Exhibits122: Data Table on UK - Market size and forecast 2024-2029 ($ million)
- Exhibits123: Chart on UK - Year-over-year growth 2024-2029 (%)
- Exhibits124: Data Table on UK - Year-over-year growth 2024-2029 (%)
- Exhibits125: Chart on Canada - Market size and forecast 2024-2029 ($ million)
- Exhibits126: Data Table on Canada - Market size and forecast 2024-2029 ($ million)
- Exhibits127: Chart on Canada - Year-over-year growth 2024-2029 (%)
- Exhibits128: Data Table on Canada - Year-over-year growth 2024-2029 (%)
- Exhibits129: Chart on Germany - Market size and forecast 2024-2029 ($ million)
- Exhibits130: Data Table on Germany - Market size and forecast 2024-2029 ($ million)
- Exhibits131: Chart on Germany - Year-over-year growth 2024-2029 (%)
- Exhibits132: Data Table on Germany - Year-over-year growth 2024-2029 (%)
- Exhibits133: Chart on Japan - Market size and forecast 2024-2029 ($ million)
- Exhibits134: Data Table on Japan - Market size and forecast 2024-2029 ($ million)
- Exhibits135: Chart on Japan - Year-over-year growth 2024-2029 (%)
- Exhibits136: Data Table on Japan - Year-over-year growth 2024-2029 (%)
- Exhibits137: Chart on India - Market size and forecast 2024-2029 ($ million)
- Exhibits138: Data Table on India - Market size and forecast 2024-2029 ($ million)
- Exhibits139: Chart on India - Year-over-year growth 2024-2029 (%)
- Exhibits140: Data Table on India - Year-over-year growth 2024-2029 (%)
- Exhibits141: Chart on France - Market size and forecast 2024-2029 ($ million)
- Exhibits142: Data Table on France - Market size and forecast 2024-2029 ($ million)
- Exhibits143: Chart on France - Year-over-year growth 2024-2029 (%)
- Exhibits144: Data Table on France - Year-over-year growth 2024-2029 (%)
- Exhibits145: Chart on Italy - Market size and forecast 2024-2029 ($ million)
- Exhibits146: Data Table on Italy - Market size and forecast 2024-2029 ($ million)
- Exhibits147: Chart on Italy - Year-over-year growth 2024-2029 (%)
- Exhibits148: Data Table on Italy - Year-over-year growth 2024-2029 (%)
- Exhibits149: Chart on The Netherlands - Market size and forecast 2024-2029 ($ million)
- Exhibits150: Data Table on The Netherlands - Market size and forecast 2024-2029 ($ million)
- Exhibits151: Chart on The Netherlands - Year-over-year growth 2024-2029 (%)
- Exhibits152: Data Table on The Netherlands - Year-over-year growth 2024-2029 (%)
- Exhibits153: Market opportunity By Geographical Landscape ($ million)
- Exhibits154: Data Tables on Market opportunity By Geographical Landscape ($ million)
- Exhibits155: Impact of drivers and challenges in 2024 and 2029
- Exhibits156: Overview on criticality of inputs and factors of differentiation
- Exhibits157: Overview on factors of disruption
- Exhibits158: Impact of key risks on business
- Exhibits159: Companies covered
- Exhibits160: Company ranking index
- Exhibits161: Matrix on companies position and classification
- Exhibits162: 3M Co. - Overview
- Exhibits163: 3M Co. - Business segments
- Exhibits164: 3M Co. - Key news
- Exhibits165: 3M Co. - Key offerings
- Exhibits166: 3M Co. - Segment focus
- Exhibits167: SWOT
- Exhibits168: Ansell Ltd. - Overview
- Exhibits169: Ansell Ltd. - Business segments
- Exhibits170: Ansell Ltd. - Key news
- Exhibits171: Ansell Ltd. - Key offerings
- Exhibits172: Ansell Ltd. - Segment focus
- Exhibits173: SWOT
- Exhibits174: Biffa Plc - Overview
- Exhibits175: Biffa Plc - Product / Service
- Exhibits176: Biffa Plc - Key offerings
- Exhibits177: SWOT
- Exhibits178: Bullard - Overview
- Exhibits179: Bullard - Product / Service
- Exhibits180: Bullard - Key offerings
- Exhibits181: SWOT
- Exhibits182: Bunzl Plc - Overview
- Exhibits183: Bunzl Plc - Business segments
- Exhibits184: Bunzl Plc - Key news
- Exhibits185: Bunzl Plc - Key offerings
- Exhibits186: Bunzl Plc - Segment focus
- Exhibits187: SWOT
- Exhibits188: COFRA Srl - Overview
- Exhibits189: COFRA Srl - Product / Service
- Exhibits190: COFRA Srl - Key offerings
- Exhibits191: SWOT
- Exhibits192: Delta Plus Group - Overview
- Exhibits193: Delta Plus Group - Business segments
- Exhibits194: Delta Plus Group - Key offerings
- Exhibits195: Delta Plus Group - Segment focus
- Exhibits196: SWOT
- Exhibits197: DuPont de Nemours Inc. - Overview
- Exhibits198: DuPont de Nemours Inc. - Business segments
- Exhibits199: DuPont de Nemours Inc. - Key news
- Exhibits200: DuPont de Nemours Inc. - Key offerings
- Exhibits201: DuPont de Nemours Inc. - Segment focus
- Exhibits202: SWOT
- Exhibits203: Gateway Safety Inc. - Overview
- Exhibits204: Gateway Safety Inc. - Product / Service
- Exhibits205: Gateway Safety Inc. - Key offerings
- Exhibits206: SWOT
- Exhibits207: GVS S.p.A. - Overview
- Exhibits208: GVS S.p.A. - Product / Service
- Exhibits209: GVS S.p.A. - Key offerings
- Exhibits210: SWOT
- Exhibits211: MSA Safety Inc. - Overview
- Exhibits212: MSA Safety Inc. - Business segments
- Exhibits213: MSA Safety Inc. - Key offerings
- Exhibits214: MSA Safety Inc. - Segment focus
- Exhibits215: SWOT
- Exhibits216: Protective Industrial Products Inc. - Overview
- Exhibits217: Protective Industrial Products Inc. - Product / Service
- Exhibits218: Protective Industrial Products Inc. - Key offerings
- Exhibits219: SWOT
- Exhibits220: Skanska AB - Overview
- Exhibits221: Skanska AB - Business segments
- Exhibits222: Skanska AB - Key offerings
- Exhibits223: Skanska AB - Segment focus
- Exhibits224: SWOT
- Exhibits225: Synergy Group - Overview
- Exhibits226: Synergy Group - Product / Service
- Exhibits227: Synergy Group - Key offerings
- Exhibits228: SWOT
- Exhibits229: UVEX WINTER HOLDING GmbH and Co. KG - Overview
- Exhibits230: UVEX WINTER HOLDING GmbH and Co. KG - Product / Service
- Exhibits231: UVEX WINTER HOLDING GmbH and Co. KG - Key news
- Exhibits232: UVEX WINTER HOLDING GmbH and Co. KG - Key offerings
- Exhibits233: SWOT
- Exhibits234: Inclusions checklist
- Exhibits235: Exclusions checklist
- Exhibits236: Currency conversion rates for US$
- Exhibits237: Research methodology
- Exhibits238: Information sources
- Exhibits239: Data validation
- Exhibits240: Validation techniques employed for market sizing
- Exhibits241: Data synthesis
- Exhibits242: 360 degree market analysis
- Exhibits243: List of abbreviations
Personal Protective Equipment (PPE) Market For Women 2025-2029
The personal protective equipment (PPE) market for women is forecasted to grow by USD 14292.9 million during 2024-2029, accelerating at a CAGR of 11.1% during the forecast period. The report on the personal protective equipment (PPE) market for women provides a holistic analysis, market size and forecast, trends, growth drivers, and challenges, as well as vendor analysis covering around 25 vendors.
The report offers an up-to-date analysis regarding the current market scenario, the latest trends and drivers, and the overall market environment. The market is driven by increasing incidence and prevalence of infectious biological hazards, risks of physical injuries to women in labor-intensive industries, and stringent occupational safety regulations.
| Market Scope | |
|---|---|
| Base Year | 2025 |
| End Year | 2029 |
| Series Year | 2025-2029 |
| Growth Momentum | Accelerate |
| YOY 2025 | 8.9% |
| CAGR | 11.1% |
| Incremental Value | $14292.9 mn |
The study was conducted using an objective combination of primary and secondary information including inputs from key participants in the industry. The report contains a comprehensive market size data, segment with regional analysis and vendor landscape in addition to an analysis of the key companies. Reports have historic and forecast data.
Technavio's personal protective equipment (PPE) market for women is segmented as below:
By End-user
- Healthcare
- Manufacturing
- Construction
- Oil and gas
- Others
By Product
- Protective clothing
- Hand and arm protection
- Protective footwear
- Respiratory protection
- Others
By Geographical Landscape
- North America
- Europe
- APAC
- Middle East and Africa
- South America
This study identifies the growing distribution through retail and online channels as one of the prime reasons driving the personal protective equipment (PPE) market for women growth during the next few years. Also, focus on integrating anti-microbial technology and technical advances in PPE for women will lead to sizable demand in the market.
The report on the personal protective equipment (PPE) market for women covers the following areas:
- Personal Protective Equipment (PPE) Market For Women sizing
- Personal Protective Equipment (PPE) Market For Women forecast
- Personal Protective Equipment (PPE) Market For Women industry analysis
The robust vendor analysis is designed to help clients improve their market position, and in line with this, this report provides a detailed analysis of several leading personal protective equipment (PPE) market for women vendors that include 3M Co., Ansell Ltd., Biffa PLC, Bullard, Bunzl PLC, COFRA Srl, Delta Plus Group, DuPont de Nemours Inc., Gateway Safety Inc., Globus Shetland Ltd., GVS S.p.A., JAINSONS India Regd., KARAM Group, MSA Safety Inc., Peel Ports Group Ltd., Protective Industrial Products Inc., Skanska AB, Synergy Group, and UVEX WINTER HOLDING GmbH and Co. KG. Also, the personal protective equipment (PPE) market for women analysis report includes information on upcoming trends and challenges that will influence market growth. This is to help companies strategize and leverage all forthcoming growth opportunities.
The publisher presents a detailed picture of the market by the way of study, synthesis, and summation of data from multiple sources by an analysis of key parameters such as profit, pricing, competition, and promotions. It presents various market facets by identifying the key industry influencers. The data presented is comprehensive, reliable, and a result of extensive primary and secondary research. The market research reports provide a complete competitive landscape and an in-depth vendor selection methodology and analysis using qualitative and quantitative research to forecast accurate market growth.
Table of Contents
1 Executive Summary
- 1.1 Market overview
- Executive Summary - Chart on Market Overview
- Executive Summary - Data Table on Market Overview
- Executive Summary - Chart on Global Market Characteristics
- Executive Summary - Chart on Market By Geographical Landscape
- Executive Summary - Chart on Market Segmentation by End-user
- Executive Summary - Chart on Market Segmentation by Product
- Executive Summary - Chart on Incremental Growth
- Executive Summary - Data Table on Incremental Growth
- Executive Summary - Chart on Company Market Positioning
2 Technavio Analysis
- 2.1 Analysis of price sensitivity, lifecycle, customer purchase basket, adoption rates, and purchase criteria
- Analysis of price sensitivity, lifecycle, customer purchase basket, adoption rates, and purchase criteria
- 2.2 Criticality of inputs and Factors of differentiation
- Overview on criticality of inputs and factors of differentiation
- 2.3 Factors of disruption
- Overview on factors of disruption
- 2.4 Impact of drivers and challenges
- Impact of drivers and challenges in 2024 and 2029
3 Market Landscape
- 3.1 Market ecosystem
- Parent Market
- Data Table on - Parent Market
- 3.2 Market characteristics
- Market characteristics analysis
- 3.3 Value chain analysis
- Value chain analysis
4 Market Sizing
- 4.1 Market definition
- Offerings of companies included in the market definition
- 4.2 Market segment analysis
- Market segments
- 4.3 Market size 2024
- 4.4 Market outlook: Forecast for 2024-2029
- Chart on Global - Market size and forecast 2024-2029 ($ million)
- Data Table on Global - Market size and forecast 2024-2029 ($ million)
- Chart on Global Market: Year-over-year growth 2024-2029 (%)
- Data Table on Global Market: Year-over-year growth 2024-2029 (%)
5 Historic Market Size
- 5.1 Global Personal Protective Equipment (PPE) Market For Women 2019 - 2023
- Historic Market Size - Data Table on Global Personal Protective Equipment (PPE) Market For Women 2019 - 2023 ($ million)
- 5.2 End-user segment analysis 2019 - 2023
- Historic Market Size - End-user Segment 2019 - 2023 ($ million)
- 5.3 Product segment analysis 2019 - 2023
- Historic Market Size - Product Segment 2019 - 2023 ($ million)
- 5.4 Geography segment analysis 2019 - 2023
- Historic Market Size - Geography Segment 2019 - 2023 ($ million)
- 5.5 Country segment analysis 2019 - 2023
- Historic Market Size - Country Segment 2019 - 2023 ($ million)
6 Qualitative Analysis
- 6.1 AI Impact on Global Personal Protective Equipment (PPE) Market for Women
7 Five Forces Analysis
- 7.1 Five forces summary
- Five forces analysis - Comparison between 2024 and 2029
- 7.2 Bargaining power of buyers
- Bargaining power of buyers - Impact of key factors 2024 and 2029
- 7.3 Bargaining power of suppliers
- Bargaining power of suppliers - Impact of key factors in 2024 and 2029
- 7.4 Threat of new entrants
- Threat of new entrants - Impact of key factors in 2024 and 2029
- 7.5 Threat of substitutes
- Threat of substitutes - Impact of key factors in 2024 and 2029
- 7.6 Threat of rivalry
- Threat of rivalry - Impact of key factors in 2024 and 2029
- 7.7 Market condition
- Chart on Market condition - Five forces 2024 and 2029
8 Market Segmentation by End-user
- 8.1 Market segments
- Chart on End-user - Market share 2024-2029 (%)
- Data Table on End-user - Market share 2024-2029 (%)
- 8.2 Comparison by End-user
- Chart on Comparison by End-user
- Data Table on Comparison by End-user
- 8.3 Healthcare - Market size and forecast 2024-2029
- Chart on Healthcare - Market size and forecast 2024-2029 ($ million)
- Data Table on Healthcare - Market size and forecast 2024-2029 ($ million)
- Chart on Healthcare - Year-over-year growth 2024-2029 (%)
- Data Table on Healthcare - Year-over-year growth 2024-2029 (%)
- 8.4 Manufacturing - Market size and forecast 2024-2029
- Chart on Manufacturing - Market size and forecast 2024-2029 ($ million)
- Data Table on Manufacturing - Market size and forecast 2024-2029 ($ million)
- Chart on Manufacturing - Year-over-year growth 2024-2029 (%)
- Data Table on Manufacturing - Year-over-year growth 2024-2029 (%)
- 8.5 Construction - Market size and forecast 2024-2029
- Chart on Construction - Market size and forecast 2024-2029 ($ million)
- Data Table on Construction - Market size and forecast 2024-2029 ($ million)
- Chart on Construction - Year-over-year growth 2024-2029 (%)
- Data Table on Construction - Year-over-year growth 2024-2029 (%)
- 8.6 Oil and gas - Market size and forecast 2024-2029
- Chart on Oil and gas - Market size and forecast 2024-2029 ($ million)
- Data Table on Oil and gas - Market size and forecast 2024-2029 ($ million)
- Chart on Oil and gas - Year-over-year growth 2024-2029 (%)
- Data Table on Oil and gas - Year-over-year growth 2024-2029 (%)
- 8.7 Others - Market size and forecast 2024-2029
- Chart on Others - Market size and forecast 2024-2029 ($ million)
- Data Table on Others - Market size and forecast 2024-2029 ($ million)
- Chart on Others - Year-over-year growth 2024-2029 (%)
- Data Table on Others - Year-over-year growth 2024-2029 (%)
- 8.8 Market opportunity by End-user
- Market opportunity by End-user ($ million)
- Data Table on Market opportunity by End-user ($ million)
9 Market Segmentation by Product
- 9.1 Market segments
- Chart on Product - Market share 2024-2029 (%)
- Data Table on Product - Market share 2024-2029 (%)
- 9.2 Comparison by Product
- Chart on Comparison by Product
- Data Table on Comparison by Product
- 9.3 Protective clothing - Market size and forecast 2024-2029
- Chart on Protective clothing - Market size and forecast 2024-2029 ($ million)
- Data Table on Protective clothing - Market size and forecast 2024-2029 ($ million)
- Chart on Protective clothing - Year-over-year growth 2024-2029 (%)
- Data Table on Protective clothing - Year-over-year growth 2024-2029 (%)
- 9.4 Hand and arm protection - Market size and forecast 2024-2029
- Chart on Hand and arm protection - Market size and forecast 2024-2029 ($ million)
- Data Table on Hand and arm protection - Market size and forecast 2024-2029 ($ million)
- Chart on Hand and arm protection - Year-over-year growth 2024-2029 (%)
- Data Table on Hand and arm protection - Year-over-year growth 2024-2029 (%)
- 9.5 Protective footwear - Market size and forecast 2024-2029
- Chart on Protective footwear - Market size and forecast 2024-2029 ($ million)
- Data Table on Protective footwear - Market size and forecast 2024-2029 ($ million)
- Chart on Protective footwear - Year-over-year growth 2024-2029 (%)
- Data Table on Protective footwear - Year-over-year growth 2024-2029 (%)
- 9.6 Respiratory protection - Market size and forecast 2024-2029
- Chart on Respiratory protection - Market size and forecast 2024-2029 ($ million)
- Data Table on Respiratory protection - Market size and forecast 2024-2029 ($ million)
- Chart on Respiratory protection - Year-over-year growth 2024-2029 (%)
- Data Table on Respiratory protection - Year-over-year growth 2024-2029 (%)
- 9.7 Others - Market size and forecast 2024-2029
- Chart on Others - Market size and forecast 2024-2029 ($ million)
- Data Table on Others - Market size and forecast 2024-2029 ($ million)
- Chart on Others - Year-over-year growth 2024-2029 (%)
- Data Table on Others - Year-over-year growth 2024-2029 (%)
- 9.8 Market opportunity by Product
- Market opportunity by Product ($ million)
- Data Table on Market opportunity by Product ($ million)
10 Customer Landscape
- 10.1 Customer landscape overview
- Analysis of price sensitivity, lifecycle, customer purchase basket, adoption rates, and purchase criteria
11 Geographic Landscape
- 11.1 Geographic segmentation
- Chart on Market share By Geographical Landscape 2024-2029 (%)
- Data Table on Market share By Geographical Landscape 2024-2029 (%)
- 11.2 Geographic comparison
- Chart on Geographic comparison
- Data Table on Geographic comparison
- 11.3 North America - Market size and forecast 2024-2029
- Chart on North America - Market size and forecast 2024-2029 ($ million)
- Data Table on North America - Market size and forecast 2024-2029 ($ million)
- Chart on North America - Year-over-year growth 2024-2029 (%)
- Data Table on North America - Year-over-year growth 2024-2029 (%)
- 11.4 Europe - Market size and forecast 2024-2029
- Chart on Europe - Market size and forecast 2024-2029 ($ million)
- Data Table on Europe - Market size and forecast 2024-2029 ($ million)
- Chart on Europe - Year-over-year growth 2024-2029 (%)
- Data Table on Europe - Year-over-year growth 2024-2029 (%)
- 11.5 APAC - Market size and forecast 2024-2029
- Chart on APAC - Market size and forecast 2024-2029 ($ million)
- Data Table on APAC - Market size and forecast 2024-2029 ($ million)
- Chart on APAC - Year-over-year growth 2024-2029 (%)
- Data Table on APAC - Year-over-year growth 2024-2029 (%)
- 11.6 Middle East and Africa - Market size and forecast 2024-2029
- Chart on Middle East and Africa - Market size and forecast 2024-2029 ($ million)
- Data Table on Middle East and Africa - Market size and forecast 2024-2029 ($ million)
- Chart on Middle East and Africa - Year-over-year growth 2024-2029 (%)
- Data Table on Middle East and Africa - Year-over-year growth 2024-2029 (%)
- 11.7 South America - Market size and forecast 2024-2029
- Chart on South America - Market size and forecast 2024-2029 ($ million)
- Data Table on South America - Market size and forecast 2024-2029 ($ million)
- Chart on South America - Year-over-year growth 2024-2029 (%)
- Data Table on South America - Year-over-year growth 2024-2029 (%)
- 11.8 US - Market size and forecast 2024-2029
- Chart on US - Market size and forecast 2024-2029 ($ million)
- Data Table on US - Market size and forecast 2024-2029 ($ million)
- Chart on US - Year-over-year growth 2024-2029 (%)
- Data Table on US - Year-over-year growth 2024-2029 (%)
- 11.9 China - Market size and forecast 2024-2029
- Chart on China - Market size and forecast 2024-2029 ($ million)
- Data Table on China - Market size and forecast 2024-2029 ($ million)
- Chart on China - Year-over-year growth 2024-2029 (%)
- Data Table on China - Year-over-year growth 2024-2029 (%)
- 11.10 UK - Market size and forecast 2024-2029
- Chart on UK - Market size and forecast 2024-2029 ($ million)
- Data Table on UK - Market size and forecast 2024-2029 ($ million)
- Chart on UK - Year-over-year growth 2024-2029 (%)
- Data Table on UK - Year-over-year growth 2024-2029 (%)
- 11.11 Canada - Market size and forecast 2024-2029
- Chart on Canada - Market size and forecast 2024-2029 ($ million)
- Data Table on Canada - Market size and forecast 2024-2029 ($ million)
- Chart on Canada - Year-over-year growth 2024-2029 (%)
- Data Table on Canada - Year-over-year growth 2024-2029 (%)
- 11.12 Germany - Market size and forecast 2024-2029
- Chart on Germany - Market size and forecast 2024-2029 ($ million)
- Data Table on Germany - Market size and forecast 2024-2029 ($ million)
- Chart on Germany - Year-over-year growth 2024-2029 (%)
- Data Table on Germany - Year-over-year growth 2024-2029 (%)
- 11.13 Japan - Market size and forecast 2024-2029
- Chart on Japan - Market size and forecast 2024-2029 ($ million)
- Data Table on Japan - Market size and forecast 2024-2029 ($ million)
- Chart on Japan - Year-over-year growth 2024-2029 (%)
- Data Table on Japan - Year-over-year growth 2024-2029 (%)
- 11.14 India - Market size and forecast 2024-2029
- Chart on India - Market size and forecast 2024-2029 ($ million)
- Data Table on India - Market size and forecast 2024-2029 ($ million)
- Chart on India - Year-over-year growth 2024-2029 (%)
- Data Table on India - Year-over-year growth 2024-2029 (%)
- 11.15 France - Market size and forecast 2024-2029
- Chart on France - Market size and forecast 2024-2029 ($ million)
- Data Table on France - Market size and forecast 2024-2029 ($ million)
- Chart on France - Year-over-year growth 2024-2029 (%)
- Data Table on France - Year-over-year growth 2024-2029 (%)
- 11.16 Italy - Market size and forecast 2024-2029
- Chart on Italy - Market size and forecast 2024-2029 ($ million)
- Data Table on Italy - Market size and forecast 2024-2029 ($ million)
- Chart on Italy - Year-over-year growth 2024-2029 (%)
- Data Table on Italy - Year-over-year growth 2024-2029 (%)
- 11.17 The Netherlands - Market size and forecast 2024-2029
- Chart on The Netherlands - Market size and forecast 2024-2029 ($ million)
- Data Table on The Netherlands - Market size and forecast 2024-2029 ($ million)
- Chart on The Netherlands - Year-over-year growth 2024-2029 (%)
- Data Table on The Netherlands - Year-over-year growth 2024-2029 (%)
- 11.18 Market opportunity By Geographical Landscape
- Market opportunity By Geographical Landscape ($ million)
- Data Tables on Market opportunity By Geographical Landscape ($ million)
12 Drivers, Challenges, and Opportunity/Restraints
- 12.1 Market drivers
- 12.2 Market challenges
- 12.3 Impact of drivers and challenges
- Impact of drivers and challenges in 2024 and 2029
- 12.4 Market opportunities/restraints
13 Competitive Landscape
- 13.1 Overview
- 13.2 Competitive Landscape
- Overview on criticality of inputs and factors of differentiation
- 13.3 Landscape disruption
- Overview on factors of disruption
- 13.4 Industry risks
- Impact of key risks on business
14 Competitive Analysis
- 14.1 Companies profiled
- Companies covered
- 14.2 Company ranking index
- Company ranking index
- 14.3 Market positioning of companies
- Matrix on companies position and classification
- 3M Co.
- 3M Co. - Overview
- 3M Co. - Business segments
- 3M Co. - Key news
- 3M Co. - Key offerings
- 3M Co. - Segment focus
- SWOT
- 14.5 Ansell Ltd.
- Ansell Ltd. - Overview
- Ansell Ltd. - Business segments
- Ansell Ltd. - Key news
- Ansell Ltd. - Key offerings
- Ansell Ltd. - Segment focus
- SWOT
- 14.6 Biffa Plc
- Biffa Plc - Overview
- Biffa Plc - Product / Service
- Biffa Plc - Key offerings
- SWOT
- 14.7 Bullard
- Bullard - Overview
- Bullard - Product / Service
- Bullard - Key offerings
- SWOT
- 14.8 Bunzl Plc
- Bunzl Plc - Overview
- Bunzl Plc - Business segments
- Bunzl Plc - Key news
- Bunzl Plc - Key offerings
- Bunzl Plc - Segment focus
- SWOT
- 14.9 COFRA Srl
- COFRA Srl - Overview
- COFRA Srl - Product / Service
- COFRA Srl - Key offerings
- SWOT
- 14.10 Delta Plus Group
- Delta Plus Group - Overview
- Delta Plus Group - Business segments
- Delta Plus Group - Key offerings
- Delta Plus Group - Segment focus
- SWOT
- 14.11 DuPont de Nemours Inc.
- DuPont de Nemours Inc. - Overview
- DuPont de Nemours Inc. - Business segments
- DuPont de Nemours Inc. - Key news
- DuPont de Nemours Inc. - Key offerings
- DuPont de Nemours Inc. - Segment focus
- SWOT
- 14.12 Gateway Safety Inc.
- Gateway Safety Inc. - Overview
- Gateway Safety Inc. - Product / Service
- Gateway Safety Inc. - Key offerings
- SWOT
- 14.13 GVS S.p.A.
- GVS S.p.A. - Overview
- GVS S.p.A. - Product / Service
- GVS S.p.A. - Key offerings
- SWOT
- 14.14 MSA Safety Inc.
- MSA Safety Inc. - Overview
- MSA Safety Inc. - Business segments
- MSA Safety Inc. - Key offerings
- MSA Safety Inc. - Segment focus
- SWOT
- 14.15 Protective Industrial Products Inc.
- Protective Industrial Products Inc. - Overview
- Protective Industrial Products Inc. - Product / Service
- Protective Industrial Products Inc. - Key offerings
- SWOT
- 14.16 Skanska AB
- Skanska AB - Overview
- Skanska AB - Business segments
- Skanska AB - Key offerings
- Skanska AB - Segment focus
- SWOT
- 14.17 Synergy Group
- Synergy Group - Overview
- Synergy Group - Product / Service
- Synergy Group - Key offerings
- SWOT
- 14.18 UVEX WINTER HOLDING GmbH and Co. KG
- UVEX WINTER HOLDING GmbH and Co. KG - Overview
- UVEX WINTER HOLDING GmbH and Co. KG - Product / Service
- UVEX WINTER HOLDING GmbH and Co. KG - Key news
- UVEX WINTER HOLDING GmbH and Co. KG - Key offerings
- SWOT
15 Appendix
- 15.1 Scope of the report
- 15.2 Inclusions and exclusions checklist
- Inclusions checklist
- Exclusions checklist
- 15.3 Currency conversion rates for US$
- Currency conversion rates for US$
- 15.4 Research methodology
- Research methodology
- 15.5 Data procurement
- Information sources
- 15.6 Data validation
- Data validation
- 15.7 Validation techniques employed for market sizing
- Validation techniques employed for market sizing
- 15.8 Data synthesis
- Data synthesis
- 15.9 360 degree market analysis
- 360 degree market analysis
- 15.10 List of abbreviations
- List of abbreviations

