|
|
市場調査レポート
商品コード
1516422
リチウム硫黄電池の世界市場 2024-2028Global lithium-sulfur battery market 2024-2028 |
||||||
|
|||||||
カスタマイズ可能
|
|||||||

| リチウム硫黄電池の世界市場 2024-2028 |
|
出版日: 2024年06月12日
発行: TechNavio
ページ情報: 英文 168 Pages
納期: 即納可能
|

全表示
- 概要
- 図表
- 目次
リチウム硫黄電池市場は2023-2028年に39億2,190万米ドル、予測期間中のCAGRは44.97%で成長すると予測されます。
当レポートでは、リチウム硫黄電池市場の全体的な分析、市場規模・予測、動向、成長促進要因、課題、約25のベンダーを網羅したベンダー分析などを掲載しています。
現在の市場シナリオ、最新動向と促進要因、市場環境全体に関する最新分析を提供しています。市場を牽引しているのは、鉛バッテリーの有害な使用によるリチウム電池の採用増加、排出ガスに関する政府の厳しい規制、ドローンの飛行時間改善の必要性などです。
| 市場範囲 | |
|---|---|
| 基準年 | 2024 |
| 終了年 | 2028 |
| 予測期間 | 2024-2028 |
| 成長モメンタム | 加速 |
| 前年比2024年 | 34.37% |
| CAGR | 44.97% |
| 増分額 | 39億2,190万米ドル |
本調査では、今後数年間のリチウム硫黄電池市場成長を牽引する主要因の1つとして、電池におけるナノテクノロジー利用を挙げています。また、マイクログリッド展開の増加、ベンダー数の増加、研究開発のためのコラボレーションが市場の大きな需要につながります。
目次
第1章 エグゼクティブサマリー
- 市場概要
第2章 市場情勢
- 市場エコシステム
- 市場の特徴
- バリューチェーン分析
第3章 市場規模の評価
- 市場の定義
- 市場セグメント分析
- 市場規模 2023
- 市場の見通し 2023-2028
第4章 市場規模実績
- 世界リチウム硫黄電池市場 2018-2022
- タイプ別セグメント分析 2018-2022
- エンドユーザー別セグメント分析 2018-2022
- 地域別セグメント分析 2018-2022
- 国別セグメント分析 2018-2022
第5章 ファイブフォース分析
- ファイブフォースの要約
- 買い手の交渉力
- 供給企業の交渉力
- 新規参入業者の脅威
- 代替品の脅威
- 競争の脅威
- 市況
第6章 市場セグメンテーション:タイプ別
- 市場セグメンテーション
- 比較:タイプ別
- 高エネルギー密度:市場規模と予測 2023-2028
- 低エネルギー密度:市場規模と予測 2023-2028
- 市場機会:タイプ別
第7章 市場セグメンテーション:エンドユーザー別
- 市場セグメンテーション
- 比較:エンドユーザー別
- 航空:市場規模と予測 2023-2028
- 自動車:市場規模と予測 2023-2028
- その他:市場規模と予測 2023-2028
- 市場機会:エンドユーザー別
第8章 顧客情勢
- 顧客情勢の概要
第9章 地域別情勢
- 地域別セグメンテーション
- 地域別比較
- 北米:市場規模と予測 2023-2028
- 欧州:市場規模と予測 2023-2028
- アジア太平洋:市場規模と予測 2023-2028
- 南米:市場規模と予測 2023-2028
- 中東・アフリカ:市場規模と予測 2023-2028
- 米国:市場規模と予測 2023-2028
- ドイツ:市場規模と予測 2023-2028
- カナダ:市場規模と予測 2023-2028
- 中国:市場規模と予測 2023-2028
- インド:市場規模と予測 2023-2028
- 市場機会:地域別
第10章 促進要因・課題・機会・抑制要因
- 市場促進要因
- 市場の課題
- 促進要因と課題の影響
- 市場の機会・抑制要因
第11章 競合情勢
- 概要
- 競合情勢
- 混乱の状況
- 業界のリスク
第12章 競合分析
- 企業プロファイル
- 企業の市場ポジショニング
- Bettergy Corp.
- CIC energiGUNE
- Gelion Technologies Pty Ltd.
- Giner Inc.
- Ilika
- Iolitec Ionic Liquids Technologies GmbH
- LG Chem Ltd.
- Li-S Energy Ltd.
- Lyten Inc.
- Merck KGaA
- NexTech Batteries
- Poly Plus Battery Co.
- Sion Power Corp.
- Solid State PLC
- TRU Group Inc.
第13章 付録
Exhibits:
- Exhibits1: Executive Summary - Chart on Market Overview
- Exhibits2: Executive Summary - Data Table on Market Overview
- Exhibits3: Executive Summary - Chart on Global Market Characteristics
- Exhibits4: Executive Summary - Chart on Market by Geography
- Exhibits5: Executive Summary - Chart on Market Segmentation by Type
- Exhibits6: Executive Summary - Chart on Market Segmentation by End-user
- Exhibits7: Executive Summary - Chart on Incremental Growth
- Exhibits8: Executive Summary - Data Table on Incremental Growth
- Exhibits9: Executive Summary - Chart on Company Market Positioning
- Exhibits10: Parent Market
- Exhibits11: Data Table on - Parent Market
- Exhibits12: Market characteristics analysis
- Exhibits13: Value Chain Analysis
- Exhibits14: Offerings of companies included in the market definition
- Exhibits15: Market segments
- Exhibits16: Chart on Global - Market size and forecast 2023-2028 ($ million)
- Exhibits17: Data Table on Global - Market size and forecast 2023-2028 ($ million)
- Exhibits18: Chart on Global Market: Year-over-year growth 2023-2028 (%)
- Exhibits19: Data Table on Global Market: Year-over-year growth 2023-2028 (%)
- Exhibits20: Historic Market Size - Data Table on Global Lithium-Sulfur Battery Market 2018 - 2022 ($ million)
- Exhibits21: Historic Market Size - Type Segment 2018 - 2022 ($ million)
- Exhibits22: Historic Market Size - End-user Segment 2018 - 2022 ($ million)
- Exhibits23: Historic Market Size - Geography Segment 2018 - 2022 ($ million)
- Exhibits24: Historic Market Size - Country Segment 2018 - 2022 ($ million)
- Exhibits25: Five forces analysis - Comparison between 2023 and 2028
- Exhibits26: Bargaining power of buyers - Impact of key factors 2023 and 2028
- Exhibits27: Bargaining power of suppliers - Impact of key factors in 2023 and 2028
- Exhibits28: Threat of new entrants - Impact of key factors in 2023 and 2028
- Exhibits29: Threat of substitutes - Impact of key factors in 2023 and 2028
- Exhibits30: Threat of rivalry - Impact of key factors in 2023 and 2028
- Exhibits31: Chart on Market condition - Five forces 2023 and 2028
- Exhibits32: Chart on Type - Market share 2023-2028 (%)
- Exhibits33: Data Table on Type - Market share 2023-2028 (%)
- Exhibits34: Chart on Comparison by Type
- Exhibits35: Data Table on Comparison by Type
- Exhibits36: Chart on High energy density - Market size and forecast 2023-2028 ($ million)
- Exhibits37: Data Table on High energy density - Market size and forecast 2023-2028 ($ million)
- Exhibits38: Chart on High energy density - Year-over-year growth 2023-2028 (%)
- Exhibits39: Data Table on High energy density - Year-over-year growth 2023-2028 (%)
- Exhibits40: Chart on Low energy density - Market size and forecast 2023-2028 ($ million)
- Exhibits41: Data Table on Low energy density - Market size and forecast 2023-2028 ($ million)
- Exhibits42: Chart on Low energy density - Year-over-year growth 2023-2028 (%)
- Exhibits43: Data Table on Low energy density - Year-over-year growth 2023-2028 (%)
- Exhibits44: Market opportunity by Type ($ million)
- Exhibits45: Data Table on Market opportunity by Type ($ million)
- Exhibits46: Chart on End-user - Market share 2023-2028 (%)
- Exhibits47: Data Table on End-user - Market share 2023-2028 (%)
- Exhibits48: Chart on Comparison by End-user
- Exhibits49: Data Table on Comparison by End-user
- Exhibits50: Chart on Aviation - Market size and forecast 2023-2028 ($ million)
- Exhibits51: Data Table on Aviation - Market size and forecast 2023-2028 ($ million)
- Exhibits52: Chart on Aviation - Year-over-year growth 2023-2028 (%)
- Exhibits53: Data Table on Aviation - Year-over-year growth 2023-2028 (%)
- Exhibits54: Chart on Automotive - Market size and forecast 2023-2028 ($ million)
- Exhibits55: Data Table on Automotive - Market size and forecast 2023-2028 ($ million)
- Exhibits56: Chart on Automotive - Year-over-year growth 2023-2028 (%)
- Exhibits57: Data Table on Automotive - Year-over-year growth 2023-2028 (%)
- Exhibits58: Chart on Others - Market size and forecast 2023-2028 ($ million)
- Exhibits59: Data Table on Others - Market size and forecast 2023-2028 ($ million)
- Exhibits60: Chart on Others - Year-over-year growth 2023-2028 (%)
- Exhibits61: Data Table on Others - Year-over-year growth 2023-2028 (%)
- Exhibits62: Market opportunity by End-user ($ million)
- Exhibits63: Data Table on Market opportunity by End-user ($ million)
- Exhibits64: Analysis of price sensitivity, lifecycle, customer purchase basket, adoption rates, and purchase criteria
- Exhibits65: Chart on Market share by geography 2023-2028 (%)
- Exhibits66: Data Table on Market share by geography 2023-2028 (%)
- Exhibits67: Chart on Geographic comparison
- Exhibits68: Data Table on Geographic comparison
- Exhibits69: Chart on North America - Market size and forecast 2023-2028 ($ million)
- Exhibits70: Data Table on North America - Market size and forecast 2023-2028 ($ million)
- Exhibits71: Chart on North America - Year-over-year growth 2023-2028 (%)
- Exhibits72: Data Table on North America - Year-over-year growth 2023-2028 (%)
- Exhibits73: Chart on Europe - Market size and forecast 2023-2028 ($ million)
- Exhibits74: Data Table on Europe - Market size and forecast 2023-2028 ($ million)
- Exhibits75: Chart on Europe - Year-over-year growth 2023-2028 (%)
- Exhibits76: Data Table on Europe - Year-over-year growth 2023-2028 (%)
- Exhibits77: Chart on APAC - Market size and forecast 2023-2028 ($ million)
- Exhibits78: Data Table on APAC - Market size and forecast 2023-2028 ($ million)
- Exhibits79: Chart on APAC - Year-over-year growth 2023-2028 (%)
- Exhibits80: Data Table on APAC - Year-over-year growth 2023-2028 (%)
- Exhibits81: Chart on South America - Market size and forecast 2023-2028 ($ million)
- Exhibits82: Data Table on South America - Market size and forecast 2023-2028 ($ million)
- Exhibits83: Chart on South America - Year-over-year growth 2023-2028 (%)
- Exhibits84: Data Table on South America - Year-over-year growth 2023-2028 (%)
- Exhibits85: Chart on Middle East and Africa - Market size and forecast 2023-2028 ($ million)
- Exhibits86: Data Table on Middle East and Africa - Market size and forecast 2023-2028 ($ million)
- Exhibits87: Chart on Middle East and Africa - Year-over-year growth 2023-2028 (%)
- Exhibits88: Data Table on Middle East and Africa - Year-over-year growth 2023-2028 (%)
- Exhibits89: Chart on US - Market size and forecast 2023-2028 ($ million)
- Exhibits90: Data Table on US - Market size and forecast 2023-2028 ($ million)
- Exhibits91: Chart on US - Year-over-year growth 2023-2028 (%)
- Exhibits92: Data Table on US - Year-over-year growth 2023-2028 (%)
- Exhibits93: Chart on Germany - Market size and forecast 2023-2028 ($ million)
- Exhibits94: Data Table on Germany - Market size and forecast 2023-2028 ($ million)
- Exhibits95: Chart on Germany - Year-over-year growth 2023-2028 (%)
- Exhibits96: Data Table on Germany - Year-over-year growth 2023-2028 (%)
- Exhibits97: Chart on Canada - Market size and forecast 2023-2028 ($ million)
- Exhibits98: Data Table on Canada - Market size and forecast 2023-2028 ($ million)
- Exhibits99: Chart on Canada - Year-over-year growth 2023-2028 (%)
- Exhibits100: Data Table on Canada - Year-over-year growth 2023-2028 (%)
- Exhibits101: Chart on China - Market size and forecast 2023-2028 ($ million)
- Exhibits102: Data Table on China - Market size and forecast 2023-2028 ($ million)
- Exhibits103: Chart on China - Year-over-year growth 2023-2028 (%)
- Exhibits104: Data Table on China - Year-over-year growth 2023-2028 (%)
- Exhibits105: Chart on India - Market size and forecast 2023-2028 ($ million)
- Exhibits106: Data Table on India - Market size and forecast 2023-2028 ($ million)
- Exhibits107: Chart on India - Year-over-year growth 2023-2028 (%)
- Exhibits108: Data Table on India - Year-over-year growth 2023-2028 (%)
- Exhibits109: Market opportunity by geography ($ million)
- Exhibits110: Data Tables on Market opportunity by geography ($ million)
- Exhibits111: Impact of drivers and challenges in 2023 and 2028
- Exhibits112: Overview on criticality of inputs and factors of differentiation
- Exhibits113: Overview on factors of disruption
- Exhibits114: Impact of key risks on business
- Exhibits115: Companies covered
- Exhibits116: Matrix on companies position and classification
- Exhibits117: Bettergy Corp. - Overview
- Exhibits118: Bettergy Corp. - Product / Service
- Exhibits119: Bettergy Corp. - Key offerings
- Exhibits120: CIC energiGUNE - Overview
- Exhibits121: CIC energiGUNE - Product / Service
- Exhibits122: CIC energiGUNE - Key offerings
- Exhibits123: Gelion Technologies Pty Ltd. - Overview
- Exhibits124: Gelion Technologies Pty Ltd. - Product / Service
- Exhibits125: Gelion Technologies Pty Ltd. - Key offerings
- Exhibits126: Giner Inc. - Overview
- Exhibits127: Giner Inc. - Product / Service
- Exhibits128: Giner Inc. - Key offerings
- Exhibits129: Ilika - Overview
- Exhibits130: Ilika - Product / Service
- Exhibits131: Ilika - Key offerings
- Exhibits132: Iolitec Ionic Liquids Technologies GmbH - Overview
- Exhibits133: Iolitec Ionic Liquids Technologies GmbH - Product / Service
- Exhibits134: Iolitec Ionic Liquids Technologies GmbH - Key offerings
- Exhibits135: LG Chem Ltd. - Overview
- Exhibits136: LG Chem Ltd. - Business segments
- Exhibits137: LG Chem Ltd. - Key news
- Exhibits138: LG Chem Ltd. - Key offerings
- Exhibits139: LG Chem Ltd. - Segment focus
- Exhibits140: Li-S Energy Ltd. - Overview
- Exhibits141: Li-S Energy Ltd. - Product / Service
- Exhibits142: Li-S Energy Ltd. - Key offerings
- Exhibits143: Lyten Inc. - Overview
- Exhibits144: Lyten Inc. - Product / Service
- Exhibits145: Lyten Inc. - Key offerings
- Exhibits146: Merck KGaA - Overview
- Exhibits147: Merck KGaA - Business segments
- Exhibits148: Merck KGaA - Key news
- Exhibits149: Merck KGaA - Key offerings
- Exhibits150: Merck KGaA - Segment focus
- Exhibits151: NexTech Batteries - Overview
- Exhibits152: NexTech Batteries - Product / Service
- Exhibits153: NexTech Batteries - Key offerings
- Exhibits154: Poly Plus Battery Co. - Overview
- Exhibits155: Poly Plus Battery Co. - Product / Service
- Exhibits156: Poly Plus Battery Co. - Key offerings
- Exhibits157: Sion Power Corp. - Overview
- Exhibits158: Sion Power Corp. - Product / Service
- Exhibits159: Sion Power Corp. - Key offerings
- Exhibits160: Solid State PLC - Overview
- Exhibits161: Solid State PLC - Product / Service
- Exhibits162: Solid State PLC - Key offerings
- Exhibits163: TRU Group Inc. - Overview
- Exhibits164: TRU Group Inc. - Product / Service
- Exhibits165: TRU Group Inc. - Key offerings
- Exhibits166: Inclusions checklist
- Exhibits167: Exclusions checklist
- Exhibits168: Currency conversion rates for US$
- Exhibits169: Research methodology
- Exhibits170: Information sources
- Exhibits171: Data validation
- Exhibits172: Validation techniques employed for market sizing
- Exhibits173: Data synthesis
- Exhibits174: 360 degree market analysis
- Exhibits175: List of abbreviations
The lithium-sulfur battery market is forecasted to grow by USD 3921.9 mn during 2023-2028, accelerating at a CAGR of 44.97% during the forecast period. The report on the lithium-sulfur battery market provides a holistic analysis, market size and forecast, trends, growth drivers, and challenges, as well as vendor analysis covering around 25 vendors.
The report offers an up-to-date analysis regarding the current market scenario, the latest trends and drivers, and the overall market environment. The market is driven by harmful usage of lead batteries leads to higher adoption of li-s batteries, stringent government regulations on emissions, and need to improve flying time in drones.
Technavio's lithium-sulfur battery market is segmented as below:
| Market Scope | |
|---|---|
| Base Year | 2024 |
| End Year | 2028 |
| Series Year | 2024-2028 |
| Growth Momentum | Accelerate |
| YOY 2024 | 34.37% |
| CAGR | 44.97% |
| Incremental Value | $3921.9mn |
By Type
- High energy density
- Low energy density
By End-user
- Aviation
- Automotive
- Others
By Geography
- North America
- Europe
- APAC
- South America
- Middle East and Africa
This study identifies the use of nanotechnology in batteries as one of the prime reasons driving the lithium-sulfur battery market growth during the next few years. Also, increasing deployment of microgrids and rising number of vendors and collaborations for research and development will lead to sizable demand in the market.
The report on the lithium-sulfur battery market covers the following areas:
- Lithium-sulfur battery market sizing
- Lithium-sulfur battery market forecast
- Lithium-sulfur battery market industry analysis
The robust vendor analysis is designed to help clients improve their market position, and in line with this, this report provides a detailed analysis of several leading lithium-sulfur battery market vendors that include Bettergy Corp., CIC energiGUNE, Gelion Technologies Pty Ltd., Giner Inc., Guang Dong Fullriver Industry Co. Ltd., Ilika, Iolitec Ionic Liquids Technologies GmbH, LG Chem Ltd., Li-S Energy Ltd., Lyten Inc., Merck KGaA, NexTech Batteries, Poly Plus Battery Co., Rechargion Energy Pvt. Ltd., Shenzhen Uscender Industrial Co. Ltd., Sion Power Corp., Solid State PLC, TRU Group Inc., VTC Power Co. Ltd., and Zeta Energy LLC. Also, the lithium-sulfur battery market analysis report includes information on upcoming trends and challenges that will influence market growth. This is to help companies strategize and leverage all forthcoming growth opportunities.
The study was conducted using an objective combination of primary and secondary information including inputs from key participants in the industry. The report contains a comprehensive market and vendor landscape in addition to an analysis of the key vendors.
The publisher presents a detailed picture of the market by the way of study, synthesis, and summation of data from multiple sources by an analysis of key parameters such as profit, pricing, competition, and promotions. It presents various market facets by identifying the key industry influencers. The data presented is comprehensive, reliable, and a result of extensive research - both primary and secondary. The market research reports provide a complete competitive landscape and an in-depth vendor selection methodology and analysis using qualitative and quantitative research to forecast the accurate market growth.
Table of Contents
1 Executive Summary
- 1.1 Market overview
- Executive Summary - Chart on Market Overview
- Executive Summary - Data Table on Market Overview
- Executive Summary - Chart on Global Market Characteristics
- Executive Summary - Chart on Market by Geography
- Executive Summary - Chart on Market Segmentation by Type
- Executive Summary - Chart on Market Segmentation by End-user
- Executive Summary - Chart on Incremental Growth
- Executive Summary - Data Table on Incremental Growth
- Executive Summary - Chart on Company Market Positioning
2 Market Landscape
- 2.1 Market ecosystem
- Parent Market
- Data Table on - Parent Market
- 2.2 Market characteristics
- Market characteristics analysis
- 2.3 Value chain analysis
- Value Chain Analysis
3 Market Sizing
- 3.1 Market definition
- Offerings of companies included in the market definition
- 3.2 Market segment analysis
- Market segments
- 3.3 Market size 2023
- 3.4 Market outlook: Forecast for 2023-2028
- Chart on Global - Market size and forecast 2023-2028 ($ million)
- Data Table on Global - Market size and forecast 2023-2028 ($ million)
- Chart on Global Market: Year-over-year growth 2023-2028 (%)
- Data Table on Global Market: Year-over-year growth 2023-2028 (%)
4 Historic Market Size
- 4.1 Global Lithium-Sulfur Battery Market 2018 - 2022
- Historic Market Size - Data Table on Global Lithium-Sulfur Battery Market 2018 - 2022 ($ million)
- 4.2 Type segment analysis 2018 - 2022
- Historic Market Size - Type Segment 2018 - 2022 ($ million)
- 4.3 End-user segment analysis 2018 - 2022
- Historic Market Size - End-user Segment 2018 - 2022 ($ million)
- 4.4 Geography segment analysis 2018 - 2022
- Historic Market Size - Geography Segment 2018 - 2022 ($ million)
- 4.5 Country segment analysis 2018 - 2022
- Historic Market Size - Country Segment 2018 - 2022 ($ million)
5 Five Forces Analysis
- 5.1 Five forces summary
- Five forces analysis - Comparison between 2023 and 2028
- 5.2 Bargaining power of buyers
- Bargaining power of buyers - Impact of key factors 2023 and 2028
- 5.3 Bargaining power of suppliers
- Bargaining power of suppliers - Impact of key factors in 2023 and 2028
- 5.4 Threat of new entrants
- Threat of new entrants - Impact of key factors in 2023 and 2028
- 5.5 Threat of substitutes
- Threat of substitutes - Impact of key factors in 2023 and 2028
- 5.6 Threat of rivalry
- Threat of rivalry - Impact of key factors in 2023 and 2028
- 5.7 Market condition
- Chart on Market condition - Five forces 2023 and 2028
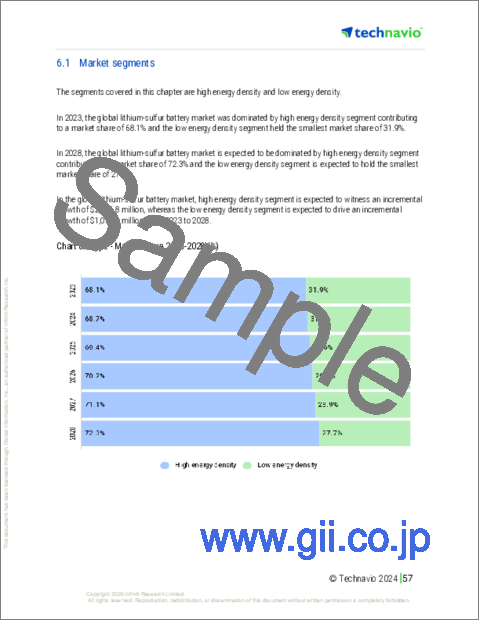
6 Market Segmentation by Type
- 6.1 Market segments
- Chart on Type - Market share 2023-2028 (%)
- Data Table on Type - Market share 2023-2028 (%)
- 6.2 Comparison by Type
- Chart on Comparison by Type
- Data Table on Comparison by Type
- 6.3 High energy density - Market size and forecast 2023-2028
- Chart on High energy density - Market size and forecast 2023-2028 ($ million)
- Data Table on High energy density - Market size and forecast 2023-2028 ($ million)
- Chart on High energy density - Year-over-year growth 2023-2028 (%)
- Data Table on High energy density - Year-over-year growth 2023-2028 (%)
- 6.4 Low energy density - Market size and forecast 2023-2028
- Chart on Low energy density - Market size and forecast 2023-2028 ($ million)
- Data Table on Low energy density - Market size and forecast 2023-2028 ($ million)
- Chart on Low energy density - Year-over-year growth 2023-2028 (%)
- Data Table on Low energy density - Year-over-year growth 2023-2028 (%)
- 6.5 Market opportunity by Type
- Market opportunity by Type ($ million)
- Data Table on Market opportunity by Type ($ million)
7 Market Segmentation by End-user
- 7.1 Market segments
- Chart on End-user - Market share 2023-2028 (%)
- Data Table on End-user - Market share 2023-2028 (%)
- 7.2 Comparison by End-user
- Chart on Comparison by End-user
- Data Table on Comparison by End-user
- 7.3 Aviation - Market size and forecast 2023-2028
- Chart on Aviation - Market size and forecast 2023-2028 ($ million)
- Data Table on Aviation - Market size and forecast 2023-2028 ($ million)
- Chart on Aviation - Year-over-year growth 2023-2028 (%)
- Data Table on Aviation - Year-over-year growth 2023-2028 (%)
- 7.4 Automotive - Market size and forecast 2023-2028
- Chart on Automotive - Market size and forecast 2023-2028 ($ million)
- Data Table on Automotive - Market size and forecast 2023-2028 ($ million)
- Chart on Automotive - Year-over-year growth 2023-2028 (%)
- Data Table on Automotive - Year-over-year growth 2023-2028 (%)
- 7.5 Others - Market size and forecast 2023-2028
- Chart on Others - Market size and forecast 2023-2028 ($ million)
- Data Table on Others - Market size and forecast 2023-2028 ($ million)
- Chart on Others - Year-over-year growth 2023-2028 (%)
- Data Table on Others - Year-over-year growth 2023-2028 (%)
- 7.6 Market opportunity by End-user
- Market opportunity by End-user ($ million)
- Data Table on Market opportunity by End-user ($ million)
8 Customer Landscape
- 8.1 Customer landscape overview
- Analysis of price sensitivity, lifecycle, customer purchase basket, adoption rates, and purchase criteria
9 Geographic Landscape
- 9.1 Geographic segmentation
- Chart on Market share by geography 2023-2028 (%)
- Data Table on Market share by geography 2023-2028 (%)
- 9.2 Geographic comparison
- Chart on Geographic comparison
- Data Table on Geographic comparison
- 9.3 North America - Market size and forecast 2023-2028
- Chart on North America - Market size and forecast 2023-2028 ($ million)
- Data Table on North America - Market size and forecast 2023-2028 ($ million)
- Chart on North America - Year-over-year growth 2023-2028 (%)
- Data Table on North America - Year-over-year growth 2023-2028 (%)
- 9.4 Europe - Market size and forecast 2023-2028
- Chart on Europe - Market size and forecast 2023-2028 ($ million)
- Data Table on Europe - Market size and forecast 2023-2028 ($ million)
- Chart on Europe - Year-over-year growth 2023-2028 (%)
- Data Table on Europe - Year-over-year growth 2023-2028 (%)
- 9.5 APAC - Market size and forecast 2023-2028
- Chart on APAC - Market size and forecast 2023-2028 ($ million)
- Data Table on APAC - Market size and forecast 2023-2028 ($ million)
- Chart on APAC - Year-over-year growth 2023-2028 (%)
- Data Table on APAC - Year-over-year growth 2023-2028 (%)
- 9.6 South America - Market size and forecast 2023-2028
- Chart on South America - Market size and forecast 2023-2028 ($ million)
- Data Table on South America - Market size and forecast 2023-2028 ($ million)
- Chart on South America - Year-over-year growth 2023-2028 (%)
- Data Table on South America - Year-over-year growth 2023-2028 (%)
- 9.7 Middle East and Africa - Market size and forecast 2023-2028
- Chart on Middle East and Africa - Market size and forecast 2023-2028 ($ million)
- Data Table on Middle East and Africa - Market size and forecast 2023-2028 ($ million)
- Chart on Middle East and Africa - Year-over-year growth 2023-2028 (%)
- Data Table on Middle East and Africa - Year-over-year growth 2023-2028 (%)
- 9.8 US - Market size and forecast 2023-2028
- Chart on US - Market size and forecast 2023-2028 ($ million)
- Data Table on US - Market size and forecast 2023-2028 ($ million)
- Chart on US - Year-over-year growth 2023-2028 (%)
- Data Table on US - Year-over-year growth 2023-2028 (%)
- 9.9 Germany - Market size and forecast 2023-2028
- Chart on Germany - Market size and forecast 2023-2028 ($ million)
- Data Table on Germany - Market size and forecast 2023-2028 ($ million)
- Chart on Germany - Year-over-year growth 2023-2028 (%)
- Data Table on Germany - Year-over-year growth 2023-2028 (%)
- 9.10 Canada - Market size and forecast 2023-2028
- Chart on Canada - Market size and forecast 2023-2028 ($ million)
- Data Table on Canada - Market size and forecast 2023-2028 ($ million)
- Chart on Canada - Year-over-year growth 2023-2028 (%)
- Data Table on Canada - Year-over-year growth 2023-2028 (%)
- 9.11 China - Market size and forecast 2023-2028
- Chart on China - Market size and forecast 2023-2028 ($ million)
- Data Table on China - Market size and forecast 2023-2028 ($ million)
- Chart on China - Year-over-year growth 2023-2028 (%)
- Data Table on China - Year-over-year growth 2023-2028 (%)
- 9.12 India - Market size and forecast 2023-2028
- Chart on India - Market size and forecast 2023-2028 ($ million)
- Data Table on India - Market size and forecast 2023-2028 ($ million)
- Chart on India - Year-over-year growth 2023-2028 (%)
- Data Table on India - Year-over-year growth 2023-2028 (%)
- 9.13 Market opportunity by geography
- Market opportunity by geography ($ million)
- Data Tables on Market opportunity by geography ($ million)
10 Drivers, Challenges, and Opportunity/Restraints
- 10.1 Market drivers
- 10.2 Market challenges
- 10.3 Impact of drivers and challenges
- Impact of drivers and challenges in 2023 and 2028
- 10.4 Market opportunities/restraints
11 Competitive Landscape
- 11.1 Overview
- 11.2 Competitive Landscape
- Overview on criticality of inputs and factors of differentiation
- 11.3 Landscape disruption
- Overview on factors of disruption
- 11.4 Industry risks
- Impact of key risks on business
12 Competitive Analysis
- 12.1 Companies profiled
- Companies covered
- 12.2 Market positioning of companies
- Matrix on companies position and classification
- 12.3 Bettergy Corp.
- Bettergy Corp. - Overview
- Bettergy Corp. - Product / Service
- Bettergy Corp. - Key offerings
- 12.4 CIC energiGUNE
- CIC energiGUNE - Overview
- CIC energiGUNE - Product / Service
- CIC energiGUNE - Key offerings
- 12.5 Gelion Technologies Pty Ltd.
- Gelion Technologies Pty Ltd. - Overview
- Gelion Technologies Pty Ltd. - Product / Service
- Gelion Technologies Pty Ltd. - Key offerings
- 12.6 Giner Inc.
- Giner Inc. - Overview
- Giner Inc. - Product / Service
- Giner Inc. - Key offerings
- 12.7 Ilika
- Ilika - Overview
- Ilika - Product / Service
- Ilika - Key offerings
- 12.8 Iolitec Ionic Liquids Technologies GmbH
- Iolitec Ionic Liquids Technologies GmbH - Overview
- Iolitec Ionic Liquids Technologies GmbH - Product / Service
- Iolitec Ionic Liquids Technologies GmbH - Key offerings
- 12.9 LG Chem Ltd.
- LG Chem Ltd. - Overview
- LG Chem Ltd. - Business segments
- LG Chem Ltd. - Key news
- LG Chem Ltd. - Key offerings
- LG Chem Ltd. - Segment focus
- 12.10 Li-S Energy Ltd.
- Li-S Energy Ltd. - Overview
- Li-S Energy Ltd. - Product / Service
- Li-S Energy Ltd. - Key offerings
- 12.11 Lyten Inc.
- Lyten Inc. - Overview
- Lyten Inc. - Product / Service
- Lyten Inc. - Key offerings
- 12.12 Merck KGaA
- Merck KGaA - Overview
- Merck KGaA - Business segments
- Merck KGaA - Key news
- Merck KGaA - Key offerings
- Merck KGaA - Segment focus
- 12.13 NexTech Batteries
- NexTech Batteries - Overview
- NexTech Batteries - Product / Service
- NexTech Batteries - Key offerings
- 12.14 Poly Plus Battery Co.
- Poly Plus Battery Co. - Overview
- Poly Plus Battery Co. - Product / Service
- Poly Plus Battery Co. - Key offerings
- 12.15 Sion Power Corp.
- Sion Power Corp. - Overview
- Sion Power Corp. - Product / Service
- Sion Power Corp. - Key offerings
- 12.16 Solid State PLC
- Solid State PLC - Overview
- Solid State PLC - Product / Service
- Solid State PLC - Key offerings
- 12.17 TRU Group Inc.
- TRU Group Inc. - Overview
- TRU Group Inc. - Product / Service
- TRU Group Inc. - Key offerings
13 Appendix
- 13.1 Scope of the report
- 13.2 Inclusions and exclusions checklist
- Inclusions checklist
- Exclusions checklist
- 13.3 Currency conversion rates for US$
- Currency conversion rates for US$
- 13.4 Research methodology
- Research methodology
- 13.5 Data procurement
- Information sources
- 13.6 Data validation
- Data validation
- 13.7 Validation techniques employed for market sizing
- Validation techniques employed for market sizing
- 13.8 Data synthesis
- Data synthesis
- 13.9 360 degree market analysis
- 360 degree market analysis
- 13.10 List of abbreviations
- List of abbreviations

