|
|
市場調査レポート
商品コード
1558585
移動式発電所の世界市場、2024年~2028年Global Mobile Power Plant Market 2024-2028 |
||||||

|
|||||||
カスタマイズ可能
|
|||||||

| 移動式発電所の世界市場、2024年~2028年 |
|
出版日: 2024年08月19日
発行: TechNavio
ページ情報: 英文 168 Pages
納期: 即納可能
|

全表示
- 概要
- 図表
- 目次
移動式発電所市場は2023-2028年に3億9,600万米ドル、予測期間中のCAGRは4.36%で成長すると予測されます。
当レポートでは、移動式発電所市場の全体的な分析、市場規模・予測、動向、成長促進要因、課題、約25のベンダーを網羅したベンダー分析などを掲載しています。
現在の市場シナリオ、最新動向と促進要因、市場環境全体に関する最新分析を提供しています。自然災害時の非常用電源需要の増加、インフラ活動の活発化、鉱業・石油・ガス産業からの需要増などが市場を牽引しています。
| 市場範囲 | |
|---|---|
| 基準年 | 2024 |
| 終了年 | 2028 |
| 予測期間 | 2024-2028 |
| 成長モメンタム | 加速 |
| 前年比2024年 | 4.11% |
| CAGR | 4.36% |
| 増分額 | 3億9,600万米ドル |
本調査では、浮体式洋上風力発電の開発が、今後数年間の移動式発電所市場成長を牽引する主要因の1つであるとしています。また、農村部の電化のための移動式発電所の採用が増加し、電力購入契約の数が増加していることも、市場の大きな需要につながります。
目次
第1章 エグゼクティブサマリー
- 市場概要
第2章 市場情勢
- 市場エコシステム
- 市場の特徴
- バリューチェーン分析
第3章 市場規模の評価
- 市場の定義
- 市場セグメント分析
- 市場規模 2023
- 市場の見通し 2023-2028
第4章 市場規模実績
- 移動式発電所の世界市場 2018-2022
- 燃料タイプ別セグメント分析 2018-2022
- 用途別セグメント分析 2018-2022
- 地域別セグメント分析 2018-2022
- 国別セグメント分析 2018-2022
第5章 ファイブフォース分析
- ファイブフォースの要約
- 買い手の交渉力
- 供給企業の交渉力
- 新規参入業者の脅威
- 代替品の脅威
- 競争の脅威
- 市況
第6章 市場セグメンテーション:燃料タイプ別
- 市場セグメンテーション
- 比較:燃料タイプ別
- 天然ガス:市場規模と予測 2023-2028
- ディーゼル:市場規模と予測 2023-2028
- その他:市場規模と予測 2023-2028
- 市場機会:燃料タイプ別
第7章 市場セグメンテーション:用途別
- 市場セグメンテーション
- 比較:用途別
- 非常用電源:市場規模と予測 2023-2028
- 石油・ガス:市場規模と予測 2023-2028
- 遠隔地の電化:市場規模と予測 2023-2028
- その他:市場規模と予測 2023-2028
- 市場機会:用途別
第8章 顧客情勢
- 顧客情勢の概要
第9章 地域別情勢
- 地域別セグメンテーション
- 地域別比較
- 北米:市場規模と予測 2023-2028
- アジア太平洋:市場規模と予測 2023-2028
- 欧州:市場規模と予測 2023-2028
- 中東・アフリカ:市場規模と予測 2023-2028
- 南米:市場規模と予測 2023-2028
- 米国:市場規模と予測 2023-2028
- 中国:市場規模と予測 2023-2028
- ドイツ:市場規模と予測 2023-2028
- 日本:市場規模と予測 2023-2028
- インド:市場規模と予測 2023-2028
- 市場機会:地域情勢別
第10章 促進要因・課題・機会・抑制要因
- 市場促進要因
- 市場の課題
- 促進要因と課題の影響
- 市場の機会・抑制要因
第11章 競合情勢
- 概要
- 競合情勢
- 混乱の状況
- 業界のリスク
第12章 競合分析
- 企業プロファイル
- 企業の市場ポジショニング
- American Electric Power Company Inc.
- ATLAS Corp.
- Caterpillar Inc.
- Dynamis Power Solutions
- EthosEnergy Group Ltd.
- FERROPLAN OY
- General Electric Co.
- Kawasaki Heavy Industries Ltd.
- MAPNA Group Co.
- Meidensha Corp.
- Mitsubishi Heavy Industries Ltd.
- MTU Aero Engines AG
- Mytilineos S.A.
- Siemens AG
- Turbine Technology Services Corp.
第13章 付録
Exhibits:
- Exhibits1: Executive Summary - Chart on Market Overview
- Exhibits2: Executive Summary - Data Table on Market Overview
- Exhibits3: Executive Summary - Chart on Global Market Characteristics
- Exhibits4: Executive Summary - Chart on Market By Geographical Landscape
- Exhibits5: Executive Summary - Chart on Market Segmentation by Fuel Type
- Exhibits6: Executive Summary - Chart on Market Segmentation by Application
- Exhibits7: Executive Summary - Chart on Incremental Growth
- Exhibits8: Executive Summary - Data Table on Incremental Growth
- Exhibits9: Executive Summary - Chart on Company Market Positioning
- Exhibits10: Parent Market
- Exhibits11: Data Table on - Parent Market
- Exhibits12: Market characteristics analysis
- Exhibits13: Value Chain Analysis
- Exhibits14: Offerings of companies included in the market definition
- Exhibits15: Market segments
- Exhibits16: Chart on Global - Market size and forecast 2023-2028 ($ million)
- Exhibits17: Data Table on Global - Market size and forecast 2023-2028 ($ million)
- Exhibits18: Chart on Global Market: Year-over-year growth 2023-2028 (%)
- Exhibits19: Data Table on Global Market: Year-over-year growth 2023-2028 (%)
- Exhibits20: Historic Market Size - Data Table on Global Mobile Power Plant Market 2018 - 2022 ($ million)
- Exhibits21: Historic Market Size - Fuel Type Segment 2018 - 2022 ($ million)
- Exhibits22: Historic Market Size - Application Segment 2018 - 2022 ($ million)
- Exhibits23: Historic Market Size - Geography Segment 2018 - 2022 ($ million)
- Exhibits24: Historic Market Size - Country Segment 2018 - 2022 ($ million)
- Exhibits25: Five forces analysis - Comparison between 2023 and 2028
- Exhibits26: Bargaining power of buyers - Impact of key factors 2023 and 2028
- Exhibits27: Bargaining power of suppliers - Impact of key factors in 2023 and 2028
- Exhibits28: Threat of new entrants - Impact of key factors in 2023 and 2028
- Exhibits29: Threat of substitutes - Impact of key factors in 2023 and 2028
- Exhibits30: Threat of rivalry - Impact of key factors in 2023 and 2028
- Exhibits31: Chart on Market condition - Five forces 2023 and 2028
- Exhibits32: Chart on Fuel Type - Market share 2023-2028 (%)
- Exhibits33: Data Table on Fuel Type - Market share 2023-2028 (%)
- Exhibits34: Chart on Comparison by Fuel Type
- Exhibits35: Data Table on Comparison by Fuel Type
- Exhibits36: Chart on Natural gas - Market size and forecast 2023-2028 ($ million)
- Exhibits37: Data Table on Natural gas - Market size and forecast 2023-2028 ($ million)
- Exhibits38: Chart on Natural gas - Year-over-year growth 2023-2028 (%)
- Exhibits39: Data Table on Natural gas - Year-over-year growth 2023-2028 (%)
- Exhibits40: Chart on Diesel - Market size and forecast 2023-2028 ($ million)
- Exhibits41: Data Table on Diesel - Market size and forecast 2023-2028 ($ million)
- Exhibits42: Chart on Diesel - Year-over-year growth 2023-2028 (%)
- Exhibits43: Data Table on Diesel - Year-over-year growth 2023-2028 (%)
- Exhibits44: Chart on Others - Market size and forecast 2023-2028 ($ million)
- Exhibits45: Data Table on Others - Market size and forecast 2023-2028 ($ million)
- Exhibits46: Chart on Others - Year-over-year growth 2023-2028 (%)
- Exhibits47: Data Table on Others - Year-over-year growth 2023-2028 (%)
- Exhibits48: Market opportunity by Fuel Type ($ million)
- Exhibits49: Data Table on Market opportunity by Fuel Type ($ million)
- Exhibits50: Chart on Application - Market share 2023-2028 (%)
- Exhibits51: Data Table on Application - Market share 2023-2028 (%)
- Exhibits52: Chart on Comparison by Application
- Exhibits53: Data Table on Comparison by Application
- Exhibits54: Chart on Emergency power - Market size and forecast 2023-2028 ($ million)
- Exhibits55: Data Table on Emergency power - Market size and forecast 2023-2028 ($ million)
- Exhibits56: Chart on Emergency power - Year-over-year growth 2023-2028 (%)
- Exhibits57: Data Table on Emergency power - Year-over-year growth 2023-2028 (%)
- Exhibits58: Chart on Oil and gas - Market size and forecast 2023-2028 ($ million)
- Exhibits59: Data Table on Oil and gas - Market size and forecast 2023-2028 ($ million)
- Exhibits60: Chart on Oil and gas - Year-over-year growth 2023-2028 (%)
- Exhibits61: Data Table on Oil and gas - Year-over-year growth 2023-2028 (%)
- Exhibits62: Chart on Remote area electrification - Market size and forecast 2023-2028 ($ million)
- Exhibits63: Data Table on Remote area electrification - Market size and forecast 2023-2028 ($ million)
- Exhibits64: Chart on Remote area electrification - Year-over-year growth 2023-2028 (%)
- Exhibits65: Data Table on Remote area electrification - Year-over-year growth 2023-2028 (%)
- Exhibits66: Chart on Others - Market size and forecast 2023-2028 ($ million)
- Exhibits67: Data Table on Others - Market size and forecast 2023-2028 ($ million)
- Exhibits68: Chart on Others - Year-over-year growth 2023-2028 (%)
- Exhibits69: Data Table on Others - Year-over-year growth 2023-2028 (%)
- Exhibits70: Market opportunity by Application ($ million)
- Exhibits71: Data Table on Market opportunity by Application ($ million)
- Exhibits72: Analysis of price sensitivity, lifecycle, customer purchase basket, adoption rates, and purchase criteria
- Exhibits73: Chart on Market share By Geographical Landscape 2023-2028 (%)
- Exhibits74: Data Table on Market share By Geographical Landscape 2023-2028 (%)
- Exhibits75: Chart on Geographic comparison
- Exhibits76: Data Table on Geographic comparison
- Exhibits77: Chart on North America - Market size and forecast 2023-2028 ($ million)
- Exhibits78: Data Table on North America - Market size and forecast 2023-2028 ($ million)
- Exhibits79: Chart on North America - Year-over-year growth 2023-2028 (%)
- Exhibits80: Data Table on North America - Year-over-year growth 2023-2028 (%)
- Exhibits81: Chart on APAC - Market size and forecast 2023-2028 ($ million)
- Exhibits82: Data Table on APAC - Market size and forecast 2023-2028 ($ million)
- Exhibits83: Chart on APAC - Year-over-year growth 2023-2028 (%)
- Exhibits84: Data Table on APAC - Year-over-year growth 2023-2028 (%)
- Exhibits85: Chart on Europe - Market size and forecast 2023-2028 ($ million)
- Exhibits86: Data Table on Europe - Market size and forecast 2023-2028 ($ million)
- Exhibits87: Chart on Europe - Year-over-year growth 2023-2028 (%)
- Exhibits88: Data Table on Europe - Year-over-year growth 2023-2028 (%)
- Exhibits89: Chart on Middle East and Africa - Market size and forecast 2023-2028 ($ million)
- Exhibits90: Data Table on Middle East and Africa - Market size and forecast 2023-2028 ($ million)
- Exhibits91: Chart on Middle East and Africa - Year-over-year growth 2023-2028 (%)
- Exhibits92: Data Table on Middle East and Africa - Year-over-year growth 2023-2028 (%)
- Exhibits93: Chart on South America - Market size and forecast 2023-2028 ($ million)
- Exhibits94: Data Table on South America - Market size and forecast 2023-2028 ($ million)
- Exhibits95: Chart on South America - Year-over-year growth 2023-2028 (%)
- Exhibits96: Data Table on South America - Year-over-year growth 2023-2028 (%)
- Exhibits97: Chart on US - Market size and forecast 2023-2028 ($ million)
- Exhibits98: Data Table on US - Market size and forecast 2023-2028 ($ million)
- Exhibits99: Chart on US - Year-over-year growth 2023-2028 (%)
- Exhibits100: Data Table on US - Year-over-year growth 2023-2028 (%)
- Exhibits101: Chart on China - Market size and forecast 2023-2028 ($ million)
- Exhibits102: Data Table on China - Market size and forecast 2023-2028 ($ million)
- Exhibits103: Chart on China - Year-over-year growth 2023-2028 (%)
- Exhibits104: Data Table on China - Year-over-year growth 2023-2028 (%)
- Exhibits105: Chart on Germany - Market size and forecast 2023-2028 ($ million)
- Exhibits106: Data Table on Germany - Market size and forecast 2023-2028 ($ million)
- Exhibits107: Chart on Germany - Year-over-year growth 2023-2028 (%)
- Exhibits108: Data Table on Germany - Year-over-year growth 2023-2028 (%)
- Exhibits109: Chart on Japan - Market size and forecast 2023-2028 ($ million)
- Exhibits110: Data Table on Japan - Market size and forecast 2023-2028 ($ million)
- Exhibits111: Chart on Japan - Year-over-year growth 2023-2028 (%)
- Exhibits112: Data Table on Japan - Year-over-year growth 2023-2028 (%)
- Exhibits113: Chart on India - Market size and forecast 2023-2028 ($ million)
- Exhibits114: Data Table on India - Market size and forecast 2023-2028 ($ million)
- Exhibits115: Chart on India - Year-over-year growth 2023-2028 (%)
- Exhibits116: Data Table on India - Year-over-year growth 2023-2028 (%)
- Exhibits117: Market opportunity By Geographical Landscape ($ million)
- Exhibits118: Data Tables on Market opportunity By Geographical Landscape ($ million)
- Exhibits119: Impact of drivers and challenges in 2023 and 2028
- Exhibits120: Overview on criticality of inputs and factors of differentiation
- Exhibits121: Overview on factors of disruption
- Exhibits122: Impact of key risks on business
- Exhibits123: Companies covered
- Exhibits124: Matrix on companies position and classification
- Exhibits125: American Electric Power Company Inc. - Overview
- Exhibits126: American Electric Power Company Inc. - Product / Service
- Exhibits127: American Electric Power Company Inc. - Key offerings
- Exhibits128: ATLAS Corp. - Overview
- Exhibits129: ATLAS Corp. - Business segments
- Exhibits130: ATLAS Corp. - Key offerings
- Exhibits131: ATLAS Corp. - Segment focus
- Exhibits132: Caterpillar Inc. - Overview
- Exhibits133: Caterpillar Inc. - Business segments
- Exhibits134: Caterpillar Inc. - Key news
- Exhibits135: Caterpillar Inc. - Key offerings
- Exhibits136: Caterpillar Inc. - Segment focus
- Exhibits137: Dynamis Power Solutions - Overview
- Exhibits138: Dynamis Power Solutions - Product / Service
- Exhibits139: Dynamis Power Solutions - Key offerings
- Exhibits140: EthosEnergy Group Ltd. - Overview
- Exhibits141: EthosEnergy Group Ltd. - Product / Service
- Exhibits142: EthosEnergy Group Ltd. - Key offerings
- Exhibits143: FERROPLAN OY - Overview
- Exhibits144: FERROPLAN OY - Product / Service
- Exhibits145: FERROPLAN OY - Key offerings
- Exhibits146: General Electric Co. - Overview
- Exhibits147: General Electric Co. - Business segments
- Exhibits148: General Electric Co. - Key news
- Exhibits149: General Electric Co. - Key offerings
- Exhibits150: General Electric Co. - Segment focus
- Exhibits151: Kawasaki Heavy Industries Ltd. - Overview
- Exhibits152: Kawasaki Heavy Industries Ltd. - Business segments
- Exhibits153: Kawasaki Heavy Industries Ltd. - Key news
- Exhibits154: Kawasaki Heavy Industries Ltd. - Key offerings
- Exhibits155: Kawasaki Heavy Industries Ltd. - Segment focus
- Exhibits156: MAPNA Group Co. - Overview
- Exhibits157: MAPNA Group Co. - Product / Service
- Exhibits158: MAPNA Group Co. - Key offerings
- Exhibits159: Meidensha Corp. - Overview
- Exhibits160: Meidensha Corp. - Business segments
- Exhibits161: Meidensha Corp. - Key news
- Exhibits162: Meidensha Corp. - Key offerings
- Exhibits163: Meidensha Corp. - Segment focus
- Exhibits164: Mitsubishi Heavy Industries Ltd. - Overview
- Exhibits165: Mitsubishi Heavy Industries Ltd. - Business segments
- Exhibits166: Mitsubishi Heavy Industries Ltd. - Key news
- Exhibits167: Mitsubishi Heavy Industries Ltd. - Key offerings
- Exhibits168: Mitsubishi Heavy Industries Ltd. - Segment focus
- Exhibits169: MTU Aero Engines AG - Overview
- Exhibits170: MTU Aero Engines AG - Business segments
- Exhibits171: MTU Aero Engines AG - Key offerings
- Exhibits172: MTU Aero Engines AG - Segment focus
- Exhibits173: Mytilineos S.A. - Overview
- Exhibits174: Mytilineos S.A. - Product / Service
- Exhibits175: Mytilineos S.A. - Key offerings
- Exhibits176: Siemens AG - Overview
- Exhibits177: Siemens AG - Business segments
- Exhibits178: Siemens AG - Key news
- Exhibits179: Siemens AG - Key offerings
- Exhibits180: Siemens AG - Segment focus
- Exhibits181: Turbine Technology Services Corp. - Overview
- Exhibits182: Turbine Technology Services Corp. - Product / Service
- Exhibits183: Turbine Technology Services Corp. - Key offerings
- Exhibits184: Inclusions checklist
- Exhibits185: Exclusions checklist
- Exhibits186: Currency conversion rates for US$
- Exhibits187: Research methodology
- Exhibits188: Information sources
- Exhibits189: Data validation
- Exhibits190: Validation techniques employed for market sizing
- Exhibits191: Data synthesis
- Exhibits192: 360 degree market analysis
- Exhibits193: List of abbreviations
The mobile power plant market is forecasted to grow by USD 396 mn during 2023-2028, accelerating at a CAGR of 4.36% during the forecast period. The report on the mobile power plant market provides a holistic analysis, market size and forecast, trends, growth drivers, and challenges, as well as vendor analysis covering around 25 vendors.
The report offers an up-to-date analysis regarding the current market scenario, the latest trends and drivers, and the overall market environment. The market is driven by increasing demand for emergency power during natural disasters, increasing infrastructural activities, and rising demand from mining and oil and gas industry.
Technavio's mobile power plant market is segmented as below:
| Market Scope | |
|---|---|
| Base Year | 2024 |
| End Year | 2028 |
| Series Year | 2024-2028 |
| Growth Momentum | Accelerate |
| YOY 2024 | 4.11% |
| CAGR | 4.36% |
| Incremental Value | $396 mn |
By Fuel Type
- Natural gas
- Diesel
- Others
By Application
- Emergency power
- Oil and gas
- Remote area electrification
- Others
By Geographical Landscape
- North America
- APAC
- Europe
- Middle East and Africa
- South America
This study identifies the development of floating offshore wind as one of the prime reasons driving the mobile power plant market growth during the next few years. Also, growing adoption of mobile power plants for rural electrification and increasing number of power purchase agreements will lead to sizable demand in the market.
The report on the mobile power plant market covers the following areas:
- Mobile power plant market sizing
- Mobile power plant market forecast
- Mobile power plant market industry analysis
The robust vendor analysis is designed to help clients improve their market position, and in line with this, this report provides a detailed analysis of several leading mobile power plant market vendors that include American Electric Power Co., ATLAS Corp., Caterpillar Inc., Dynamis Power Solutions, EthosEnergy Group Ltd., FERROPLAN OY, General Electric Co., Kawasaki Heavy Industries Ltd., Korindo Energy, MAPNA Group Co., Meidensha Corp., Mitsubishi Heavy Industries Ltd., MTU Aero Engines AG, Mytilineos S.A., Porsche Automobil Holding SE, Siemens AG, and Turbine Technology Services Corp.. Also, the mobile power plant market analysis report includes information on upcoming trends and challenges that will influence market growth. This is to help companies strategize and leverage all forthcoming growth opportunities.
The study was conducted using an objective combination of primary and secondary information including inputs from key participants in the industry. The report contains a comprehensive market and vendor landscape in addition to an analysis of the key vendors.
The publisher presents a detailed picture of the market by the way of study, synthesis, and summation of data from multiple sources by an analysis of key parameters such as profit, pricing, competition, and promotions. It presents various market facets by identifying the key industry influencers. The data presented is comprehensive, reliable, and a result of extensive research - both primary and secondary. The market research reports provide a complete competitive landscape and an in-depth vendor selection methodology and analysis using qualitative and quantitative research to forecast the accurate market growth.
Table of Contents
1 Executive Summary
- 1.1 Market overview
- Executive Summary - Chart on Market Overview
- Executive Summary - Data Table on Market Overview
- Executive Summary - Chart on Global Market Characteristics
- Executive Summary - Chart on Market By Geographical Landscape
- Executive Summary - Chart on Market Segmentation by Fuel Type
- Executive Summary - Chart on Market Segmentation by Application
- Executive Summary - Chart on Incremental Growth
- Executive Summary - Data Table on Incremental Growth
- Executive Summary - Chart on Company Market Positioning
2 Market Landscape
- 2.1 Market ecosystem
- Parent Market
- Data Table on - Parent Market
- 2.2 Market characteristics
- Market characteristics analysis
- 2.3 Value chain analysis
- Value Chain Analysis
3 Market Sizing
- 3.1 Market definition
- Offerings of companies included in the market definition
- 3.2 Market segment analysis
- Market segments
- 3.3 Market size 2023
- 3.4 Market outlook: Forecast for 2023-2028
- Chart on Global - Market size and forecast 2023-2028 ($ million)
- Data Table on Global - Market size and forecast 2023-2028 ($ million)
- Chart on Global Market: Year-over-year growth 2023-2028 (%)
- Data Table on Global Market: Year-over-year growth 2023-2028 (%)
4 Historic Market Size
- 4.1 Global Mobile Power Plant Market 2018 - 2022
- Historic Market Size - Data Table on Global Mobile Power Plant Market 2018 - 2022 ($ million)
- 4.2 Fuel Type segment analysis 2018 - 2022
- Historic Market Size - Fuel Type Segment 2018 - 2022 ($ million)
- 4.3 Application segment analysis 2018 - 2022
- Historic Market Size - Application Segment 2018 - 2022 ($ million)
- 4.4 Geography segment analysis 2018 - 2022
- Historic Market Size - Geography Segment 2018 - 2022 ($ million)
- 4.5 Country segment analysis 2018 - 2022
- Historic Market Size - Country Segment 2018 - 2022 ($ million)
5 Five Forces Analysis
- 5.1 Five forces summary
- Five forces analysis - Comparison between 2023 and 2028
- 5.2 Bargaining power of buyers
- Bargaining power of buyers - Impact of key factors 2023 and 2028
- 5.3 Bargaining power of suppliers
- Bargaining power of suppliers - Impact of key factors in 2023 and 2028
- 5.4 Threat of new entrants
- Threat of new entrants - Impact of key factors in 2023 and 2028
- 5.5 Threat of substitutes
- Threat of substitutes - Impact of key factors in 2023 and 2028
- 5.6 Threat of rivalry
- Threat of rivalry - Impact of key factors in 2023 and 2028
- 5.7 Market condition
- Chart on Market condition - Five forces 2023 and 2028
6 Market Segmentation by Fuel Type
- 6.1 Market segments
- Chart on Fuel Type - Market share 2023-2028 (%)
- Data Table on Fuel Type - Market share 2023-2028 (%)
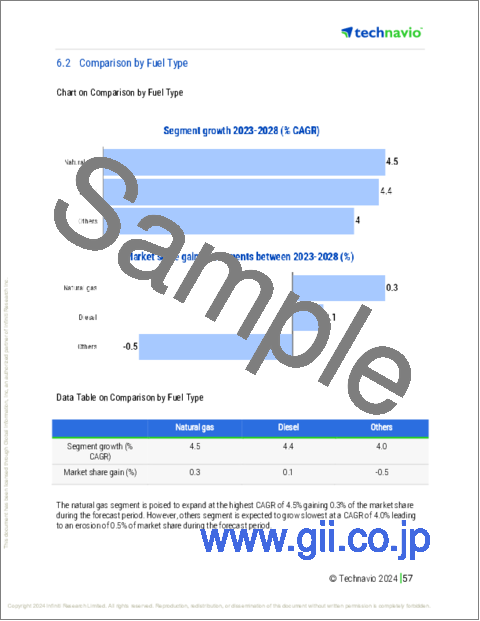
- 6.2 Comparison by Fuel Type
- Chart on Comparison by Fuel Type
- Data Table on Comparison by Fuel Type
- 6.3 Natural gas - Market size and forecast 2023-2028
- Chart on Natural gas - Market size and forecast 2023-2028 ($ million)
- Data Table on Natural gas - Market size and forecast 2023-2028 ($ million)
- Chart on Natural gas - Year-over-year growth 2023-2028 (%)
- Data Table on Natural gas - Year-over-year growth 2023-2028 (%)
- 6.4 Diesel - Market size and forecast 2023-2028
- Chart on Diesel - Market size and forecast 2023-2028 ($ million)
- Data Table on Diesel - Market size and forecast 2023-2028 ($ million)
- Chart on Diesel - Year-over-year growth 2023-2028 (%)
- Data Table on Diesel - Year-over-year growth 2023-2028 (%)
- 6.5 Others - Market size and forecast 2023-2028
- Chart on Others - Market size and forecast 2023-2028 ($ million)
- Data Table on Others - Market size and forecast 2023-2028 ($ million)
- Chart on Others - Year-over-year growth 2023-2028 (%)
- Data Table on Others - Year-over-year growth 2023-2028 (%)
- 6.6 Market opportunity by Fuel Type
- Market opportunity by Fuel Type ($ million)
- Data Table on Market opportunity by Fuel Type ($ million)
7 Market Segmentation by Application
- 7.1 Market segments
- Chart on Application - Market share 2023-2028 (%)
- Data Table on Application - Market share 2023-2028 (%)
- 7.2 Comparison by Application
- Chart on Comparison by Application
- Data Table on Comparison by Application
- 7.3 Emergency power - Market size and forecast 2023-2028
- Chart on Emergency power - Market size and forecast 2023-2028 ($ million)
- Data Table on Emergency power - Market size and forecast 2023-2028 ($ million)
- Chart on Emergency power - Year-over-year growth 2023-2028 (%)
- Data Table on Emergency power - Year-over-year growth 2023-2028 (%)
- 7.4 Oil and gas - Market size and forecast 2023-2028
- Chart on Oil and gas - Market size and forecast 2023-2028 ($ million)
- Data Table on Oil and gas - Market size and forecast 2023-2028 ($ million)
- Chart on Oil and gas - Year-over-year growth 2023-2028 (%)
- Data Table on Oil and gas - Year-over-year growth 2023-2028 (%)
- 7.5 Remote area electrification - Market size and forecast 2023-2028
- Chart on Remote area electrification - Market size and forecast 2023-2028 ($ million)
- Data Table on Remote area electrification - Market size and forecast 2023-2028 ($ million)
- Chart on Remote area electrification - Year-over-year growth 2023-2028 (%)
- Data Table on Remote area electrification - Year-over-year growth 2023-2028 (%)
- 7.6 Others - Market size and forecast 2023-2028
- Chart on Others - Market size and forecast 2023-2028 ($ million)
- Data Table on Others - Market size and forecast 2023-2028 ($ million)
- Chart on Others - Year-over-year growth 2023-2028 (%)
- Data Table on Others - Year-over-year growth 2023-2028 (%)
- 7.7 Market opportunity by Application
- Market opportunity by Application ($ million)
- Data Table on Market opportunity by Application ($ million)
8 Customer Landscape
- 8.1 Customer landscape overview
- Analysis of price sensitivity, lifecycle, customer purchase basket, adoption rates, and purchase criteria
9 Geographic Landscape
- 9.1 Geographic segmentation
- Chart on Market share By Geographical Landscape 2023-2028 (%)
- Data Table on Market share By Geographical Landscape 2023-2028 (%)
- 9.2 Geographic comparison
- Chart on Geographic comparison
- Data Table on Geographic comparison
- 9.3 North America - Market size and forecast 2023-2028
- Chart on North America - Market size and forecast 2023-2028 ($ million)
- Data Table on North America - Market size and forecast 2023-2028 ($ million)
- Chart on North America - Year-over-year growth 2023-2028 (%)
- Data Table on North America - Year-over-year growth 2023-2028 (%)
- 9.4 APAC - Market size and forecast 2023-2028
- Chart on APAC - Market size and forecast 2023-2028 ($ million)
- Data Table on APAC - Market size and forecast 2023-2028 ($ million)
- Chart on APAC - Year-over-year growth 2023-2028 (%)
- Data Table on APAC - Year-over-year growth 2023-2028 (%)
- 9.5 Europe - Market size and forecast 2023-2028
- Chart on Europe - Market size and forecast 2023-2028 ($ million)
- Data Table on Europe - Market size and forecast 2023-2028 ($ million)
- Chart on Europe - Year-over-year growth 2023-2028 (%)
- Data Table on Europe - Year-over-year growth 2023-2028 (%)
- 9.6 Middle East and Africa - Market size and forecast 2023-2028
- Chart on Middle East and Africa - Market size and forecast 2023-2028 ($ million)
- Data Table on Middle East and Africa - Market size and forecast 2023-2028 ($ million)
- Chart on Middle East and Africa - Year-over-year growth 2023-2028 (%)
- Data Table on Middle East and Africa - Year-over-year growth 2023-2028 (%)
- 9.7 South America - Market size and forecast 2023-2028
- Chart on South America - Market size and forecast 2023-2028 ($ million)
- Data Table on South America - Market size and forecast 2023-2028 ($ million)
- Chart on South America - Year-over-year growth 2023-2028 (%)
- Data Table on South America - Year-over-year growth 2023-2028 (%)
- 9.8 US - Market size and forecast 2023-2028
- Chart on US - Market size and forecast 2023-2028 ($ million)
- Data Table on US - Market size and forecast 2023-2028 ($ million)
- Chart on US - Year-over-year growth 2023-2028 (%)
- Data Table on US - Year-over-year growth 2023-2028 (%)
- 9.9 China - Market size and forecast 2023-2028
- Chart on China - Market size and forecast 2023-2028 ($ million)
- Data Table on China - Market size and forecast 2023-2028 ($ million)
- Chart on China - Year-over-year growth 2023-2028 (%)
- Data Table on China - Year-over-year growth 2023-2028 (%)
- 9.10 Germany - Market size and forecast 2023-2028
- Chart on Germany - Market size and forecast 2023-2028 ($ million)
- Data Table on Germany - Market size and forecast 2023-2028 ($ million)
- Chart on Germany - Year-over-year growth 2023-2028 (%)
- Data Table on Germany - Year-over-year growth 2023-2028 (%)
- 9.11 Japan - Market size and forecast 2023-2028
- Chart on Japan - Market size and forecast 2023-2028 ($ million)
- Data Table on Japan - Market size and forecast 2023-2028 ($ million)
- Chart on Japan - Year-over-year growth 2023-2028 (%)
- Data Table on Japan - Year-over-year growth 2023-2028 (%)
- 9.12 India - Market size and forecast 2023-2028
- Chart on India - Market size and forecast 2023-2028 ($ million)
- Data Table on India - Market size and forecast 2023-2028 ($ million)
- Chart on India - Year-over-year growth 2023-2028 (%)
- Data Table on India - Year-over-year growth 2023-2028 (%)
- 9.13 Market opportunity By Geographical Landscape
- Market opportunity By Geographical Landscape ($ million)
- Data Tables on Market opportunity By Geographical Landscape ($ million)
10 Drivers, Challenges, and Opportunity/Restraints
- 10.1 Market drivers
- 10.2 Market challenges
- 10.3 Impact of drivers and challenges
- Impact of drivers and challenges in 2023 and 2028
- 10.4 Market opportunities/restraints
11 Competitive Landscape
- 11.1 Overview
- 11.2 Competitive Landscape
- Overview on criticality of inputs and factors of differentiation
- 11.3 Landscape disruption
- Overview on factors of disruption
- 11.4 Industry risks
- Impact of key risks on business
12 Competitive Analysis
- 12.1 Companies profiled
- Companies covered
- 12.2 Market positioning of companies
- Matrix on companies position and classification
- 12.3 American Electric Power Company Inc.
- American Electric Power Company Inc. - Overview
- American Electric Power Company Inc. - Product / Service
- American Electric Power Company Inc. - Key offerings
- 12.4 ATLAS Corp.
- ATLAS Corp. - Overview
- ATLAS Corp. - Business segments
- ATLAS Corp. - Key offerings
- ATLAS Corp. - Segment focus
- 12.5 Caterpillar Inc.
- Caterpillar Inc. - Overview
- Caterpillar Inc. - Business segments
- Caterpillar Inc. - Key news
- Caterpillar Inc. - Key offerings
- Caterpillar Inc. - Segment focus
- 12.6 Dynamis Power Solutions
- Dynamis Power Solutions - Overview
- Dynamis Power Solutions - Product / Service
- Dynamis Power Solutions - Key offerings
- 12.7 EthosEnergy Group Ltd.
- EthosEnergy Group Ltd. - Overview
- EthosEnergy Group Ltd. - Product / Service
- EthosEnergy Group Ltd. - Key offerings
- 12.8 FERROPLAN OY
- FERROPLAN OY - Overview
- FERROPLAN OY - Product / Service
- FERROPLAN OY - Key offerings
- 12.9 General Electric Co.
- General Electric Co. - Overview
- General Electric Co. - Business segments
- General Electric Co. - Key news
- General Electric Co. - Key offerings
- General Electric Co. - Segment focus
- 12.10 Kawasaki Heavy Industries Ltd.
- Kawasaki Heavy Industries Ltd. - Overview
- Kawasaki Heavy Industries Ltd. - Business segments
- Kawasaki Heavy Industries Ltd. - Key news
- Kawasaki Heavy Industries Ltd. - Key offerings
- Kawasaki Heavy Industries Ltd. - Segment focus
- 12.11 MAPNA Group Co.
- MAPNA Group Co. - Overview
- MAPNA Group Co. - Product / Service
- MAPNA Group Co. - Key offerings
- 12.12 Meidensha Corp.
- Meidensha Corp. - Overview
- Meidensha Corp. - Business segments
- Meidensha Corp. - Key news
- Meidensha Corp. - Key offerings
- Meidensha Corp. - Segment focus
- 12.13 Mitsubishi Heavy Industries Ltd.
- Mitsubishi Heavy Industries Ltd. - Overview
- Mitsubishi Heavy Industries Ltd. - Business segments
- Mitsubishi Heavy Industries Ltd. - Key news
- Mitsubishi Heavy Industries Ltd. - Key offerings
- Mitsubishi Heavy Industries Ltd. - Segment focus
- 12.14 MTU Aero Engines AG
- MTU Aero Engines AG - Overview
- MTU Aero Engines AG - Business segments
- MTU Aero Engines AG - Key offerings
- MTU Aero Engines AG - Segment focus
- 12.15 Mytilineos S.A.
- Mytilineos S.A. - Overview
- Mytilineos S.A. - Product / Service
- Mytilineos S.A. - Key offerings
- 12.16 Siemens AG
- Siemens AG - Overview
- Siemens AG - Business segments
- Siemens AG - Key news
- Siemens AG - Key offerings
- Siemens AG - Segment focus
- 12.17 Turbine Technology Services Corp.
- Turbine Technology Services Corp. - Overview
- Turbine Technology Services Corp. - Product / Service
- Turbine Technology Services Corp. - Key offerings
13 Appendix
- 13.1 Scope of the report
- 13.2 Inclusions and exclusions checklist
- Inclusions checklist
- Exclusions checklist
- 13.3 Currency conversion rates for US$
- Currency conversion rates for US$
- 13.4 Research methodology
- Research methodology
- 13.5 Data procurement
- Information sources
- 13.6 Data validation
- Data validation
- 13.7 Validation techniques employed for market sizing
- Validation techniques employed for market sizing
- 13.8 Data synthesis
- Data synthesis
- 13.9 360 degree market analysis
- 360 degree market analysis
- 13.10 List of abbreviations
- List of abbreviations

