|
|
市場調査レポート
商品コード
1908895
燃料としてのガソリンの世界市場 2026-2030年Global Gasoline As A Fuel Market 2026-2030 |
||||||
|
|||||||
カスタマイズ可能
|
|||||||

| 燃料としてのガソリンの世界市場 2026-2030年 |
|
出版日: 2026年01月14日
発行: TechNavio
ページ情報: 英文 302 Pages
納期: 即納可能
|

概要
世界の燃料としてのガソリン市場は、2025年から2030年の間に1,336億米ドル規模で成長し、予測期間中のCAGRは1.4%と予測されております。
本報告書では、世界の燃料としてのガソリン市場に関する包括的な分析、市場規模と予測、動向、成長要因、課題に加え、約25社のベンダー分析を提供しております。
本レポートは、現在の市場状況、最新の動向と促進要因、市場環境全般に関する最新の分析を提供します。市場は、世界の自動車台数の増加、商業・産業用途におけるガソリンの採用拡大、発展途上国におけるエネルギー需要の増加によって牽引されています。
本調査は、業界の主要関係者からの情報を含む一次情報と二次情報を客観的に組み合わせて実施されました。本レポートには、主要企業の分析に加え、包括的な市場規模データ、地域別分析を伴うセグメント、ベンダー情勢が含まれています。レポートには過去データと予測データが掲載されています。
| 市場範囲 | |
|---|---|
| 基準年 | 2026年 |
| 終了年 | 2030年 |
| 予測期間 | 2026-2030 |
| 成長モメンタム | 加速 |
| 前年比2026年 | 1.4% |
| CAGR | 1.4% |
| 増分額 | 1,336億米ドル |
本調査では、今後数年間における世界の燃料としてのガソリン市場の成長を牽引する主な要因の一つとして、携帯型ガソリン発電機の利用増加を挙げております。また、フレキシブル燃料の普及拡大や、プレミアム燃料・高オクタン価燃料の台頭により、市場において相当な需要が見込まれます。
目次
第1章 エグゼクティブサマリー
- 市場概要
第2章 Technavio分析
- 価格・ライフサイクル・顧客購入バスケット・採用率・購入基準の分析
- インプットの重要性と差別化の要因
- 混乱の要因
- 促進要因と課題の影響
第3章 市場情勢
- 市場エコシステム
- 市場の特徴
- バリューチェーン分析
第4章 市場規模
- 市場の定義
- 市場セグメント分析
- 市場規模 2025
- 市場の見通し 2025-2030
第5章 市場規模実績
- 世界の燃料としてのガソリン市場 2020-2024
- 用途別セグメント分析 2020-2024
- 流通チャネルセグメント分析 2020-2024
- タイプセグメント分析 2020-2024
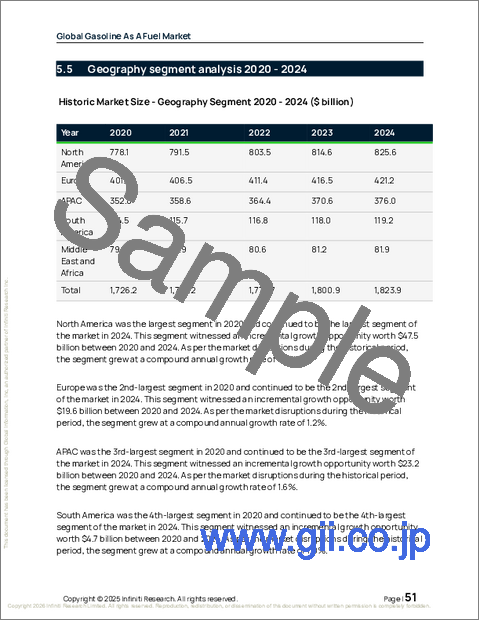
- 地域別セグメント分析 2020-2024
- 国別セグメント分析 2020-2024
第6章 定性分析
- AIの影響世界の燃料としてのガソリン市場
第7章 ファイブフォース分析
- ファイブフォースの要約
- 買い手の交渉力
- 供給企業の交渉力
- 新規参入業者の脅威
- 代替品の脅威
- 競争の脅威
- 市況
第8章 市場セグメンテーション:用途別
- 市場セグメント
- 比較:用途別
- 乗用車:市場規模と予測 2025-2030
- 商用車:市場規模と予測 2025-2030
- 小型エンジン:市場規模と予測 2025-2030
- 船舶用エンジン:市場規模と予測 2025-2030
- 市場機会:用途別
第9章 市場セグメンテーション:流通チャネル別
- 市場セグメント
- 比較:流通チャネル別
- 燃料スタンド:市場規模と予測 2025-2030
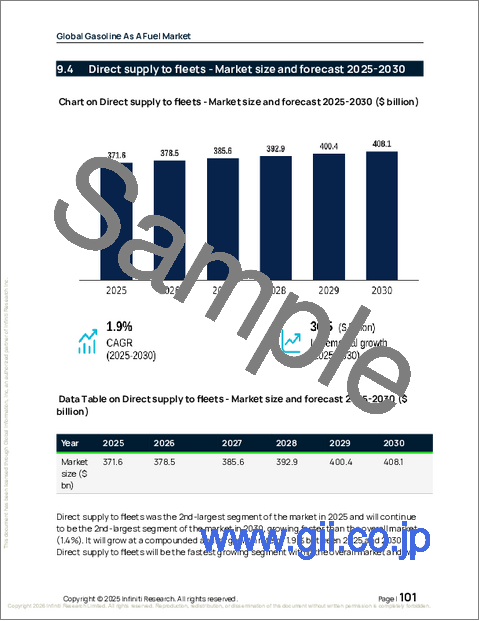
- フリートへの直接供給:市場規模と予測 2025-2030
- オンライン燃料配送サービス:市場規模と予測 2025-2030
- 市場機会:流通チャネル別
第10章 市場セグメンテーション:タイプ別
- 市場セグメント
- 比較:タイプ別
- 従来型ガソリン:市場規模と予測 2025-2030
- 再調整ガソリン:市場規模と予測 2025-2030
- 酸素添加ガソリン:市場規模と予測 2025-2030
- 市場機会:タイプ別
第11章 顧客情勢
- 顧客情勢の概要
第12章 地域別情勢
- 地域別セグメンテーション
- 地域別比較
- 北米:市場規模と予測 2025-2030
- 欧州:市場規模と予測 2025-2030
- アジア太平洋:市場規模と予測 2025-2030
- 南米:市場規模と予測 2025-2030
- 中東・アフリカ:市場規模と予測 2025-2030
- 市場機会:地域別
第13章 促進要因、課題、および機会
- 市場促進要因
- 市場の課題
- 促進要因と課題の影響
- 市場機会
第14章 競合情勢
- 概要
- 競合情勢
- 混乱の状況
- 業界のリスク
第15章 競合分析
- 企業プロファイル
- 企業ランキング指標
- 企業の市場ポジショニング
- BP Plc
- Chevron Corp.
- Emirates National Oil Co.
- Exxon Mobil Corp.
- Indian Oil Corp. Ltd.
- Kuwait Petroleum Corp.
- Marathon Petroleum Corp.
- PBF Energy Inc.
- PetroChina Co. Ltd.
- Petroleos de Venezuela SA
- Reliance Industries Ltd.
- Rosneft Oil Co.
- Saudi Arabian Oil Co.
- Shell plc
- Valero Energy Corp.

