|
|
市場調査レポート
商品コード
1583887
包装ココナッツミルクの世界市場 2024年~2028年Global Packaged Coconut Milk Market 2024-2028 |
||||||

|
|||||||
カスタマイズ可能
|
|||||||


| 包装ココナッツミルクの世界市場 2024年~2028年 |
|
出版日: 2024年09月04日
発行: TechNavio
ページ情報: 英文 158 Pages
納期: 即納可能
|

全表示
- 概要
- 図表
- 目次
包装ココナッツミルク市場は2023年~2028年に13億7,690万米ドル、予測期間中のCAGRは14.97%で成長すると予測されています。
当レポートでは、包装ココナッツミルク市場の全体的な分析、市場規模・予測、動向、成長促進要因、課題、約25のベンダーを網羅したベンダー分析などを掲載しています。
現在の市場シナリオ、最新動向と促進要因、市場環境全体に関する最新分析を提供しています。市場は、植物性ミルクへの旺盛な需要、包装ココナッツミルクの利点に関する意識の高まり、シングルサーブ、マルチパック、持続可能なパッケージへの需要の高まりによって牽引されています。
| 市場範囲 | |
|---|---|
| 基準年 | 2024 |
| 終了年 | 2028 |
| 予測期間 | 2024-2028 |
| 成長モメンタム | 加速 |
| 前年比2024年 | 11.54% |
| CAGR | 14.97% |
| 増分額 | 13億7,690万米ドル |
本調査では、今後数年間の包装ココナッツミルク市場成長を牽引する主な要因の一つとして、料理用途でのココナッツミルク使用の増加を挙げています。また、プライベートブランド包装ココナッツミルクの需要増加、オンライン販売とeコマースの普及拡大も市場の大きな需要につながります。
目次
第1章 エグゼクティブサマリー
- 市場概要
第2章 市場情勢
- 市場エコシステム
- 市場の特徴
- バリューチェーン分析
第3章 市場規模の評価
- 市場の定義
- 市場セグメント分析
- 市場規模 2023年
- 市場の見通し 2023年~2028年
第4章 市場規模実績
- 包装ココナッツミルクの世界市場 2018年~2022年
- 製品別セグメント分析 2018年~2022年
- 流通チャネル別セグメント分析 2018年~2022年
- 地域別セグメント分析 2018年~2022年
- 国別セグメント分析 2018年~2022年
第5章 ファイブフォース分析
- ファイブフォースの要約
- 買い手の交渉力
- 供給企業の交渉力
- 新規参入業者の脅威
- 代替品の脅威
- 競争の脅威
- 市況
第6章 製品別の市場セグメンテーション
- 市場セグメンテーション
- 比較:製品別
- 従来型:市場規模と予測 2023年~2028年
- オーガニック:市場規模と予測 2023年~2028年
- 製品別の市場機会
第7章 流通チャネル別市場セグメンテーション
- 市場セグメンテーション
- 比較:流通チャネル別
- スーパーマーケットとハイパーマーケット:市場規模と予測 2023年~2028年
- コンビニエンスストア:市場規模と予測 2023年~2028年
- オンライン小売:市場規模と予測 2023年~2028年
- その他:市場規模と予測 2023年~2028年
- 流通チャネル別の市場機会
第8章 顧客情勢
- 顧客情勢の概要
第9章 地域別情勢
- 地域別セグメンテーション
- 地域別比較
- 北米:市場規模と予測 2023年~2028年
- 欧州:市場規模と予測 2023年~2028年
- アジア太平洋:市場規模と予測 2023年~2028年
- 南米:市場規模と予測 2023年~2028年
- 中東・アフリカ:市場規模と予測 2023年~2028年
- 米国:市場規模と予測 2023年~2028年
- ドイツ:市場規模と予測 2023年~2028年
- フランス:市場規模と予測 2023年~2028年
- インド:市場規模と予測 2023年~2028年
- 英国:市場規模と予測 2023年~2028年
- 地域情勢別市場機会
第10章 促進要因・課題・機会・抑制要因
- 市場促進要因
- 市場の課題
- 促進要因と課題の影響
- 市場の機会・抑制要因
第11章 競合情勢
- 概要
- 競合情勢
- 混乱の状況
- 業界のリスク
第12章 競合分析
- 企業プロファイル
- 企業の市場ポジショニング
- Celebes Coconut Corp.
- Cocomi Bio Organic
- Dabur India Ltd.
- Danone SA
- Edward and Sons Trading Co.
- Goya Foods Inc.
- McCormick and Co. Inc.
- Merit Food Products Co. Ltd.
- Nestle SA
- PureHarvest
- Thai Agri Foods Public Co. Ltd.
- Thai Coconut Public Co. Ltd.
- The Coconut Co. UK Ltd.
- The Vita Coco Co. Inc.
- Theppadungporn Coconut Co. Ltd.
第13章 付録
Exhibits:
- Exhibits1: Executive Summary - Chart on Market Overview
- Exhibits2: Executive Summary - Data Table on Market Overview
- Exhibits3: Executive Summary - Chart on Global Market Characteristics
- Exhibits4: Executive Summary - Chart on Market By Geographical Landscape
- Exhibits5: Executive Summary - Chart on Market Segmentation by Product
- Exhibits6: Executive Summary - Chart on Market Segmentation by Distribution Channel
- Exhibits7: Executive Summary - Chart on Incremental Growth
- Exhibits8: Executive Summary - Data Table on Incremental Growth
- Exhibits9: Executive Summary - Chart on Company Market Positioning
- Exhibits10: Parent Market
- Exhibits11: Data Table on - Parent Market
- Exhibits12: Market characteristics analysis
- Exhibits13: Value Chain Analysis
- Exhibits14: Offerings of companies included in the market definition
- Exhibits15: Market segments
- Exhibits16: Chart on Global - Market size and forecast 2023-2028 ($ million)
- Exhibits17: Data Table on Global - Market size and forecast 2023-2028 ($ million)
- Exhibits18: Chart on Global Market: Year-over-year growth 2023-2028 (%)
- Exhibits19: Data Table on Global Market: Year-over-year growth 2023-2028 (%)
- Exhibits20: Historic Market Size - Data Table on Global Packaged Coconut Milk Market 2018 - 2022 ($ million)
- Exhibits21: Historic Market Size - Product Segment 2018 - 2022 ($ million)
- Exhibits22: Historic Market Size - Distribution Channel Segment 2018 - 2022 ($ million)
- Exhibits23: Historic Market Size - Geography Segment 2018 - 2022 ($ million)
- Exhibits24: Historic Market Size - Country Segment 2018 - 2022 ($ million)
- Exhibits25: Five forces analysis - Comparison between 2023 and 2028
- Exhibits26: Bargaining power of buyers - Impact of key factors 2023 and 2028
- Exhibits27: Bargaining power of suppliers - Impact of key factors in 2023 and 2028
- Exhibits28: Threat of new entrants - Impact of key factors in 2023 and 2028
- Exhibits29: Threat of substitutes - Impact of key factors in 2023 and 2028
- Exhibits30: Threat of rivalry - Impact of key factors in 2023 and 2028
- Exhibits31: Chart on Market condition - Five forces 2023 and 2028
- Exhibits32: Chart on Product - Market share 2023-2028 (%)
- Exhibits33: Data Table on Product - Market share 2023-2028 (%)
- Exhibits34: Chart on Comparison by Product
- Exhibits35: Data Table on Comparison by Product
- Exhibits36: Chart on Conventional - Market size and forecast 2023-2028 ($ million)
- Exhibits37: Data Table on Conventional - Market size and forecast 2023-2028 ($ million)
- Exhibits38: Chart on Conventional - Year-over-year growth 2023-2028 (%)
- Exhibits39: Data Table on Conventional - Year-over-year growth 2023-2028 (%)
- Exhibits40: Chart on Organic - Market size and forecast 2023-2028 ($ million)
- Exhibits41: Data Table on Organic - Market size and forecast 2023-2028 ($ million)
- Exhibits42: Chart on Organic - Year-over-year growth 2023-2028 (%)
- Exhibits43: Data Table on Organic - Year-over-year growth 2023-2028 (%)
- Exhibits44: Market opportunity by Product ($ million)
- Exhibits45: Data Table on Market opportunity by Product ($ million)
- Exhibits46: Chart on Distribution Channel - Market share 2023-2028 (%)
- Exhibits47: Data Table on Distribution Channel - Market share 2023-2028 (%)
- Exhibits48: Chart on Comparison by Distribution Channel
- Exhibits49: Data Table on Comparison by Distribution Channel
- Exhibits50: Chart on Supermarkets and hypermarkets - Market size and forecast 2023-2028 ($ million)
- Exhibits51: Data Table on Supermarkets and hypermarkets - Market size and forecast 2023-2028 ($ million)
- Exhibits52: Chart on Supermarkets and hypermarkets - Year-over-year growth 2023-2028 (%)
- Exhibits53: Data Table on Supermarkets and hypermarkets - Year-over-year growth 2023-2028 (%)
- Exhibits54: Chart on Convenience stores - Market size and forecast 2023-2028 ($ million)
- Exhibits55: Data Table on Convenience stores - Market size and forecast 2023-2028 ($ million)
- Exhibits56: Chart on Convenience stores - Year-over-year growth 2023-2028 (%)
- Exhibits57: Data Table on Convenience stores - Year-over-year growth 2023-2028 (%)
- Exhibits58: Chart on Online retail - Market size and forecast 2023-2028 ($ million)
- Exhibits59: Data Table on Online retail - Market size and forecast 2023-2028 ($ million)
- Exhibits60: Chart on Online retail - Year-over-year growth 2023-2028 (%)
- Exhibits61: Data Table on Online retail - Year-over-year growth 2023-2028 (%)
- Exhibits62: Chart on Others - Market size and forecast 2023-2028 ($ million)
- Exhibits63: Data Table on Others - Market size and forecast 2023-2028 ($ million)
- Exhibits64: Chart on Others - Year-over-year growth 2023-2028 (%)
- Exhibits65: Data Table on Others - Year-over-year growth 2023-2028 (%)
- Exhibits66: Market opportunity by Distribution Channel ($ million)
- Exhibits67: Data Table on Market opportunity by Distribution Channel ($ million)
- Exhibits68: Analysis of price sensitivity, lifecycle, customer purchase basket, adoption rates, and purchase criteria
- Exhibits69: Chart on Market share By Geographical Landscape 2023-2028 (%)
- Exhibits70: Data Table on Market share By Geographical Landscape 2023-2028 (%)
- Exhibits71: Chart on Geographic comparison
- Exhibits72: Data Table on Geographic comparison
- Exhibits73: Chart on North America - Market size and forecast 2023-2028 ($ million)
- Exhibits74: Data Table on North America - Market size and forecast 2023-2028 ($ million)
- Exhibits75: Chart on North America - Year-over-year growth 2023-2028 (%)
- Exhibits76: Data Table on North America - Year-over-year growth 2023-2028 (%)
- Exhibits77: Chart on Europe - Market size and forecast 2023-2028 ($ million)
- Exhibits78: Data Table on Europe - Market size and forecast 2023-2028 ($ million)
- Exhibits79: Chart on Europe - Year-over-year growth 2023-2028 (%)
- Exhibits80: Data Table on Europe - Year-over-year growth 2023-2028 (%)
- Exhibits81: Chart on APAC - Market size and forecast 2023-2028 ($ million)
- Exhibits82: Data Table on APAC - Market size and forecast 2023-2028 ($ million)
- Exhibits83: Chart on APAC - Year-over-year growth 2023-2028 (%)
- Exhibits84: Data Table on APAC - Year-over-year growth 2023-2028 (%)
- Exhibits85: Chart on South America - Market size and forecast 2023-2028 ($ million)
- Exhibits86: Data Table on South America - Market size and forecast 2023-2028 ($ million)
- Exhibits87: Chart on South America - Year-over-year growth 2023-2028 (%)
- Exhibits88: Data Table on South America - Year-over-year growth 2023-2028 (%)
- Exhibits89: Chart on Middle East and Africa - Market size and forecast 2023-2028 ($ million)
- Exhibits90: Data Table on Middle East and Africa - Market size and forecast 2023-2028 ($ million)
- Exhibits91: Chart on Middle East and Africa - Year-over-year growth 2023-2028 (%)
- Exhibits92: Data Table on Middle East and Africa - Year-over-year growth 2023-2028 (%)
- Exhibits93: Chart on US - Market size and forecast 2023-2028 ($ million)
- Exhibits94: Data Table on US - Market size and forecast 2023-2028 ($ million)
- Exhibits95: Chart on US - Year-over-year growth 2023-2028 (%)
- Exhibits96: Data Table on US - Year-over-year growth 2023-2028 (%)
- Exhibits97: Chart on Germany - Market size and forecast 2023-2028 ($ million)
- Exhibits98: Data Table on Germany - Market size and forecast 2023-2028 ($ million)
- Exhibits99: Chart on Germany - Year-over-year growth 2023-2028 (%)
- Exhibits100: Data Table on Germany - Year-over-year growth 2023-2028 (%)
- Exhibits101: Chart on France - Market size and forecast 2023-2028 ($ million)
- Exhibits102: Data Table on France - Market size and forecast 2023-2028 ($ million)
- Exhibits103: Chart on France - Year-over-year growth 2023-2028 (%)
- Exhibits104: Data Table on France - Year-over-year growth 2023-2028 (%)
- Exhibits105: Chart on India - Market size and forecast 2023-2028 ($ million)
- Exhibits106: Data Table on India - Market size and forecast 2023-2028 ($ million)
- Exhibits107: Chart on India - Year-over-year growth 2023-2028 (%)
- Exhibits108: Data Table on India - Year-over-year growth 2023-2028 (%)
- Exhibits109: Chart on UK - Market size and forecast 2023-2028 ($ million)
- Exhibits110: Data Table on UK - Market size and forecast 2023-2028 ($ million)
- Exhibits111: Chart on UK - Year-over-year growth 2023-2028 (%)
- Exhibits112: Data Table on UK - Year-over-year growth 2023-2028 (%)
- Exhibits113: Market opportunity By Geographical Landscape ($ million)
- Exhibits114: Data Tables on Market opportunity By Geographical Landscape ($ million)
- Exhibits115: Impact of drivers and challenges in 2023 and 2028
- Exhibits116: Overview on criticality of inputs and factors of differentiation
- Exhibits117: Overview on factors of disruption
- Exhibits118: Impact of key risks on business
- Exhibits119: Companies covered
- Exhibits120: Matrix on companies position and classification
- Exhibits121: Celebes Coconut Corp. - Overview
- Exhibits122: Celebes Coconut Corp. - Product / Service
- Exhibits123: Celebes Coconut Corp. - Key offerings
- Exhibits124: Cocomi Bio Organic - Overview
- Exhibits125: Cocomi Bio Organic - Product / Service
- Exhibits126: Cocomi Bio Organic - Key offerings
- Exhibits127: Dabur India Ltd. - Overview
- Exhibits128: Dabur India Ltd. - Business segments
- Exhibits129: Dabur India Ltd. - Key news
- Exhibits130: Dabur India Ltd. - Key offerings
- Exhibits131: Dabur India Ltd. - Segment focus
- Exhibits132: Danone SA - Overview
- Exhibits133: Danone SA - Business segments
- Exhibits134: Danone SA - Key news
- Exhibits135: Danone SA - Key offerings
- Exhibits136: Danone SA - Segment focus
- Exhibits137: Edward and Sons Trading Co. - Overview
- Exhibits138: Edward and Sons Trading Co. - Product / Service
- Exhibits139: Edward and Sons Trading Co. - Key offerings
- Exhibits140: Goya Foods Inc. - Overview
- Exhibits141: Goya Foods Inc. - Product / Service
- Exhibits142: Goya Foods Inc. - Key offerings
- Exhibits143: McCormick and Co. Inc. - Overview
- Exhibits144: McCormick and Co. Inc. - Business segments
- Exhibits145: McCormick and Co. Inc. - Key news
- Exhibits146: McCormick and Co. Inc. - Key offerings
- Exhibits147: McCormick and Co. Inc. - Segment focus
- Exhibits148: Merit Food Products Co. Ltd. - Overview
- Exhibits149: Merit Food Products Co. Ltd. - Product / Service
- Exhibits150: Merit Food Products Co. Ltd. - Key offerings
- Exhibits151: Nestle SA - Overview
- Exhibits152: Nestle SA - Business segments
- Exhibits153: Nestle SA - Key news
- Exhibits154: Nestle SA - Key offerings
- Exhibits155: Nestle SA - Segment focus
- Exhibits156: PureHarvest - Overview
- Exhibits157: PureHarvest - Product / Service
- Exhibits158: PureHarvest - Key offerings
- Exhibits159: Thai Agri Foods Public Co. Ltd. - Overview
- Exhibits160: Thai Agri Foods Public Co. Ltd. - Product / Service
- Exhibits161: Thai Agri Foods Public Co. Ltd. - Key offerings
- Exhibits162: Thai Coconut Public Co. Ltd. - Overview
- Exhibits163: Thai Coconut Public Co. Ltd. - Product / Service
- Exhibits164: Thai Coconut Public Co. Ltd. - Key offerings
- Exhibits165: The Coconut Co. UK Ltd. - Overview
- Exhibits166: The Coconut Co. UK Ltd. - Product / Service
- Exhibits167: The Coconut Co. UK Ltd. - Key offerings
- Exhibits168: The Vita Coco Co. Inc. - Overview
- Exhibits169: The Vita Coco Co. Inc. - Business segments
- Exhibits170: The Vita Coco Co. Inc. - Key offerings
- Exhibits171: The Vita Coco Co. Inc. - Segment focus
- Exhibits172: Theppadungporn Coconut Co. Ltd. - Overview
- Exhibits173: Theppadungporn Coconut Co. Ltd. - Product / Service
- Exhibits174: Theppadungporn Coconut Co. Ltd. - Key offerings
- Exhibits175: Inclusions checklist
- Exhibits176: Exclusions checklist
- Exhibits177: Currency conversion rates for US$
- Exhibits178: Research methodology
- Exhibits179: Information sources
- Exhibits180: Data validation
- Exhibits181: Validation techniques employed for market sizing
- Exhibits182: Data synthesis
- Exhibits183: 360 degree market analysis
- Exhibits184: List of abbreviations
The packaged coconut milk market is forecasted to grow by USD 1376.9 mn during 2023-2028, accelerating at a CAGR of 14.97% during the forecast period. The report on the packaged coconut milk market provides a holistic analysis, market size and forecast, trends, growth drivers, and challenges, as well as vendor analysis covering around 25 vendors.
The report offers an up-to-date analysis regarding the current market scenario, the latest trends and drivers, and the overall market environment. The market is driven by robust demand for plant-based milk, increasing awareness regarding benefits of packaged coconut milk, and increasing demand for single-serve, multi-packs, and sustainable packaging.
Technavio's packaged coconut milk market is segmented as below:
| Market Scope | |
|---|---|
| Base Year | 2024 |
| End Year | 2028 |
| Series Year | 2024-2028 |
| Growth Momentum | Accelerate |
| YOY 2024 | 11.54% |
| CAGR | 14.97% |
| Incremental Value | $1376.9 mn |
By Product
- Conventional
- Organic
By Distribution Channel
- Supermarkets and hypermarkets
- Convenience stores
- Online retail
- Others
By Geographical Landscape
- North America
- Europe
- APAC
- South America
- Middle East and Africa
This study identifies the increasing use of coconut milk in culinary applications as one of the prime reasons driving the packaged coconut milk market growth during the next few years. Also, increased demand for private-label packaged coconut milk and growing online sales and e-commerce penetration will lead to sizable demand in the market.
The report on the packaged coconut milk market covers the following areas:
- Packaged coconut milk market sizing
- Packaged coconut milk market forecast
- Packaged coconut milk market industry analysis
The robust vendor analysis is designed to help clients improve their market position, and in line with this, this report provides a detailed analysis of several leading packaged coconut milk market vendors that include Ahya Coco Organic Food Manufacturing Corp., Campbell Soup Co., Celebes Coconut Corp., Cocomi Bio Organic, Coconut Palm Group Ltd., Dabur India Ltd., Danone SA, Edward and Sons Trading Co., Goya Foods Inc., Heng Guan Food Industrial Pte Ltd., McCormick and Co. Inc., Merit Food Products Co. Ltd., Nestle SA, PureHarvest, Thai Agri Foods Public Co. Ltd., Thai Coconut Public Co. Ltd., The Coconut Co. UK Ltd., The Vita Coco Co. Inc., Theppadungporn Coconut Co. Ltd., and Urban Platter. Also, the packaged coconut milk market analysis report includes information on upcoming trends and challenges that will influence market growth. This is to help companies strategize and leverage all forthcoming growth opportunities.
The study was conducted using an objective combination of primary and secondary information including inputs from key participants in the industry. The report contains a comprehensive market and vendor landscape in addition to an analysis of the key vendors.
The publisher presents a detailed picture of the market by the way of study, synthesis, and summation of data from multiple sources by an analysis of key parameters such as profit, pricing, competition, and promotions. It presents various market facets by identifying the key industry influencers. The data presented is comprehensive, reliable, and a result of extensive primary and secondary research. The market research reports provide a complete competitive landscape and an in-depth vendor selection methodology and analysis using qualitative and quantitative research to forecast accurate market growth.
Table of Contents
1 Executive Summary
- 1.1 Market overview
- Executive Summary - Chart on Market Overview
- Executive Summary - Data Table on Market Overview
- Executive Summary - Chart on Global Market Characteristics
- Executive Summary - Chart on Market By Geographical Landscape
- Executive Summary - Chart on Market Segmentation by Product
- Executive Summary - Chart on Market Segmentation by Distribution Channel
- Executive Summary - Chart on Incremental Growth
- Executive Summary - Data Table on Incremental Growth
- Executive Summary - Chart on Company Market Positioning
2 Market Landscape
- 2.1 Market ecosystem
- Parent Market
- Data Table on - Parent Market
- 2.2 Market characteristics
- Market characteristics analysis
- 2.3 Value chain analysis
- Value Chain Analysis
3 Market Sizing
- 3.1 Market definition
- Offerings of companies included in the market definition
- 3.2 Market segment analysis
- Market segments
- 3.3 Market size 2023
- 3.4 Market outlook: Forecast for 2023-2028
- Chart on Global - Market size and forecast 2023-2028 ($ million)
- Data Table on Global - Market size and forecast 2023-2028 ($ million)
- Chart on Global Market: Year-over-year growth 2023-2028 (%)
- Data Table on Global Market: Year-over-year growth 2023-2028 (%)
4 Historic Market Size
- 4.1 Global Packaged Coconut Milk Market 2018 - 2022
- Historic Market Size - Data Table on Global Packaged Coconut Milk Market 2018 - 2022 ($ million)
- 4.2 Product segment analysis 2018 - 2022
- Historic Market Size - Product Segment 2018 - 2022 ($ million)
- 4.3 Distribution Channel segment analysis 2018 - 2022
- Historic Market Size - Distribution Channel Segment 2018 - 2022 ($ million)
- 4.4 Geography segment analysis 2018 - 2022
- Historic Market Size - Geography Segment 2018 - 2022 ($ million)
- 4.5 Country segment analysis 2018 - 2022
- Historic Market Size - Country Segment 2018 - 2022 ($ million)
5 Five Forces Analysis
- 5.1 Five forces summary
- Five forces analysis - Comparison between 2023 and 2028
- 5.2 Bargaining power of buyers
- Bargaining power of buyers - Impact of key factors 2023 and 2028
- 5.3 Bargaining power of suppliers
- Bargaining power of suppliers - Impact of key factors in 2023 and 2028
- 5.4 Threat of new entrants
- Threat of new entrants - Impact of key factors in 2023 and 2028
- 5.5 Threat of substitutes
- Threat of substitutes - Impact of key factors in 2023 and 2028
- 5.6 Threat of rivalry
- Threat of rivalry - Impact of key factors in 2023 and 2028
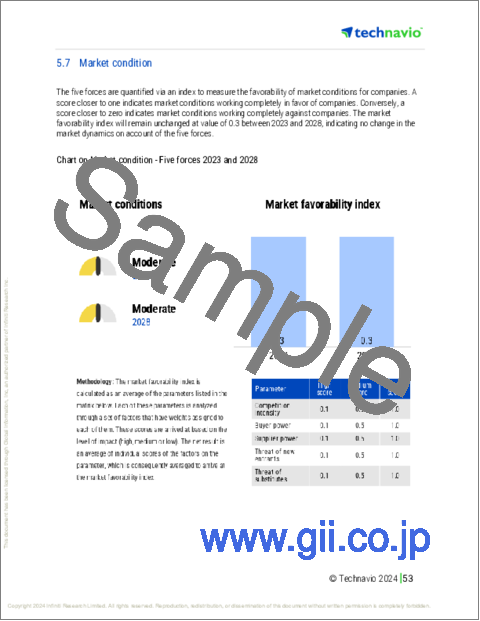
- 5.7 Market condition
- Chart on Market condition - Five forces 2023 and 2028
6 Market Segmentation by Product
- 6.1 Market segments
- Chart on Product - Market share 2023-2028 (%)
- Data Table on Product - Market share 2023-2028 (%)
- 6.2 Comparison by Product
- Chart on Comparison by Product
- Data Table on Comparison by Product
- 6.3 Conventional - Market size and forecast 2023-2028
- Chart on Conventional - Market size and forecast 2023-2028 ($ million)
- Data Table on Conventional - Market size and forecast 2023-2028 ($ million)
- Chart on Conventional - Year-over-year growth 2023-2028 (%)
- Data Table on Conventional - Year-over-year growth 2023-2028 (%)
- 6.4 Organic - Market size and forecast 2023-2028
- Chart on Organic - Market size and forecast 2023-2028 ($ million)
- Data Table on Organic - Market size and forecast 2023-2028 ($ million)
- Chart on Organic - Year-over-year growth 2023-2028 (%)
- Data Table on Organic - Year-over-year growth 2023-2028 (%)
- 6.5 Market opportunity by Product
- Market opportunity by Product ($ million)
- Data Table on Market opportunity by Product ($ million)
7 Market Segmentation by Distribution Channel
- 7.1 Market segments
- Chart on Distribution Channel - Market share 2023-2028 (%)
- Data Table on Distribution Channel - Market share 2023-2028 (%)
- 7.2 Comparison by Distribution Channel
- Chart on Comparison by Distribution Channel
- Data Table on Comparison by Distribution Channel
- 7.3 Supermarkets and hypermarkets - Market size and forecast 2023-2028
- Chart on Supermarkets and hypermarkets - Market size and forecast 2023-2028 ($ million)
- Data Table on Supermarkets and hypermarkets - Market size and forecast 2023-2028 ($ million)
- Chart on Supermarkets and hypermarkets - Year-over-year growth 2023-2028 (%)
- Data Table on Supermarkets and hypermarkets - Year-over-year growth 2023-2028 (%)
- 7.4 Convenience stores - Market size and forecast 2023-2028
- Chart on Convenience stores - Market size and forecast 2023-2028 ($ million)
- Data Table on Convenience stores - Market size and forecast 2023-2028 ($ million)
- Chart on Convenience stores - Year-over-year growth 2023-2028 (%)
- Data Table on Convenience stores - Year-over-year growth 2023-2028 (%)
- 7.5 Online retail - Market size and forecast 2023-2028
- Chart on Online retail - Market size and forecast 2023-2028 ($ million)
- Data Table on Online retail - Market size and forecast 2023-2028 ($ million)
- Chart on Online retail - Year-over-year growth 2023-2028 (%)
- Data Table on Online retail - Year-over-year growth 2023-2028 (%)
- 7.6 Others - Market size and forecast 2023-2028
- Chart on Others - Market size and forecast 2023-2028 ($ million)
- Data Table on Others - Market size and forecast 2023-2028 ($ million)
- Chart on Others - Year-over-year growth 2023-2028 (%)
- Data Table on Others - Year-over-year growth 2023-2028 (%)
- 7.7 Market opportunity by Distribution Channel
- Market opportunity by Distribution Channel ($ million)
- Data Table on Market opportunity by Distribution Channel ($ million)
8 Customer Landscape
- 8.1 Customer landscape overview
- Analysis of price sensitivity, lifecycle, customer purchase basket, adoption rates, and purchase criteria
9 Geographic Landscape
- 9.1 Geographic segmentation
- Chart on Market share By Geographical Landscape 2023-2028 (%)
- Data Table on Market share By Geographical Landscape 2023-2028 (%)
- 9.2 Geographic comparison
- Chart on Geographic comparison
- Data Table on Geographic comparison
- 9.3 North America - Market size and forecast 2023-2028
- Chart on North America - Market size and forecast 2023-2028 ($ million)
- Data Table on North America - Market size and forecast 2023-2028 ($ million)
- Chart on North America - Year-over-year growth 2023-2028 (%)
- Data Table on North America - Year-over-year growth 2023-2028 (%)
- 9.4 Europe - Market size and forecast 2023-2028
- Chart on Europe - Market size and forecast 2023-2028 ($ million)
- Data Table on Europe - Market size and forecast 2023-2028 ($ million)
- Chart on Europe - Year-over-year growth 2023-2028 (%)
- Data Table on Europe - Year-over-year growth 2023-2028 (%)
- 9.5 APAC - Market size and forecast 2023-2028
- Chart on APAC - Market size and forecast 2023-2028 ($ million)
- Data Table on APAC - Market size and forecast 2023-2028 ($ million)
- Chart on APAC - Year-over-year growth 2023-2028 (%)
- Data Table on APAC - Year-over-year growth 2023-2028 (%)
- 9.6 South America - Market size and forecast 2023-2028
- Chart on South America - Market size and forecast 2023-2028 ($ million)
- Data Table on South America - Market size and forecast 2023-2028 ($ million)
- Chart on South America - Year-over-year growth 2023-2028 (%)
- Data Table on South America - Year-over-year growth 2023-2028 (%)
- 9.7 Middle East and Africa - Market size and forecast 2023-2028
- Chart on Middle East and Africa - Market size and forecast 2023-2028 ($ million)
- Data Table on Middle East and Africa - Market size and forecast 2023-2028 ($ million)
- Chart on Middle East and Africa - Year-over-year growth 2023-2028 (%)
- Data Table on Middle East and Africa - Year-over-year growth 2023-2028 (%)
- 9.8 US - Market size and forecast 2023-2028
- Chart on US - Market size and forecast 2023-2028 ($ million)
- Data Table on US - Market size and forecast 2023-2028 ($ million)
- Chart on US - Year-over-year growth 2023-2028 (%)
- Data Table on US - Year-over-year growth 2023-2028 (%)
- 9.9 Germany - Market size and forecast 2023-2028
- Chart on Germany - Market size and forecast 2023-2028 ($ million)
- Data Table on Germany - Market size and forecast 2023-2028 ($ million)
- Chart on Germany - Year-over-year growth 2023-2028 (%)
- Data Table on Germany - Year-over-year growth 2023-2028 (%)
- 9.10 France - Market size and forecast 2023-2028
- Chart on France - Market size and forecast 2023-2028 ($ million)
- Data Table on France - Market size and forecast 2023-2028 ($ million)
- Chart on France - Year-over-year growth 2023-2028 (%)
- Data Table on France - Year-over-year growth 2023-2028 (%)
- 9.11 India - Market size and forecast 2023-2028
- Chart on India - Market size and forecast 2023-2028 ($ million)
- Data Table on India - Market size and forecast 2023-2028 ($ million)
- Chart on India - Year-over-year growth 2023-2028 (%)
- Data Table on India - Year-over-year growth 2023-2028 (%)
- 9.12 UK - Market size and forecast 2023-2028
- Chart on UK - Market size and forecast 2023-2028 ($ million)
- Data Table on UK - Market size and forecast 2023-2028 ($ million)
- Chart on UK - Year-over-year growth 2023-2028 (%)
- Data Table on UK - Year-over-year growth 2023-2028 (%)
- 9.13 Market opportunity By Geographical Landscape
- Market opportunity By Geographical Landscape ($ million)
- Data Tables on Market opportunity By Geographical Landscape ($ million)
10 Drivers, Challenges, and Opportunity/Restraints
- 10.1 Market drivers
- 10.2 Market challenges
- 10.3 Impact of drivers and challenges
- Impact of drivers and challenges in 2023 and 2028
- 10.4 Market opportunities/restraints
11 Competitive Landscape
- 11.1 Overview
- 11.2 Competitive Landscape
- Overview on criticality of inputs and factors of differentiation
- 11.3 Landscape disruption
- Overview on factors of disruption
- 11.4 Industry risks
- Impact of key risks on business
12 Competitive Analysis
- 12.1 Companies profiled
- Companies covered
- 12.2 Market positioning of companies
- Matrix on companies position and classification
- 12.3 Celebes Coconut Corp.
- Celebes Coconut Corp. - Overview
- Celebes Coconut Corp. - Product / Service
- Celebes Coconut Corp. - Key offerings
- 12.4 Cocomi Bio Organic
- Cocomi Bio Organic - Overview
- Cocomi Bio Organic - Product / Service
- Cocomi Bio Organic - Key offerings
- 12.5 Dabur India Ltd.
- Dabur India Ltd. - Overview
- Dabur India Ltd. - Business segments
- Dabur India Ltd. - Key news
- Dabur India Ltd. - Key offerings
- Dabur India Ltd. - Segment focus
- 12.6 Danone SA
- Danone SA - Overview
- Danone SA - Business segments
- Danone SA - Key news
- Danone SA - Key offerings
- Danone SA - Segment focus
- 12.7 Edward and Sons Trading Co.
- Edward and Sons Trading Co. - Overview
- Edward and Sons Trading Co. - Product / Service
- Edward and Sons Trading Co. - Key offerings
- 12.8 Goya Foods Inc.
- Goya Foods Inc. - Overview
- Goya Foods Inc. - Product / Service
- Goya Foods Inc. - Key offerings
- 12.9 McCormick and Co. Inc.
- McCormick and Co. Inc. - Overview
- McCormick and Co. Inc. - Business segments
- McCormick and Co. Inc. - Key news
- McCormick and Co. Inc. - Key offerings
- McCormick and Co. Inc. - Segment focus
- 12.10 Merit Food Products Co. Ltd.
- Merit Food Products Co. Ltd. - Overview
- Merit Food Products Co. Ltd. - Product / Service
- Merit Food Products Co. Ltd. - Key offerings
- 12.11 Nestle SA
- Nestle SA - Overview
- Nestle SA - Business segments
- Nestle SA - Key news
- Nestle SA - Key offerings
- Nestle SA - Segment focus
- 12.12 PureHarvest
- PureHarvest - Overview
- PureHarvest - Product / Service
- PureHarvest - Key offerings
- 12.13 Thai Agri Foods Public Co. Ltd.
- Thai Agri Foods Public Co. Ltd. - Overview
- Thai Agri Foods Public Co. Ltd. - Product / Service
- Thai Agri Foods Public Co. Ltd. - Key offerings
- 12.14 Thai Coconut Public Co. Ltd.
- Thai Coconut Public Co. Ltd. - Overview
- Thai Coconut Public Co. Ltd. - Product / Service
- Thai Coconut Public Co. Ltd. - Key offerings
- 12.15 The Coconut Co. UK Ltd.
- The Coconut Co. UK Ltd. - Overview
- The Coconut Co. UK Ltd. - Product / Service
- The Coconut Co. UK Ltd. - Key offerings
- 12.16 The Vita Coco Co. Inc.
- The Vita Coco Co. Inc. - Overview
- The Vita Coco Co. Inc. - Business segments
- The Vita Coco Co. Inc. - Key offerings
- The Vita Coco Co. Inc. - Segment focus
- 12.17 Theppadungporn Coconut Co. Ltd.
- Theppadungporn Coconut Co. Ltd. - Overview
- Theppadungporn Coconut Co. Ltd. - Product / Service
- Theppadungporn Coconut Co. Ltd. - Key offerings
13 Appendix
- 13.1 Scope of the report
- 13.2 Inclusions and exclusions checklist
- Inclusions checklist
- Exclusions checklist
- 13.3 Currency conversion rates for US$
- Currency conversion rates for US$
- 13.4 Research methodology
- Research methodology
- 13.5 Data procurement
- Information sources
- 13.6 Data validation
- Data validation
- 13.7 Validation techniques employed for market sizing
- Validation techniques employed for market sizing
- 13.8 Data synthesis
- Data synthesis
- 13.9 360 degree market analysis
- 360 degree market analysis
- 13.10 List of abbreviations
- List of abbreviations

