|
|
市場調査レポート
商品コード
1525110
クルミの世界市場 2024-2028Global walnut market 2024-2028 |
||||||
|
|||||||
カスタマイズ可能
|
|||||||

| クルミの世界市場 2024-2028 |
|
出版日: 2024年07月12日
発行: TechNavio
ページ情報: 英文 148 Pages
納期: 即納可能
|

全表示
- 概要
- 図表
- 目次
クルミ市場は2023-2028年に27億7,720万米ドル、予測期間中のCAGRは5.97%で成長すると予測されます。
当レポートでは、クルミ市場の全体的な分析、市場規模・予測、動向、成長促進要因、課題、約25のベンダーを網羅したベンダー分析などを掲載しています。
現在の市場シナリオ、最新動向と促進要因、市場環境全体に関する最新分析を提供しています。市場は、ミレニアル世代におけるビーガンスナックの人気上昇、クルミの健康効果に関する認知度の上昇、コンビニエンスフードの需要増加などが牽引しています。
| 市場範囲 | |
|---|---|
| 基準年 | 2024 |
| 終了年 | 2028 |
| 予測期間 | 2024-2028 |
| 成長モメンタム | 加速 |
| 前年比2024年 | 5.28% |
| CAGR | 5.97% |
| 増分額 | 27億7,720万米ドル |
本調査では、化粧品業界におけるクルミオイルの使用増加が、今後数年間のクルミ市場成長を牽引する主な要因の一つであるとしています。また、オーガニックで持続可能なクルミ生産への注目の高まりや、新興国におけるクルミ市場の拡大は、市場の大きな需要につながります。
目次
第1章 エグゼクティブサマリー
- 市場概要
第2章 市場情勢
- 市場エコシステム
- 市場の特徴
- バリューチェーン分析
第3章 市場規模の評価
- 市場の定義
- 市場セグメント分析
- 市場規模 2023
- 市場の見通し 2023-2028
第4章 市場規模実績
- 世界クルミ市場 2018-2022
- 流通チャネル別セグメント分析 2018-2022
- タイプ別セグメント分析 2018-2022
- 地域別セグメント分析 2018-2022
- 国別セグメント分析 2018-2022
第5章 ファイブフォース分析
- ファイブフォースの要約
- 買い手の交渉力
- 供給企業の交渉力
- 新規参入業者の脅威
- 代替品の脅威
- 競争の脅威
- 市況
第6章 市場セグメンテーション:流通チャネル別
- 市場セグメンテーション
- 比較:流通チャネル別
- オフライン:市場規模と予測 2023-2028
- オンライン:市場規模と予測 2023-2028
- 市場機会:流通チャネル別
第7章 市場セグメンテーション:タイプ別
- 市場セグメンテーション
- 比較:タイプ別
- オーガニック:市場規模と予測 2023-2028
- 従来型:市場規模と予測 2023-2028
- 市場機会:タイプ別
第8章 顧客情勢
- 顧客情勢の概要
第9章 地域別情勢
- 地域別セグメンテーション
- 地域別比較
- アジア太平洋:市場規模と予測 2023-2028
- 欧州:市場規模と予測 2023-2028
- 北米:市場規模と予測 2023-2028
- 中東・アフリカ:市場規模と予測 2023-2028
- 南米:市場規模と予測 2023-2028
- 中国:市場規模と予測 2023-2028
- 米国:市場規模と予測 2023-2028
- ドイツ:市場規模と予測 2023-2028
- インド:市場規模と予測 2023-2028
- スペイン:市場規模と予測 2023-2028
- 市場機会:地域情勢別
第10章 促進要因・課題・機会・抑制要因
- 市場促進要因
- 市場の課題
- 促進要因と課題の影響
- 市場の機会・抑制要因
第11章 競合情勢
- 概要
- 競合情勢
- 混乱の状況
- 業界のリスク
第12章 競合分析
- 企業プロファイル
- 企業の市場ポジショニング
- AGROMILLORA CATALANA SAU
- Alpine Pacific Nut Co.
- Andersen and Sons Shelling Inc.
- Borges International Group SLU
- California Walnuts
- Crain Walnut Shelling LP
- Empire Nut Co. LLC
- GoldRiver Orchards Inc.
- Grower Direct Nut Co.
- Guerra Nut Shelling Co.
- Haleakala Walnut Shelling Inc.
- KASHMIR WALNUT GROUP
- Mid Valley Nut Co.
- Morada Produce Co.
- Royal Saffron Co.
第13章 付録
Exhibits:
- Exhibits1: Executive Summary - Chart on Market Overview
- Exhibits2: Executive Summary - Data Table on Market Overview
- Exhibits3: Executive Summary - Chart on Global Market Characteristics
- Exhibits4: Executive Summary - Chart on Market By Geographical Landscape
- Exhibits5: Executive Summary - Chart on Market Segmentation by Distribution Channel
- Exhibits6: Executive Summary - Chart on Market Segmentation by Type
- Exhibits7: Executive Summary - Chart on Incremental Growth
- Exhibits8: Executive Summary - Data Table on Incremental Growth
- Exhibits9: Executive Summary - Chart on Company Market Positioning
- Exhibits10: Parent Market
- Exhibits11: Data Table on - Parent Market
- Exhibits12: Market characteristics analysis
- Exhibits13: Value Chain Analysis
- Exhibits14: Offerings of companies included in the market definition
- Exhibits15: Market segments
- Exhibits16: Chart on Global - Market size and forecast 2023-2028 ($ million)
- Exhibits17: Data Table on Global - Market size and forecast 2023-2028 ($ million)
- Exhibits18: Chart on Global Market: Year-over-year growth 2023-2028 (%)
- Exhibits19: Data Table on Global Market: Year-over-year growth 2023-2028 (%)
- Exhibits20: Historic Market Size - Data Table on Global Walnut Market 2018 - 2022 ($ million)
- Exhibits21: Historic Market Size - Distribution Channel Segment 2018 - 2022 ($ million)
- Exhibits22: Historic Market Size - Type Segment 2018 - 2022 ($ million)
- Exhibits23: Historic Market Size - Geography Segment 2018 - 2022 ($ million)
- Exhibits24: Historic Market Size - Country Segment 2018 - 2022 ($ million)
- Exhibits25: Five forces analysis - Comparison between 2023 and 2028
- Exhibits26: Bargaining power of buyers - Impact of key factors 2023 and 2028
- Exhibits27: Bargaining power of suppliers - Impact of key factors in 2023 and 2028
- Exhibits28: Threat of new entrants - Impact of key factors in 2023 and 2028
- Exhibits29: Threat of substitutes - Impact of key factors in 2023 and 2028
- Exhibits30: Threat of rivalry - Impact of key factors in 2023 and 2028
- Exhibits31: Chart on Market condition - Five forces 2023 and 2028
- Exhibits32: Chart on Distribution Channel - Market share 2023-2028 (%)
- Exhibits33: Data Table on Distribution Channel - Market share 2023-2028 (%)
- Exhibits34: Chart on Comparison by Distribution Channel
- Exhibits35: Data Table on Comparison by Distribution Channel
- Exhibits36: Chart on Offline - Market size and forecast 2023-2028 ($ million)
- Exhibits37: Data Table on Offline - Market size and forecast 2023-2028 ($ million)
- Exhibits38: Chart on Offline - Year-over-year growth 2023-2028 (%)
- Exhibits39: Data Table on Offline - Year-over-year growth 2023-2028 (%)
- Exhibits40: Chart on Online - Market size and forecast 2023-2028 ($ million)
- Exhibits41: Data Table on Online - Market size and forecast 2023-2028 ($ million)
- Exhibits42: Chart on Online - Year-over-year growth 2023-2028 (%)
- Exhibits43: Data Table on Online - Year-over-year growth 2023-2028 (%)
- Exhibits44: Market opportunity by Distribution Channel ($ million)
- Exhibits45: Data Table on Market opportunity by Distribution Channel ($ million)
- Exhibits46: Chart on Type - Market share 2023-2028 (%)
- Exhibits47: Data Table on Type - Market share 2023-2028 (%)
- Exhibits48: Chart on Comparison by Type
- Exhibits49: Data Table on Comparison by Type
- Exhibits50: Chart on Organic - Market size and forecast 2023-2028 ($ million)
- Exhibits51: Data Table on Organic - Market size and forecast 2023-2028 ($ million)
- Exhibits52: Chart on Organic - Year-over-year growth 2023-2028 (%)
- Exhibits53: Data Table on Organic - Year-over-year growth 2023-2028 (%)
- Exhibits54: Chart on Conventional - Market size and forecast 2023-2028 ($ million)
- Exhibits55: Data Table on Conventional - Market size and forecast 2023-2028 ($ million)
- Exhibits56: Chart on Conventional - Year-over-year growth 2023-2028 (%)
- Exhibits57: Data Table on Conventional - Year-over-year growth 2023-2028 (%)
- Exhibits58: Market opportunity by Type ($ million)
- Exhibits59: Data Table on Market opportunity by Type ($ million)
- Exhibits60: Analysis of price sensitivity, lifecycle, customer purchase basket, adoption rates, and purchase criteria
- Exhibits61: Chart on Market share By Geographical Landscape 2023-2028 (%)
- Exhibits62: Data Table on Market share By Geographical Landscape 2023-2028 (%)
- Exhibits63: Chart on Geographic comparison
- Exhibits64: Data Table on Geographic comparison
- Exhibits65: Chart on APAC - Market size and forecast 2023-2028 ($ million)
- Exhibits66: Data Table on APAC - Market size and forecast 2023-2028 ($ million)
- Exhibits67: Chart on APAC - Year-over-year growth 2023-2028 (%)
- Exhibits68: Data Table on APAC - Year-over-year growth 2023-2028 (%)
- Exhibits69: Chart on Europe - Market size and forecast 2023-2028 ($ million)
- Exhibits70: Data Table on Europe - Market size and forecast 2023-2028 ($ million)
- Exhibits71: Chart on Europe - Year-over-year growth 2023-2028 (%)
- Exhibits72: Data Table on Europe - Year-over-year growth 2023-2028 (%)
- Exhibits73: Chart on North America - Market size and forecast 2023-2028 ($ million)
- Exhibits74: Data Table on North America - Market size and forecast 2023-2028 ($ million)
- Exhibits75: Chart on North America - Year-over-year growth 2023-2028 (%)
- Exhibits76: Data Table on North America - Year-over-year growth 2023-2028 (%)
- Exhibits77: Chart on Middle East and Africa - Market size and forecast 2023-2028 ($ million)
- Exhibits78: Data Table on Middle East and Africa - Market size and forecast 2023-2028 ($ million)
- Exhibits79: Chart on Middle East and Africa - Year-over-year growth 2023-2028 (%)
- Exhibits80: Data Table on Middle East and Africa - Year-over-year growth 2023-2028 (%)
- Exhibits81: Chart on South America - Market size and forecast 2023-2028 ($ million)
- Exhibits82: Data Table on South America - Market size and forecast 2023-2028 ($ million)
- Exhibits83: Chart on South America - Year-over-year growth 2023-2028 (%)
- Exhibits84: Data Table on South America - Year-over-year growth 2023-2028 (%)
- Exhibits85: Chart on China - Market size and forecast 2023-2028 ($ million)
- Exhibits86: Data Table on China - Market size and forecast 2023-2028 ($ million)
- Exhibits87: Chart on China - Year-over-year growth 2023-2028 (%)
- Exhibits88: Data Table on China - Year-over-year growth 2023-2028 (%)
- Exhibits89: Chart on US - Market size and forecast 2023-2028 ($ million)
- Exhibits90: Data Table on US - Market size and forecast 2023-2028 ($ million)
- Exhibits91: Chart on US - Year-over-year growth 2023-2028 (%)
- Exhibits92: Data Table on US - Year-over-year growth 2023-2028 (%)
- Exhibits93: Chart on Germany - Market size and forecast 2023-2028 ($ million)
- Exhibits94: Data Table on Germany - Market size and forecast 2023-2028 ($ million)
- Exhibits95: Chart on Germany - Year-over-year growth 2023-2028 (%)
- Exhibits96: Data Table on Germany - Year-over-year growth 2023-2028 (%)
- Exhibits97: Chart on India - Market size and forecast 2023-2028 ($ million)
- Exhibits98: Data Table on India - Market size and forecast 2023-2028 ($ million)
- Exhibits99: Chart on India - Year-over-year growth 2023-2028 (%)
- Exhibits100: Data Table on India - Year-over-year growth 2023-2028 (%)
- Exhibits101: Chart on Spain - Market size and forecast 2023-2028 ($ million)
- Exhibits102: Data Table on Spain - Market size and forecast 2023-2028 ($ million)
- Exhibits103: Chart on Spain - Year-over-year growth 2023-2028 (%)
- Exhibits104: Data Table on Spain - Year-over-year growth 2023-2028 (%)
- Exhibits105: Market opportunity By Geographical Landscape ($ million)
- Exhibits106: Data Tables on Market opportunity By Geographical Landscape ($ million)
- Exhibits107: Impact of drivers and challenges in 2023 and 2028
- Exhibits108: Overview on criticality of inputs and factors of differentiation
- Exhibits109: Overview on factors of disruption
- Exhibits110: Impact of key risks on business
- Exhibits111: Companies covered
- Exhibits112: Matrix on companies position and classification
- Exhibits113: AGROMILLORA CATALANA SAU - Overview
- Exhibits114: AGROMILLORA CATALANA SAU - Product / Service
- Exhibits115: AGROMILLORA CATALANA SAU - Key offerings
- Exhibits116: Alpine Pacific Nut Co. - Overview
- Exhibits117: Alpine Pacific Nut Co. - Product / Service
- Exhibits118: Alpine Pacific Nut Co. - Key offerings
- Exhibits119: Andersen and Sons Shelling Inc. - Overview
- Exhibits120: Andersen and Sons Shelling Inc. - Product / Service
- Exhibits121: Andersen and Sons Shelling Inc. - Key offerings
- Exhibits122: Borges International Group SLU - Overview
- Exhibits123: Borges International Group SLU - Business segments
- Exhibits124: Borges International Group SLU - Key offerings
- Exhibits125: Borges International Group SLU - Segment focus
- Exhibits126: California Walnuts - Overview
- Exhibits127: California Walnuts - Product / Service
- Exhibits128: California Walnuts - Key offerings
- Exhibits129: Crain Walnut Shelling LP - Overview
- Exhibits130: Crain Walnut Shelling LP - Product / Service
- Exhibits131: Crain Walnut Shelling LP - Key offerings
- Exhibits132: Empire Nut Co. LLC - Overview
- Exhibits133: Empire Nut Co. LLC - Product / Service
- Exhibits134: Empire Nut Co. LLC - Key offerings
- Exhibits135: GoldRiver Orchards Inc. - Overview
- Exhibits136: GoldRiver Orchards Inc. - Product / Service
- Exhibits137: GoldRiver Orchards Inc. - Key offerings
- Exhibits138: Grower Direct Nut Co. - Overview
- Exhibits139: Grower Direct Nut Co. - Product / Service
- Exhibits140: Grower Direct Nut Co. - Key offerings
- Exhibits141: Guerra Nut Shelling Co. - Overview
- Exhibits142: Guerra Nut Shelling Co. - Product / Service
- Exhibits143: Guerra Nut Shelling Co. - Key offerings
- Exhibits144: Haleakala Walnut Shelling Inc. - Overview
- Exhibits145: Haleakala Walnut Shelling Inc. - Product / Service
- Exhibits146: Haleakala Walnut Shelling Inc. - Key offerings
- Exhibits147: KASHMIR WALNUT GROUP - Overview
- Exhibits148: KASHMIR WALNUT GROUP - Product / Service
- Exhibits149: KASHMIR WALNUT GROUP - Key offerings
- Exhibits150: Mid Valley Nut Co. - Overview
- Exhibits151: Mid Valley Nut Co. - Product / Service
- Exhibits152: Mid Valley Nut Co. - Key offerings
- Exhibits153: Morada Produce Co. - Overview
- Exhibits154: Morada Produce Co. - Product / Service
- Exhibits155: Morada Produce Co. - Key offerings
- Exhibits156: Royal Saffron Co. - Overview
- Exhibits157: Royal Saffron Co. - Product / Service
- Exhibits158: Royal Saffron Co. - Key offerings
- Exhibits159: Inclusions checklist
- Exhibits160: Exclusions checklist
- Exhibits161: Currency conversion rates for US$
- Exhibits162: Research methodology
- Exhibits163: Information sources
- Exhibits164: Data validation
- Exhibits165: Validation techniques employed for market sizing
- Exhibits166: Data synthesis
- Exhibits167: 360 degree market analysis
- Exhibits168: List of abbreviations
The walnut market is forecasted to grow by USD 2777.2 mn during 2023-2028, accelerating at a CAGR of 5.97% during the forecast period. The report on the walnut market provides a holistic analysis, market size and forecast, trends, growth drivers, and challenges, as well as vendor analysis covering around 25 vendors.
The report offers an up-to-date analysis regarding the current market scenario, the latest trends and drivers, and the overall market environment. The market is driven by rising popularity of vegan Snacks among millennials, rising awareness about health benefits of walnuts, and rising demand for convenience foods.
Technavio's walnut market is segmented as below:
| Market Scope | |
|---|---|
| Base Year | 2024 |
| End Year | 2028 |
| Series Year | 2024-2028 |
| Growth Momentum | Accelerate |
| YOY 2024 | 5.28% |
| CAGR | 5.97% |
| Incremental Value | $2777.2mn |
By Distribution Channel
- Offline
- Online
By Type
- Organic
- Conventional
By Geographical Landscape
- APAC
- Europe
- North America
- Middle East and Africa
- South America
This study identifies the increase in use of walnut oil in cosmetics industry as one of the prime reasons driving the walnut market growth during the next few years. Also, increasing focus on organic and sustainable walnut production and expanding walnut market in emerging economies will lead to sizable demand in the market.
The report on the walnut market covers the following areas:
- Walnut market sizing
- Walnut market forecast
- Walnut market industry analysis
The robust vendor analysis is designed to help clients improve their market position, and in line with this, this report provides a detailed analysis of several leading walnut market vendors that include AGROMILLORA CATALANA SAU, Alpine Pacific Nut Co., Andersen and Sons Shelling Inc., Borges International Group SLU, California Walnuts, Campbell Soup Co., Crain Walnut Shelling LP, Empire Nut Co. LLC, GoldRiver Orchards Inc., Grower Direct Nut Co., Guerra Nut Shelling Co., Haleakala Walnut Shelling Inc., KASHMIR WALNUT GROUP, Mariani Nut Co., Mid Valley Nut Co., Morada Produce Co., Plantabul Ltd., Poindexter Nut Co., Royal Saffron Co., and Stahmann webster. Also, the walnut market analysis report includes information on upcoming trends and challenges that will influence market growth. This is to help companies strategize and leverage all forthcoming growth opportunities.
The study was conducted using an objective combination of primary and secondary information including inputs from key participants in the industry. The report contains a comprehensive market and vendor landscape in addition to an analysis of the key vendors.
The publisher presents a detailed picture of the market by the way of study, synthesis, and summation of data from multiple sources by an analysis of key parameters such as profit, pricing, competition, and promotions. It presents various market facets by identifying the key industry influencers. The data presented is comprehensive, reliable, and a result of extensive research - both primary and secondary. The market research reports provide a complete competitive landscape and an in-depth vendor selection methodology and analysis using qualitative and quantitative research to forecast the accurate market growth.
Table of Contents
1 Executive Summary
- 1.1 Market overview
- Executive Summary - Chart on Market Overview
- Executive Summary - Data Table on Market Overview
- Executive Summary - Chart on Global Market Characteristics
- Executive Summary - Chart on Market By Geographical Landscape
- Executive Summary - Chart on Market Segmentation by Distribution Channel
- Executive Summary - Chart on Market Segmentation by Type
- Executive Summary - Chart on Incremental Growth
- Executive Summary - Data Table on Incremental Growth
- Executive Summary - Chart on Company Market Positioning
2 Market Landscape
- 2.1 Market ecosystem
- Parent Market
- Data Table on - Parent Market
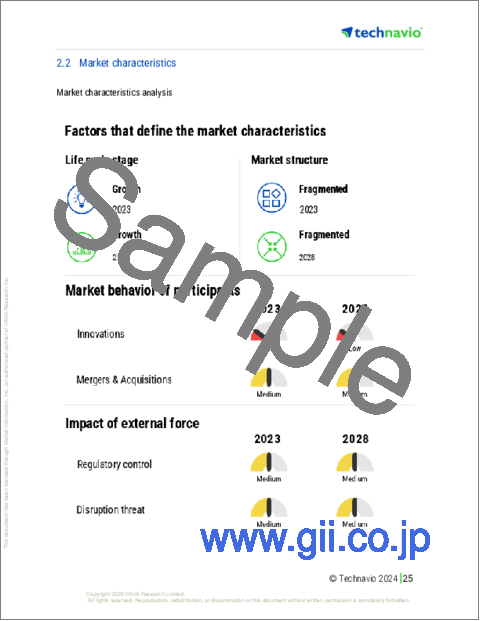
- 2.2 Market characteristics
- Market characteristics analysis
- 2.3 Value chain analysis
- Value Chain Analysis
3 Market Sizing
- 3.1 Market definition
- Offerings of companies included in the market definition
- 3.2 Market segment analysis
- Market segments
- 3.3 Market size 2023
- 3.4 Market outlook: Forecast for 2023-2028
- Chart on Global - Market size and forecast 2023-2028 ($ million)
- Data Table on Global - Market size and forecast 2023-2028 ($ million)
- Chart on Global Market: Year-over-year growth 2023-2028 (%)
- Data Table on Global Market: Year-over-year growth 2023-2028 (%)
4 Historic Market Size
- 4.1 Global Walnut Market 2018 - 2022
- Historic Market Size - Data Table on Global Walnut Market 2018 - 2022 ($ million)
- 4.2 Distribution Channel segment analysis 2018 - 2022
- Historic Market Size - Distribution Channel Segment 2018 - 2022 ($ million)
- 4.3 Type segment analysis 2018 - 2022
- Historic Market Size - Type Segment 2018 - 2022 ($ million)
- 4.4 Geography segment analysis 2018 - 2022
- Historic Market Size - Geography Segment 2018 - 2022 ($ million)
- 4.5 Country segment analysis 2018 - 2022
- Historic Market Size - Country Segment 2018 - 2022 ($ million)
5 Five Forces Analysis
- 5.1 Five forces summary
- Five forces analysis - Comparison between 2023 and 2028
- 5.2 Bargaining power of buyers
- Bargaining power of buyers - Impact of key factors 2023 and 2028
- 5.3 Bargaining power of suppliers
- Bargaining power of suppliers - Impact of key factors in 2023 and 2028
- 5.4 Threat of new entrants
- Threat of new entrants - Impact of key factors in 2023 and 2028
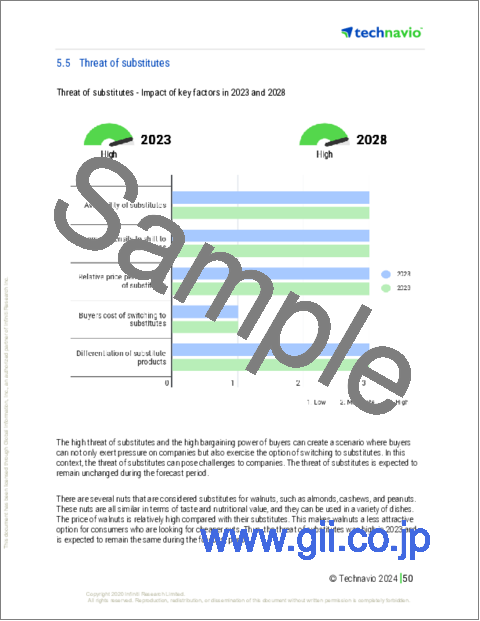
- 5.5 Threat of substitutes
- Threat of substitutes - Impact of key factors in 2023 and 2028
- 5.6 Threat of rivalry
- Threat of rivalry - Impact of key factors in 2023 and 2028
- 5.7 Market condition
- Chart on Market condition - Five forces 2023 and 2028
6 Market Segmentation by Distribution Channel
- 6.1 Market segments
- Chart on Distribution Channel - Market share 2023-2028 (%)
- Data Table on Distribution Channel - Market share 2023-2028 (%)
- 6.2 Comparison by Distribution Channel
- Chart on Comparison by Distribution Channel
- Data Table on Comparison by Distribution Channel
- 6.3 Offline - Market size and forecast 2023-2028
- Chart on Offline - Market size and forecast 2023-2028 ($ million)
- Data Table on Offline - Market size and forecast 2023-2028 ($ million)
- Chart on Offline - Year-over-year growth 2023-2028 (%)
- Data Table on Offline - Year-over-year growth 2023-2028 (%)
- 6.4 Online - Market size and forecast 2023-2028
- Chart on Online - Market size and forecast 2023-2028 ($ million)
- Data Table on Online - Market size and forecast 2023-2028 ($ million)
- Chart on Online - Year-over-year growth 2023-2028 (%)
- Data Table on Online - Year-over-year growth 2023-2028 (%)
- 6.5 Market opportunity by Distribution Channel
- Market opportunity by Distribution Channel ($ million)
- Data Table on Market opportunity by Distribution Channel ($ million)
7 Market Segmentation by Type
- 7.1 Market segments
- Chart on Type - Market share 2023-2028 (%)
- Data Table on Type - Market share 2023-2028 (%)
- 7.2 Comparison by Type
- Chart on Comparison by Type
- Data Table on Comparison by Type
- 7.3 Organic - Market size and forecast 2023-2028
- Chart on Organic - Market size and forecast 2023-2028 ($ million)
- Data Table on Organic - Market size and forecast 2023-2028 ($ million)
- Chart on Organic - Year-over-year growth 2023-2028 (%)
- Data Table on Organic - Year-over-year growth 2023-2028 (%)
- 7.4 Conventional - Market size and forecast 2023-2028
- Chart on Conventional - Market size and forecast 2023-2028 ($ million)
- Data Table on Conventional - Market size and forecast 2023-2028 ($ million)
- Chart on Conventional - Year-over-year growth 2023-2028 (%)
- Data Table on Conventional - Year-over-year growth 2023-2028 (%)
- 7.5 Market opportunity by Type
- Market opportunity by Type ($ million)
- Data Table on Market opportunity by Type ($ million)
8 Customer Landscape
- 8.1 Customer landscape overview
- Analysis of price sensitivity, lifecycle, customer purchase basket, adoption rates, and purchase criteria
9 Geographic Landscape
- 9.1 Geographic segmentation
- Chart on Market share By Geographical Landscape 2023-2028 (%)
- Data Table on Market share By Geographical Landscape 2023-2028 (%)
- 9.2 Geographic comparison
- Chart on Geographic comparison
- Data Table on Geographic comparison
- 9.3 APAC - Market size and forecast 2023-2028
- Chart on APAC - Market size and forecast 2023-2028 ($ million)
- Data Table on APAC - Market size and forecast 2023-2028 ($ million)
- Chart on APAC - Year-over-year growth 2023-2028 (%)
- Data Table on APAC - Year-over-year growth 2023-2028 (%)
- 9.4 Europe - Market size and forecast 2023-2028
- Chart on Europe - Market size and forecast 2023-2028 ($ million)
- Data Table on Europe - Market size and forecast 2023-2028 ($ million)
- Chart on Europe - Year-over-year growth 2023-2028 (%)
- Data Table on Europe - Year-over-year growth 2023-2028 (%)
- 9.5 North America - Market size and forecast 2023-2028
- Chart on North America - Market size and forecast 2023-2028 ($ million)
- Data Table on North America - Market size and forecast 2023-2028 ($ million)
- Chart on North America - Year-over-year growth 2023-2028 (%)
- Data Table on North America - Year-over-year growth 2023-2028 (%)
- 9.6 Middle East and Africa - Market size and forecast 2023-2028
- Chart on Middle East and Africa - Market size and forecast 2023-2028 ($ million)
- Data Table on Middle East and Africa - Market size and forecast 2023-2028 ($ million)
- Chart on Middle East and Africa - Year-over-year growth 2023-2028 (%)
- Data Table on Middle East and Africa - Year-over-year growth 2023-2028 (%)
- 9.7 South America - Market size and forecast 2023-2028
- Chart on South America - Market size and forecast 2023-2028 ($ million)
- Data Table on South America - Market size and forecast 2023-2028 ($ million)
- Chart on South America - Year-over-year growth 2023-2028 (%)
- Data Table on South America - Year-over-year growth 2023-2028 (%)
- 9.8 China - Market size and forecast 2023-2028
- Chart on China - Market size and forecast 2023-2028 ($ million)
- Data Table on China - Market size and forecast 2023-2028 ($ million)
- Chart on China - Year-over-year growth 2023-2028 (%)
- Data Table on China - Year-over-year growth 2023-2028 (%)
- 9.9 US - Market size and forecast 2023-2028
- Chart on US - Market size and forecast 2023-2028 ($ million)
- Data Table on US - Market size and forecast 2023-2028 ($ million)
- Chart on US - Year-over-year growth 2023-2028 (%)
- Data Table on US - Year-over-year growth 2023-2028 (%)
- 9.10 Germany - Market size and forecast 2023-2028
- Chart on Germany - Market size and forecast 2023-2028 ($ million)
- Data Table on Germany - Market size and forecast 2023-2028 ($ million)
- Chart on Germany - Year-over-year growth 2023-2028 (%)
- Data Table on Germany - Year-over-year growth 2023-2028 (%)
- 9.11 India - Market size and forecast 2023-2028
- Chart on India - Market size and forecast 2023-2028 ($ million)
- Data Table on India - Market size and forecast 2023-2028 ($ million)
- Chart on India - Year-over-year growth 2023-2028 (%)
- Data Table on India - Year-over-year growth 2023-2028 (%)
- 9.12 Spain - Market size and forecast 2023-2028
- Chart on Spain - Market size and forecast 2023-2028 ($ million)
- Data Table on Spain - Market size and forecast 2023-2028 ($ million)
- Chart on Spain - Year-over-year growth 2023-2028 (%)
- Data Table on Spain - Year-over-year growth 2023-2028 (%)
- 9.13 Market opportunity By Geographical Landscape
- Market opportunity By Geographical Landscape ($ million)
- Data Tables on Market opportunity By Geographical Landscape ($ million)
10 Drivers, Challenges, and Opportunity/Restraints
- 10.1 Market drivers
- 10.2 Market challenges
- 10.3 Impact of drivers and challenges
- Impact of drivers and challenges in 2023 and 2028
- 10.4 Market opportunities/restraints
11 Competitive Landscape
- 11.1 Overview
- 11.2 Competitive Landscape
- Overview on criticality of inputs and factors of differentiation
- 11.3 Landscape disruption
- Overview on factors of disruption
- 11.4 Industry risks
- Impact of key risks on business
12 Competitive Analysis
- 12.1 Companies profiled
- Companies covered
- 12.2 Market positioning of companies
- Matrix on companies position and classification
- 12.3 AGROMILLORA CATALANA SAU
- AGROMILLORA CATALANA SAU - Overview
- AGROMILLORA CATALANA SAU - Product / Service
- AGROMILLORA CATALANA SAU - Key offerings
- 12.4 Alpine Pacific Nut Co.
- Alpine Pacific Nut Co. - Overview
- Alpine Pacific Nut Co. - Product / Service
- Alpine Pacific Nut Co. - Key offerings
- 12.5 Andersen and Sons Shelling Inc.
- Andersen and Sons Shelling Inc. - Overview
- Andersen and Sons Shelling Inc. - Product / Service
- Andersen and Sons Shelling Inc. - Key offerings
- 12.6 Borges International Group SLU
- Borges International Group SLU - Overview
- Borges International Group SLU - Business segments
- Borges International Group SLU - Key offerings
- Borges International Group SLU - Segment focus
- 12.7 California Walnuts
- California Walnuts - Overview
- California Walnuts - Product / Service
- California Walnuts - Key offerings
- 12.8 Crain Walnut Shelling LP
- Crain Walnut Shelling LP - Overview
- Crain Walnut Shelling LP - Product / Service
- Crain Walnut Shelling LP - Key offerings
- 12.9 Empire Nut Co. LLC
- Empire Nut Co. LLC - Overview
- Empire Nut Co. LLC - Product / Service
- Empire Nut Co. LLC - Key offerings
- 12.10 GoldRiver Orchards Inc.
- GoldRiver Orchards Inc. - Overview
- GoldRiver Orchards Inc. - Product / Service
- GoldRiver Orchards Inc. - Key offerings
- 12.11 Grower Direct Nut Co.
- Grower Direct Nut Co. - Overview
- Grower Direct Nut Co. - Product / Service
- Grower Direct Nut Co. - Key offerings
- 12.12 Guerra Nut Shelling Co.
- Guerra Nut Shelling Co. - Overview
- Guerra Nut Shelling Co. - Product / Service
- Guerra Nut Shelling Co. - Key offerings
- 12.13 Haleakala Walnut Shelling Inc.
- Haleakala Walnut Shelling Inc. - Overview
- Haleakala Walnut Shelling Inc. - Product / Service
- Haleakala Walnut Shelling Inc. - Key offerings
- 12.14 KASHMIR WALNUT GROUP
- KASHMIR WALNUT GROUP - Overview
- KASHMIR WALNUT GROUP - Product / Service
- KASHMIR WALNUT GROUP - Key offerings
- 12.15 Mid Valley Nut Co.
- Mid Valley Nut Co. - Overview
- Mid Valley Nut Co. - Product / Service
- Mid Valley Nut Co. - Key offerings
- 12.16 Morada Produce Co.
- Morada Produce Co. - Overview
- Morada Produce Co. - Product / Service
- Morada Produce Co. - Key offerings
- 12.17 Royal Saffron Co.
- Royal Saffron Co. - Overview
- Royal Saffron Co. - Product / Service
- Royal Saffron Co. - Key offerings
13 Appendix
- 13.1 Scope of the report
- 13.2 Inclusions and exclusions checklist
- Inclusions checklist
- Exclusions checklist
- 13.3 Currency conversion rates for US$
- Currency conversion rates for US$
- 13.4 Research methodology
- Research methodology
- 13.5 Data procurement
- Information sources
- 13.6 Data validation
- Data validation
- 13.7 Validation techniques employed for market sizing
- Validation techniques employed for market sizing
- 13.8 Data synthesis
- Data synthesis
- 13.9 360 degree market analysis
- 360 degree market analysis
- 13.10 List of abbreviations
- List of abbreviations

