|
|
市場調査レポート
商品コード
1657204
個人向けローンの世界市場、2025-2029年Global Personal Loans Market 2025-2029 |
||||||

|
|||||||
カスタマイズ可能
|
|||||||

| 個人向けローンの世界市場、2025-2029年 |
|
出版日: 2025年02月07日
発行: TechNavio
ページ情報: 英文 205 Pages
納期: 即納可能
|

全表示
- 概要
- 目次
個人向けローン市場は2024-2029年に8,034億米ドル、予測期間中のCAGRは15.2%で成長すると予測されます。
当レポートでは、個人向けローン市場の全体的な分析、市場規模・予測、動向、成長促進要因、課題、約25のベンダーを網羅したベンダー分析などを掲載しています。
現在の市場シナリオ、最新動向と促進要因、市場環境全体に関する最新分析を提供しています。市場を牽引しているのは、融資プロセスにおける先端技術の利用、生活資金に対する要求の高まり、スマート都市への移住の増加などです。
| 市場範囲 | |
|---|---|
| 基準年 | 2025 |
| 終了年 | 2029 |
| 予測期間 | 2025-2029 |
| 成長モメンタム | 加速 |
| 前年比2025年 | 12% |
| CAGR | 15.2% |
| 増分額 | 8,034億米ドル |
本調査は、業界の主要参加者からのインプットを含め、一次情報と二次情報を客観的に組み合わせて実施しました。本レポートには、主要企業の分析に加え、包括的な市場規模データ、地域分析によるセグメント、ベンダー情勢が含まれています。レポートには過去データと予測データがあります。
本調査では、今後数年間の個人向けローン市場の成長を促進する主な要因の1つとして、クラウドベースの個人向けサービシングソフトウェアの採用が増加していることを挙げています。また、消費主導型融資の急速な普及や、融資・承認手続きの即時化も、市場の大きな需要につながると思われます。
目次
第1章 エグゼクティブサマリー
- 市場概要
第2章 Technavio分析
- 価格・ライフサイクル・顧客購入バスケット・採用率・購入基準の分析
- インプットの重要性と差別化の要因
- 混乱の要因
- 促進要因と課題の影響
第3章 市場情勢
- 市場エコシステム
- 市場の特徴
- バリューチェーン分析
第4章 市場規模
- 市場の定義
- 市場セグメント分析
- 市場規模 2024
- 市場の見通し 2024-2029
第5章 市場規模実績
- 個人向けローンの世界市場 2019-2023
- 用途別セグメント分析 2019-2023
- タイプセグメント分析 2019-2023
- チャネルセグメント分析 2019-2023
- 地域別セグメント分析 2019-2023
- 国別セグメント分析 2019-2023
第6章 定性分析
- AIの影響:個人向けローンの世界市場
第7章 ファイブフォース分析
- ファイブフォースの要約
- 買い手の交渉力
- 供給企業の交渉力
- 新規参入業者の脅威
- 代替品の脅威
- 競争の脅威
- 市況
第8章 市場セグメンテーション:用途別
- 市場セグメント
- 比較:用途別
- 短期ローン:市場規模と予測 2024-2029
- 中期ローン:市場規模と予測 2024-2029
- 長期ローン:市場規模と予測 2024-2029
- 市場機会:用途別
第9章 市場セグメンテーション:タイプ別
- 市場セグメント
- 比較:タイプ別
- P2Pマーケットプレースレンディング:市場規模と予測 2024-2029
- バランスシート融資:市場規模と予測 2024-2029
- 市場機会:タイプ別
第10章 市場セグメンテーション:チャネル別
- 市場セグメント
- 比較:チャネル別
- 銀行:市場規模と予測 2024-2029
- 信用組合:市場規模と予測 2024-2029
- オンライン融資業者:市場規模と予測 2024-2029
- 市場機会:チャネル別
第11章 顧客情勢
- 顧客情勢の概要
第12章 地域別情勢
- 地域別セグメンテーション
- 地域別比較
- 北米:市場規模と予測 2024-2029
- 欧州:市場規模と予測 2024-2029
- アジア太平洋:市場規模と予測 2024-2029
- 南米:市場規模と予測 2024-2029
- 中東・アフリカ:市場規模と予測 2024-2029
- 米国:市場規模と予測 2024-2029
- カナダ:市場規模と予測 2024-2029
- 英国:市場規模と予測 2024-2029
- インド:市場規模と予測 2024-2029
- ドイツ:市場規模と予測 2024-2029
- 中国:市場規模と予測 2024-2029
- フランス:市場規模と予測 2024-2029
- 日本:市場規模と予測 2024-2029
- イタリア:市場規模と予測 2024-2029
- ブラジル:市場規模と予測 2024-2029
- 市場機会:地域情勢別
第13章 促進要因・課題・機会・抑制要因
- 市場促進要因
- 市場の課題
- 促進要因と課題の影響
- 市場の機会・抑制要因
第14章 競合情勢
- 概要
- 競合情勢
- 混乱の状況
- 業界のリスク
第15章 競合分析
- 企業プロファイル
- 企業ランキング指数
- 企業の市場ポジショニング
- Axis Bank Ltd.
- Canara Bank
- Cholamandalam Investment and Finance Co. Ltd.
- Finbud Financial Services Pvt Ltd
- HDFC Bank Ltd.
- HSBC Holdings Plc
- ICICI Bank Ltd.
- IDBI Bank Ltd.
- Indian Overseas Bank
- Mahindra and Mahindra Financial Services Ltd.
- Punjab National Bank
- State Bank of India
- UCO BANK
- Union Bank of India
- Whizdm Innovations Pvt. Ltd.
第16章 付録
The personal loans market is forecasted to grow by USD 803.4 billion during 2024-2029, accelerating at a CAGR of 15.2% during the forecast period. The report on the personal loans market provides a holistic analysis, market size and forecast, trends, growth drivers, and challenges, as well as vendor analysis covering around 25 vendors.
The report offers an up-to-date analysis regarding the current market scenario, the latest trends and drivers, and the overall market environment. The market is driven by use of advanced technologies in loan process, rising requirement of money to fund lifestyles, and increasing migration to smart urban cities.
| Market Scope | |
|---|---|
| Base Year | 2025 |
| End Year | 2029 |
| Series Year | 2025-2029 |
| Growth Momentum | Accelerate |
| YOY 2025 | 12% |
| CAGR | 15.2% |
| Incremental Value | $803.4 bn |
The study was conducted using an objective combination of primary and secondary information including inputs from key participants in the industry. The report contains a comprehensive market size data, segment with regional analysis and vendor landscape in addition to an analysis of the key companies. Reports have historic and forecast data.
Technavio's personal loans market is segmented as below:
By Application
- Short term loans
- Medium term loans
- Long term loans
By Type
- P2P marketplace lending
- Balance sheet lending
By Channel
- Banks
- Credit union
- Online lenders
By Geographical Landscape
- North America
- Europe
- APAC
- South America
- Middle East and Africa
This study identifies the rise in adoption of cloud-based personal loan servicing software offerings as one of the prime reasons driving the personal loans market growth during the next few years. Also, rapid boost in consumption-LED credit products and instantaneous loan and approval procedure will lead to sizable demand in the market.
The report on the personal loans market covers the following areas:
- Personal Loans Market sizing
- Personal Loans Market forecast
- Personal Loans Market industry analysis
The robust vendor analysis is designed to help clients improve their market position, and in line with this, this report provides a detailed analysis of several leading personal loans market vendors that include Axis Bank Ltd., Bajaj Finserv Ltd., Canara Bank, Cholamandalam Investment and Finance Co. Ltd., Citigroup Inc., Finbud Financial Services Pvt Ltd, HDFC Bank Ltd., HSBC Holdings PLC, ICICI Bank Ltd., IDBI Bank Ltd., Indian Overseas Bank, Mahindra and Mahindra Financial Services Ltd., PPF Group, Punjab National Bank, State Bank of India, Tata Sons Pvt. Ltd., UCO BANK, Union Bank of India, Whizdm Innovations Pvt. Ltd., and Yes Bank Ltd.. Also, the personal loans market analysis report includes information on upcoming trends and challenges that will influence market growth. This is to help companies strategize and leverage all forthcoming growth opportunities.
The publisher presents a detailed picture of the market by the way of study, synthesis, and summation of data from multiple sources by an analysis of key parameters such as profit, pricing, competition, and promotions. It presents various market facets by identifying the key industry influencers. The data presented is comprehensive, reliable, and a result of extensive primary and secondary research. The market research reports provide a complete competitive landscape and an in-depth vendor selection methodology and analysis using qualitative and quantitative research to forecast accurate market growth.
Table of Contents
1 Executive Summary
- 1.1 Market overview
- Executive Summary - Chart on Market Overview
- Executive Summary - Data Table on Market Overview
- Executive Summary - Chart on Global Market Characteristics
- Executive Summary - Chart on Market By Geographical Landscape
- Executive Summary - Chart on Market Segmentation by Application
- Executive Summary - Chart on Market Segmentation by Type
- Executive Summary - Chart on Market Segmentation by Channel
- Executive Summary - Chart on Incremental Growth
- Executive Summary - Data Table on Incremental Growth
- Executive Summary - Chart on Company Market Positioning
2 Technavio Analysis
- 2.1 Analysis of price sensitivity, lifecycle, customer purchase basket, adoption rates, and purchase criteria
- Analysis of price sensitivity, lifecycle, customer purchase basket, adoption rates, and purchase criteria
- 2.2 Criticality of inputs and Factors of differentiation
- Overview on criticality of inputs and factors of differentiation
- 2.3 Factors of disruption
- Overview on factors of disruption
- 2.4 Impact of drivers and challenges
- Impact of drivers and challenges in 2024 and 2029
3 Market Landscape
- 3.1 Market ecosystem
- Parent Market
- Data Table on - Parent Market
- 3.2 Market characteristics
- Market characteristics analysis
- 3.3 Value chain analysis
- Value chain analysis
4 Market Sizing
- 4.1 Market definition
- Offerings of companies included in the market definition
- 4.2 Market segment analysis
- Market segments
- 4.3 Market size 2024
- 4.4 Market outlook: Forecast for 2024-2029
- Chart on Global - Market size and forecast 2024-2029 ($ billion)
- Data Table on Global - Market size and forecast 2024-2029 ($ billion)
- Chart on Global Market: Year-over-year growth 2024-2029 (%)
- Data Table on Global Market: Year-over-year growth 2024-2029 (%)
5 Historic Market Size
- 5.1 Global Personal Loans Market 2019 - 2023
- Historic Market Size - Data Table on Global Personal Loans Market 2019 - 2023 ($ billion)
- 5.2 Application segment analysis 2019 - 2023
- Historic Market Size - Application Segment 2019 - 2023 ($ billion)
- 5.3 Type segment analysis 2019 - 2023
- Historic Market Size - Type Segment 2019 - 2023 ($ billion)
- 5.4 Channel segment analysis 2019 - 2023
- Historic Market Size - Channel Segment 2019 - 2023 ($ billion)
- 5.5 Geography segment analysis 2019 - 2023
- Historic Market Size - Geography Segment 2019 - 2023 ($ billion)
- 5.6 Country segment analysis 2019 - 2023
- Historic Market Size - Country Segment 2019 - 2023 ($ billion)
6 Qualitative Analysis
- 6.1 Impact of AI on Global Personal Loans Market
7 Five Forces Analysis
- 7.1 Five forces summary
- Five forces analysis - Comparison between 2024 and 2029
- 7.2 Bargaining power of buyers
- Bargaining power of buyers - Impact of key factors 2024 and 2029
- 7.3 Bargaining power of suppliers
- Bargaining power of suppliers - Impact of key factors in 2024 and 2029
- 7.4 Threat of new entrants
- Threat of new entrants - Impact of key factors in 2024 and 2029
- 7.5 Threat of substitutes
- Threat of substitutes - Impact of key factors in 2024 and 2029
- 7.6 Threat of rivalry
- Threat of rivalry - Impact of key factors in 2024 and 2029
- 7.7 Market condition
- Chart on Market condition - Five forces 2024 and 2029
8 Market Segmentation by Application
- 8.1 Market segments
- Chart on Application - Market share 2024-2029 (%)
- Data Table on Application - Market share 2024-2029 (%)
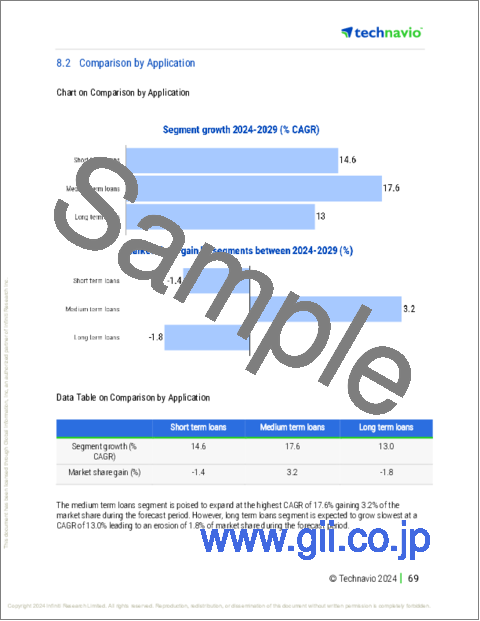
- 8.2 Comparison by Application
- Chart on Comparison by Application
- Data Table on Comparison by Application
- 8.3 Short term loans - Market size and forecast 2024-2029
- Chart on Short term loans - Market size and forecast 2024-2029 ($ billion)
- Data Table on Short term loans - Market size and forecast 2024-2029 ($ billion)
- Chart on Short term loans - Year-over-year growth 2024-2029 (%)
- Data Table on Short term loans - Year-over-year growth 2024-2029 (%)
- 8.4 Medium term loans - Market size and forecast 2024-2029
- Chart on Medium term loans - Market size and forecast 2024-2029 ($ billion)
- Data Table on Medium term loans - Market size and forecast 2024-2029 ($ billion)
- Chart on Medium term loans - Year-over-year growth 2024-2029 (%)
- Data Table on Medium term loans - Year-over-year growth 2024-2029 (%)
- 8.5 Long term loans - Market size and forecast 2024-2029
- Chart on Long term loans - Market size and forecast 2024-2029 ($ billion)
- Data Table on Long term loans - Market size and forecast 2024-2029 ($ billion)
- Chart on Long term loans - Year-over-year growth 2024-2029 (%)
- Data Table on Long term loans - Year-over-year growth 2024-2029 (%)
- 8.6 Market opportunity by Application
- Market opportunity by Application ($ billion)
- Data Table on Market opportunity by Application ($ billion)
9 Market Segmentation by Type
- 9.1 Market segments
- Chart on Type - Market share 2024-2029 (%)
- Data Table on Type - Market share 2024-2029 (%)
- 9.2 Comparison by Type
- Chart on Comparison by Type
- Data Table on Comparison by Type
- 9.3 P2P marketplace lending - Market size and forecast 2024-2029
- Chart on P2P marketplace lending - Market size and forecast 2024-2029 ($ billion)
- Data Table on P2P marketplace lending - Market size and forecast 2024-2029 ($ billion)
- Chart on P2P marketplace lending - Year-over-year growth 2024-2029 (%)
- Data Table on P2P marketplace lending - Year-over-year growth 2024-2029 (%)
- 9.4 Balance sheet lending - Market size and forecast 2024-2029
- Chart on Balance sheet lending - Market size and forecast 2024-2029 ($ billion)
- Data Table on Balance sheet lending - Market size and forecast 2024-2029 ($ billion)
- Chart on Balance sheet lending - Year-over-year growth 2024-2029 (%)
- Data Table on Balance sheet lending - Year-over-year growth 2024-2029 (%)
- 9.5 Market opportunity by Type
- Market opportunity by Type ($ billion)
- Data Table on Market opportunity by Type ($ billion)
10 Market Segmentation by Channel
- 10.1 Market segments
- Chart on Channel - Market share 2024-2029 (%)
- Data Table on Channel - Market share 2024-2029 (%)
- 10.2 Comparison by Channel
- Chart on Comparison by Channel
- Data Table on Comparison by Channel
- 10.3 Banks - Market size and forecast 2024-2029
- Chart on Banks - Market size and forecast 2024-2029 ($ billion)
- Data Table on Banks - Market size and forecast 2024-2029 ($ billion)
- Chart on Banks - Year-over-year growth 2024-2029 (%)
- Data Table on Banks - Year-over-year growth 2024-2029 (%)
- 10.4 Credit union - Market size and forecast 2024-2029
- Chart on Credit union - Market size and forecast 2024-2029 ($ billion)
- Data Table on Credit union - Market size and forecast 2024-2029 ($ billion)
- Chart on Credit union - Year-over-year growth 2024-2029 (%)
- Data Table on Credit union - Year-over-year growth 2024-2029 (%)
- 10.5 Online lenders - Market size and forecast 2024-2029
- Chart on Online lenders - Market size and forecast 2024-2029 ($ billion)
- Data Table on Online lenders - Market size and forecast 2024-2029 ($ billion)
- Chart on Online lenders - Year-over-year growth 2024-2029 (%)
- Data Table on Online lenders - Year-over-year growth 2024-2029 (%)
- 10.6 Market opportunity by Channel
- Market opportunity by Channel ($ billion)
- Data Table on Market opportunity by Channel ($ billion)
11 Customer Landscape
- 11.1 Customer landscape overview
- Analysis of price sensitivity, lifecycle, customer purchase basket, adoption rates, and purchase criteria
12 Geographic Landscape
- 12.1 Geographic segmentation
- Chart on Market share By Geographical Landscape 2024-2029 (%)
- Data Table on Market share By Geographical Landscape 2024-2029 (%)
- 12.2 Geographic comparison
- Chart on Geographic comparison
- Data Table on Geographic comparison
- 12.3 North America - Market size and forecast 2024-2029
- Chart on North America - Market size and forecast 2024-2029 ($ billion)
- Data Table on North America - Market size and forecast 2024-2029 ($ billion)
- Chart on North America - Year-over-year growth 2024-2029 (%)
- Data Table on North America - Year-over-year growth 2024-2029 (%)
- 12.4 Europe - Market size and forecast 2024-2029
- Chart on Europe - Market size and forecast 2024-2029 ($ billion)
- Data Table on Europe - Market size and forecast 2024-2029 ($ billion)
- Chart on Europe - Year-over-year growth 2024-2029 (%)
- Data Table on Europe - Year-over-year growth 2024-2029 (%)
- 12.5 APAC - Market size and forecast 2024-2029
- Chart on APAC - Market size and forecast 2024-2029 ($ billion)
- Data Table on APAC - Market size and forecast 2024-2029 ($ billion)
- Chart on APAC - Year-over-year growth 2024-2029 (%)
- Data Table on APAC - Year-over-year growth 2024-2029 (%)
- 12.6 South America - Market size and forecast 2024-2029
- Chart on South America - Market size and forecast 2024-2029 ($ billion)
- Data Table on South America - Market size and forecast 2024-2029 ($ billion)
- Chart on South America - Year-over-year growth 2024-2029 (%)
- Data Table on South America - Year-over-year growth 2024-2029 (%)
- 12.7 Middle East and Africa - Market size and forecast 2024-2029
- Chart on Middle East and Africa - Market size and forecast 2024-2029 ($ billion)
- Data Table on Middle East and Africa - Market size and forecast 2024-2029 ($ billion)
- Chart on Middle East and Africa - Year-over-year growth 2024-2029 (%)
- Data Table on Middle East and Africa - Year-over-year growth 2024-2029 (%)
- 12.8 US - Market size and forecast 2024-2029
- Chart on US - Market size and forecast 2024-2029 ($ billion)
- Data Table on US - Market size and forecast 2024-2029 ($ billion)
- Chart on US - Year-over-year growth 2024-2029 (%)
- Data Table on US - Year-over-year growth 2024-2029 (%)
- 12.9 Canada - Market size and forecast 2024-2029
- Chart on Canada - Market size and forecast 2024-2029 ($ billion)
- Data Table on Canada - Market size and forecast 2024-2029 ($ billion)
- Chart on Canada - Year-over-year growth 2024-2029 (%)
- Data Table on Canada - Year-over-year growth 2024-2029 (%)
- 12.10 UK - Market size and forecast 2024-2029
- Chart on UK - Market size and forecast 2024-2029 ($ billion)
- Data Table on UK - Market size and forecast 2024-2029 ($ billion)
- Chart on UK - Year-over-year growth 2024-2029 (%)
- Data Table on UK - Year-over-year growth 2024-2029 (%)
- 12.11 India - Market size and forecast 2024-2029
- Chart on India - Market size and forecast 2024-2029 ($ billion)
- Data Table on India - Market size and forecast 2024-2029 ($ billion)
- Chart on India - Year-over-year growth 2024-2029 (%)
- Data Table on India - Year-over-year growth 2024-2029 (%)
- 12.12 Germany - Market size and forecast 2024-2029
- Chart on Germany - Market size and forecast 2024-2029 ($ billion)
- Data Table on Germany - Market size and forecast 2024-2029 ($ billion)
- Chart on Germany - Year-over-year growth 2024-2029 (%)
- Data Table on Germany - Year-over-year growth 2024-2029 (%)
- 12.13 China - Market size and forecast 2024-2029
- Chart on China - Market size and forecast 2024-2029 ($ billion)
- Data Table on China - Market size and forecast 2024-2029 ($ billion)
- Chart on China - Year-over-year growth 2024-2029 (%)
- Data Table on China - Year-over-year growth 2024-2029 (%)
- 12.14 France - Market size and forecast 2024-2029
- Chart on France - Market size and forecast 2024-2029 ($ billion)
- Data Table on France - Market size and forecast 2024-2029 ($ billion)
- Chart on France - Year-over-year growth 2024-2029 (%)
- Data Table on France - Year-over-year growth 2024-2029 (%)
- 12.15 Japan - Market size and forecast 2024-2029
- Chart on Japan - Market size and forecast 2024-2029 ($ billion)
- Data Table on Japan - Market size and forecast 2024-2029 ($ billion)
- Chart on Japan - Year-over-year growth 2024-2029 (%)
- Data Table on Japan - Year-over-year growth 2024-2029 (%)
- 12.16 Italy - Market size and forecast 2024-2029
- Chart on Italy - Market size and forecast 2024-2029 ($ billion)
- Data Table on Italy - Market size and forecast 2024-2029 ($ billion)
- Chart on Italy - Year-over-year growth 2024-2029 (%)
- Data Table on Italy - Year-over-year growth 2024-2029 (%)
- 12.17 Brazil - Market size and forecast 2024-2029
- Chart on Brazil - Market size and forecast 2024-2029 ($ billion)
- Data Table on Brazil - Market size and forecast 2024-2029 ($ billion)
- Chart on Brazil - Year-over-year growth 2024-2029 (%)
- Data Table on Brazil - Year-over-year growth 2024-2029 (%)
- 12.18 Market opportunity By Geographical Landscape
- Market opportunity By Geographical Landscape ($ billion)
- Data Tables on Market opportunity By Geographical Landscape ($ billion)
13 Drivers, Challenges, and Opportunity/Restraints
- 13.1 Market drivers
- 13.2 Market challenges
- 13.3 Impact of drivers and challenges
- Impact of drivers and challenges in 2024 and 2029
- 13.4 Market opportunities/restraints
14 Competitive Landscape
- 14.1 Overview
- 14.2 Competitive Landscape
- Overview on criticality of inputs and factors of differentiation
- 14.3 Landscape disruption
- Overview on factors of disruption
- 14.4 Industry risks
- Impact of key risks on business
15 Competitive Analysis
- 15.1 Companies profiled
- Companies covered
- 15.2 Company ranking index
- Company ranking index
- 15.3 Market positioning of companies
- Matrix on companies position and classification
- 15.4 Axis Bank Ltd.
- Axis Bank Ltd. - Overview
- Axis Bank Ltd. - Business segments
- Axis Bank Ltd. - Key offerings
- Axis Bank Ltd. - Segment focus
- SWOT
- 15.5 Canara Bank
- Canara Bank - Overview
- Canara Bank - Product / Service
- Canara Bank - Key offerings
- SWOT
- 15.6 Cholamandalam Investment and Finance Co. Ltd.
- Cholamandalam Investment and Finance Co. Ltd. - Overview
- Cholamandalam Investment and Finance Co. Ltd. - Business segments
- Cholamandalam Investment and Finance Co. Ltd. - Key offerings
- Cholamandalam Investment and Finance Co. Ltd. - Segment focus
- SWOT
- 15.7 Finbud Financial Services Pvt Ltd
- Finbud Financial Services Pvt Ltd - Overview
- Finbud Financial Services Pvt Ltd - Product / Service
- Finbud Financial Services Pvt Ltd - Key offerings
- SWOT
- 15.8 HDFC Bank Ltd.
- HDFC Bank Ltd. - Overview
- HDFC Bank Ltd. - Business segments
- HDFC Bank Ltd. - Key offerings
- HDFC Bank Ltd. - Segment focus
- SWOT
- 15.9 HSBC Holdings Plc
- HSBC Holdings Plc - Overview
- HSBC Holdings Plc - Business segments
- HSBC Holdings Plc - Key offerings
- HSBC Holdings Plc - Segment focus
- SWOT
- 15.10 ICICI Bank Ltd.
- ICICI Bank Ltd. - Overview
- ICICI Bank Ltd. - Business segments
- ICICI Bank Ltd. - Key offerings
- ICICI Bank Ltd. - Segment focus
- SWOT
- 15.11 IDBI Bank Ltd.
- IDBI Bank Ltd. - Overview
- IDBI Bank Ltd. - Business segments
- IDBI Bank Ltd. - Key offerings
- IDBI Bank Ltd. - Segment focus
- SWOT
- 15.12 Indian Overseas Bank
- Indian Overseas Bank - Overview
- Indian Overseas Bank - Product / Service
- Indian Overseas Bank - Key offerings
- SWOT
- 15.13 Mahindra and Mahindra Financial Services Ltd.
- Mahindra and Mahindra Financial Services Ltd. - Overview
- Mahindra and Mahindra Financial Services Ltd. - Product / Service
- Mahindra and Mahindra Financial Services Ltd. - Key offerings
- SWOT
- 15.14 Punjab National Bank
- Punjab National Bank - Overview
- Punjab National Bank - Business segments
- Punjab National Bank - Key offerings
- Punjab National Bank - Segment focus
- SWOT
- 15.15 State Bank of India
- State Bank of India - Overview
- State Bank of India - Business segments
- State Bank of India - Key offerings
- State Bank of India - Segment focus
- SWOT
- 15.16 UCO BANK
- UCO BANK - Overview
- UCO BANK - Product / Service
- UCO BANK - Key offerings
- SWOT
- 15.17 Union Bank of India
- Union Bank of India - Overview
- Union Bank of India - Product / Service
- Union Bank of India - Key offerings
- SWOT
- 15.18 Whizdm Innovations Pvt. Ltd.
- Whizdm Innovations Pvt. Ltd. - Overview
- Whizdm Innovations Pvt. Ltd. - Product / Service
- Whizdm Innovations Pvt. Ltd. - Key offerings
- SWOT
16 Appendix
- 16.1 Scope of the report
- 16.2 Inclusions and exclusions checklist
- Inclusions checklist
- Exclusions checklist
- 16.3 Currency conversion rates for US$
- Currency conversion rates for US$
- 16.4 Research methodology
- Research methodology
- 16.5 Data procurement
- Information sources
- 16.6 Data validation
- Data validation
- 16.7 Validation techniques employed for market sizing
- Validation techniques employed for market sizing
- 16.8 Data synthesis
- Data synthesis
- 16.9 360 degree market analysis
- 360 degree market analysis
- 16.10 List of abbreviations
- List of abbreviations

