|
|
市場調査レポート
商品コード
1515775
スタンドアップパウチの世界市場 2024-2028Global stand-up pouches market 2024-2028 |
||||||
|
|||||||
カスタマイズ可能
|
|||||||

| スタンドアップパウチの世界市場 2024-2028 |
|
出版日: 2024年06月12日
発行: TechNavio
ページ情報: 英文 167 Pages
納期: 即納可能
|

全表示
- 概要
- 図表
- 目次
スタンドアップパウチ市場は2023-2028年に157億2,630万米ドル、予測期間中のCAGRは10.43%で成長すると予測されます。
当レポートでは、スタンドアップパウチ市場の全体的な分析、市場規模・予測、動向、成長促進要因、課題、約25のベンダーを網羅したベンダー分析などを掲載しています。
現在の市場シナリオ、最新動向と促進要因、市場環境全体に関する最新分析を提供しています。市場は、食品産業における便利なパッケージングへの需要の高まり、新興諸国からのスタンドアップパウチ需要の増加、軽量パッケージングへの注目の高まりによって牽引されています。
| 市場範囲 | |
|---|---|
| 基準年 | 2024 |
| 終了年 | 2028 |
| 予測期間 | 2024-2028 |
| 成長モメンタム | 加速 |
| 前年比2024年 | 8.64% |
| CAGR | 10.43% |
| 増分額 | 157億2,630万米ドル |
本調査では、今後数年間のスタンドアップパウチ市場成長を促進する主な理由の一つとして、持続可能な包装を推進するベンダーのイニシアティブの増加を挙げています。また、インテリジェントパッケージング技術やプラスチック廃棄物削減のための先進リサイクル技術やプログラムの浸透が進むことで、市場の大きな需要が見込まれます。
目次
第1章 エグゼクティブサマリー
- 市場概要
第2章 市場情勢
- 市場エコシステム
- 市場の特徴
- バリューチェーン分析
第3章 市場規模の評価
- 市場の定義
- 市場セグメント分析
- 市場規模 2023
- 市場の見通し 2023-2028
第4章 市場規模実績
- 世界スタンドアップパウチ市場 2018-2022
- 用途別セグメント分析 2018-2022
- タイプ別セグメント分析 2018-2022
- 地域別セグメント分析 2018-2022
- 国別セグメント分析 2018-2022
第5章 ファイブフォース分析
- ファイブフォースの要約
- 買い手の交渉力
- 供給企業の交渉力
- 新規参入業者の脅威
- 代替品の脅威
- 競争の脅威
- 市況
第6章 市場セグメンテーション:用途別
- 市場セグメンテーション
- 比較:用途別
- 飲食品:市場規模と予測 2023-2028
- パーソナルケアと化粧品:市場規模と予測 2023-2028
- ヘルスケア:市場規模と予測 2023-2028
- その他:市場規模と予測 2023-2028
- 市場機会:用途別
第7章 市場セグメンテーション:タイプ別
- 市場セグメンテーション
- 比較:タイプ別
- 無菌パウチ:市場規模と予測 2023-2028
- 標準パウチ:市場規模と予測 2023-2028
- レトルトパウチ:市場規模と予測 2023-2028
- 市場機会:タイプ別
第8章 顧客情勢
- 顧客情勢の概要
第9章 地域別情勢
- 地域別セグメンテーション
- 地域別比較
- アジア太平洋:市場規模と予測 2023-2028
- 北米:市場規模と予測 2023-2028
- 欧州:市場規模と予測 2023-2028
- 中東・アフリカ:市場規模と予測 2023-2028
- 南米:市場規模と予測 2023-2028
- 中国:市場規模と予測 2023-2028
- 米国:市場規模と予測 2023-2028
- 日本:市場規模と予測 2023-2028
- 英国:市場規模と予測 2023-2028
- ドイツ:市場規模と予測 2023-2028
- 市場機会:地域情勢別
第10章 促進要因・課題・機会・抑制要因
- 市場促進要因
- 市場の課題
- 促進要因と課題の影響
- 市場の機会・抑制要因
第11章 競合情勢
- 概要
- 競合情勢
- 混乱の状況
- 業界のリスク
第12章 競合分析
- 企業プロファイル
- 企業の市場ポジショニング
- Allegion Public Ltd. Co.
- Amcor Plc
- Berry Global Inc.
- Bryce Corp.
- Constantia Flexibles Group GmbH
- Coveris Management GmbH
- Guala Pack S.p.a.
- Huhtamaki Oyj
- Mondi Plc
- ProAmpac Holdings Inc.
- Sealed Air Corp.
- Smurfit Kappa Group
- Sonoco Products Co.
- Swiss Pac Pvt. Ltd.
- Wihuri International Oy
第13章 付録
Exhibits:
- Exhibits1: Executive Summary - Chart on Market Overview
- Exhibits2: Executive Summary - Data Table on Market Overview
- Exhibits3: Executive Summary - Chart on Global Market Characteristics
- Exhibits4: Executive Summary - Chart on Market By Geographical Landscape
- Exhibits5: Executive Summary - Chart on Market Segmentation by Application
- Exhibits6: Executive Summary - Chart on Market Segmentation by Type
- Exhibits7: Executive Summary - Chart on Incremental Growth
- Exhibits8: Executive Summary - Data Table on Incremental Growth
- Exhibits9: Executive Summary - Chart on Company Market Positioning
- Exhibits10: Parent Market
- Exhibits11: Data Table on - Parent Market
- Exhibits12: Market characteristics analysis
- Exhibits13: Value Chain Analysis
- Exhibits14: Offerings of companies included in the market definition
- Exhibits15: Market segments
- Exhibits16: Chart on Global - Market size and forecast 2023-2028 ($ million)
- Exhibits17: Data Table on Global - Market size and forecast 2023-2028 ($ million)
- Exhibits18: Chart on Global Market: Year-over-year growth 2023-2028 (%)
- Exhibits19: Data Table on Global Market: Year-over-year growth 2023-2028 (%)
- Exhibits20: Historic Market Size - Data Table on Global Stand-Up Pouches Market 2018 - 2022 ($ million)
- Exhibits21: Historic Market Size - Application Segment 2018 - 2022 ($ million)
- Exhibits22: Historic Market Size - Type Segment 2018 - 2022 ($ million)
- Exhibits23: Historic Market Size - Geography Segment 2018 - 2022 ($ million)
- Exhibits24: Historic Market Size - Country Segment 2018 - 2022 ($ million)
- Exhibits25: Five forces analysis - Comparison between 2023 and 2028
- Exhibits26: Bargaining power of buyers - Impact of key factors 2023 and 2028
- Exhibits27: Bargaining power of suppliers - Impact of key factors in 2023 and 2028
- Exhibits28: Threat of new entrants - Impact of key factors in 2023 and 2028
- Exhibits29: Threat of substitutes - Impact of key factors in 2023 and 2028
- Exhibits30: Threat of rivalry - Impact of key factors in 2023 and 2028
- Exhibits31: Chart on Market condition - Five forces 2023 and 2028
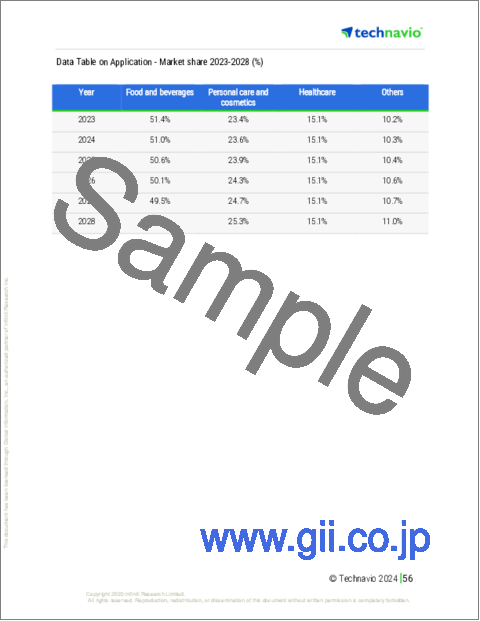
- Exhibits32: Chart on Application - Market share 2023-2028 (%)
- Exhibits33: Data Table on Application - Market share 2023-2028 (%)
- Exhibits34: Chart on Comparison by Application
- Exhibits35: Data Table on Comparison by Application
- Exhibits36: Chart on Food and beverages - Market size and forecast 2023-2028 ($ million)
- Exhibits37: Data Table on Food and beverages - Market size and forecast 2023-2028 ($ million)
- Exhibits38: Chart on Food and beverages - Year-over-year growth 2023-2028 (%)
- Exhibits39: Data Table on Food and beverages - Year-over-year growth 2023-2028 (%)
- Exhibits40: Chart on Personal care and cosmetics - Market size and forecast 2023-2028 ($ million)
- Exhibits41: Data Table on Personal care and cosmetics - Market size and forecast 2023-2028 ($ million)
- Exhibits42: Chart on Personal care and cosmetics - Year-over-year growth 2023-2028 (%)
- Exhibits43: Data Table on Personal care and cosmetics - Year-over-year growth 2023-2028 (%)
- Exhibits44: Chart on Healthcare - Market size and forecast 2023-2028 ($ million)
- Exhibits45: Data Table on Healthcare - Market size and forecast 2023-2028 ($ million)
- Exhibits46: Chart on Healthcare - Year-over-year growth 2023-2028 (%)
- Exhibits47: Data Table on Healthcare - Year-over-year growth 2023-2028 (%)
- Exhibits48: Chart on Others - Market size and forecast 2023-2028 ($ million)
- Exhibits49: Data Table on Others - Market size and forecast 2023-2028 ($ million)
- Exhibits50: Chart on Others - Year-over-year growth 2023-2028 (%)
- Exhibits51: Data Table on Others - Year-over-year growth 2023-2028 (%)
- Exhibits52: Market opportunity by Application ($ million)
- Exhibits53: Data Table on Market opportunity by Application ($ million)
- Exhibits54: Chart on Type - Market share 2023-2028 (%)
- Exhibits55: Data Table on Type - Market share 2023-2028 (%)
- Exhibits56: Chart on Comparison by Type
- Exhibits57: Data Table on Comparison by Type
- Exhibits58: Chart on Aseptic pouches - Market size and forecast 2023-2028 ($ million)
- Exhibits59: Data Table on Aseptic pouches - Market size and forecast 2023-2028 ($ million)
- Exhibits60: Chart on Aseptic pouches - Year-over-year growth 2023-2028 (%)
- Exhibits61: Data Table on Aseptic pouches - Year-over-year growth 2023-2028 (%)
- Exhibits62: Chart on Standard pouches - Market size and forecast 2023-2028 ($ million)
- Exhibits63: Data Table on Standard pouches - Market size and forecast 2023-2028 ($ million)
- Exhibits64: Chart on Standard pouches - Year-over-year growth 2023-2028 (%)
- Exhibits65: Data Table on Standard pouches - Year-over-year growth 2023-2028 (%)
- Exhibits66: Chart on Retort pouches - Market size and forecast 2023-2028 ($ million)
- Exhibits67: Data Table on Retort pouches - Market size and forecast 2023-2028 ($ million)
- Exhibits68: Chart on Retort pouches - Year-over-year growth 2023-2028 (%)
- Exhibits69: Data Table on Retort pouches - Year-over-year growth 2023-2028 (%)
- Exhibits70: Market opportunity by Type ($ million)
- Exhibits71: Data Table on Market opportunity by Type ($ million)
- Exhibits72: Analysis of price sensitivity, lifecycle, customer purchase basket, adoption rates, and purchase criteria
- Exhibits73: Chart on Market share By Geographical Landscape 2023-2028 (%)
- Exhibits74: Data Table on Market share By Geographical Landscape 2023-2028 (%)
- Exhibits75: Chart on Geographic comparison
- Exhibits76: Data Table on Geographic comparison
- Exhibits77: Chart on APAC - Market size and forecast 2023-2028 ($ million)
- Exhibits78: Data Table on APAC - Market size and forecast 2023-2028 ($ million)
- Exhibits79: Chart on APAC - Year-over-year growth 2023-2028 (%)
- Exhibits80: Data Table on APAC - Year-over-year growth 2023-2028 (%)
- Exhibits81: Chart on North America - Market size and forecast 2023-2028 ($ million)
- Exhibits82: Data Table on North America - Market size and forecast 2023-2028 ($ million)
- Exhibits83: Chart on North America - Year-over-year growth 2023-2028 (%)
- Exhibits84: Data Table on North America - Year-over-year growth 2023-2028 (%)
- Exhibits85: Chart on Europe - Market size and forecast 2023-2028 ($ million)
- Exhibits86: Data Table on Europe - Market size and forecast 2023-2028 ($ million)
- Exhibits87: Chart on Europe - Year-over-year growth 2023-2028 (%)
- Exhibits88: Data Table on Europe - Year-over-year growth 2023-2028 (%)
- Exhibits89: Chart on Middle East and Africa - Market size and forecast 2023-2028 ($ million)
- Exhibits90: Data Table on Middle East and Africa - Market size and forecast 2023-2028 ($ million)
- Exhibits91: Chart on Middle East and Africa - Year-over-year growth 2023-2028 (%)
- Exhibits92: Data Table on Middle East and Africa - Year-over-year growth 2023-2028 (%)
- Exhibits93: Chart on South America - Market size and forecast 2023-2028 ($ million)
- Exhibits94: Data Table on South America - Market size and forecast 2023-2028 ($ million)
- Exhibits95: Chart on South America - Year-over-year growth 2023-2028 (%)
- Exhibits96: Data Table on South America - Year-over-year growth 2023-2028 (%)
- Exhibits97: Chart on China - Market size and forecast 2023-2028 ($ million)
- Exhibits98: Data Table on China - Market size and forecast 2023-2028 ($ million)
- Exhibits99: Chart on China - Year-over-year growth 2023-2028 (%)
- Exhibits100: Data Table on China - Year-over-year growth 2023-2028 (%)
- Exhibits101: Chart on US - Market size and forecast 2023-2028 ($ million)
- Exhibits102: Data Table on US - Market size and forecast 2023-2028 ($ million)
- Exhibits103: Chart on US - Year-over-year growth 2023-2028 (%)
- Exhibits104: Data Table on US - Year-over-year growth 2023-2028 (%)
- Exhibits105: Chart on Japan - Market size and forecast 2023-2028 ($ million)
- Exhibits106: Data Table on Japan - Market size and forecast 2023-2028 ($ million)
- Exhibits107: Chart on Japan - Year-over-year growth 2023-2028 (%)
- Exhibits108: Data Table on Japan - Year-over-year growth 2023-2028 (%)
- Exhibits109: Chart on UK - Market size and forecast 2023-2028 ($ million)
- Exhibits110: Data Table on UK - Market size and forecast 2023-2028 ($ million)
- Exhibits111: Chart on UK - Year-over-year growth 2023-2028 (%)
- Exhibits112: Data Table on UK - Year-over-year growth 2023-2028 (%)
- Exhibits113: Chart on Germany - Market size and forecast 2023-2028 ($ million)
- Exhibits114: Data Table on Germany - Market size and forecast 2023-2028 ($ million)
- Exhibits115: Chart on Germany - Year-over-year growth 2023-2028 (%)
- Exhibits116: Data Table on Germany - Year-over-year growth 2023-2028 (%)
- Exhibits117: Market opportunity By Geographical Landscape ($ million)
- Exhibits118: Data Tables on Market opportunity By Geographical Landscape ($ million)
- Exhibits119: Impact of drivers and challenges in 2023 and 2028
- Exhibits120: Overview on criticality of inputs and factors of differentiation
- Exhibits121: Overview on factors of disruption
- Exhibits122: Impact of key risks on business
- Exhibits123: Companies covered
- Exhibits124: Matrix on companies position and classification
- Exhibits125: Allegion Public Ltd. Co. - Overview
- Exhibits126: Allegion Public Ltd. Co. - Business segments
- Exhibits127: Allegion Public Ltd. Co. - Key news
- Exhibits128: Allegion Public Ltd. Co. - Key offerings
- Exhibits129: Allegion Public Ltd. Co. - Segment focus
- Exhibits130: Amcor Plc - Overview
- Exhibits131: Amcor Plc - Business segments
- Exhibits132: Amcor Plc - Key news
- Exhibits133: Amcor Plc - Key offerings
- Exhibits134: Amcor Plc - Segment focus
- Exhibits135: Berry Global Inc. - Overview
- Exhibits136: Berry Global Inc. - Business segments
- Exhibits137: Berry Global Inc. - Key news
- Exhibits138: Berry Global Inc. - Key offerings
- Exhibits139: Berry Global Inc. - Segment focus
- Exhibits140: Bryce Corp. - Overview
- Exhibits141: Bryce Corp. - Product / Service
- Exhibits142: Bryce Corp. - Key offerings
- Exhibits143: Constantia Flexibles Group GmbH - Overview
- Exhibits144: Constantia Flexibles Group GmbH - Product / Service
- Exhibits145: Constantia Flexibles Group GmbH - Key news
- Exhibits146: Constantia Flexibles Group GmbH - Key offerings
- Exhibits147: Coveris Management GmbH - Overview
- Exhibits148: Coveris Management GmbH - Product / Service
- Exhibits149: Coveris Management GmbH - Key offerings
- Exhibits150: Guala Pack S.p.a. - Overview
- Exhibits151: Guala Pack S.p.a. - Product / Service
- Exhibits152: Guala Pack S.p.a. - Key offerings
- Exhibits153: Huhtamaki Oyj - Overview
- Exhibits154: Huhtamaki Oyj - Business segments
- Exhibits155: Huhtamaki Oyj - Key news
- Exhibits156: Huhtamaki Oyj - Key offerings
- Exhibits157: Huhtamaki Oyj - Segment focus
- Exhibits158: Mondi Plc - Overview
- Exhibits159: Mondi Plc - Business segments
- Exhibits160: Mondi Plc - Key news
- Exhibits161: Mondi Plc - Key offerings
- Exhibits162: Mondi Plc - Segment focus
- Exhibits163: ProAmpac Holdings Inc. - Overview
- Exhibits164: ProAmpac Holdings Inc. - Product / Service
- Exhibits165: ProAmpac Holdings Inc. - Key news
- Exhibits166: ProAmpac Holdings Inc. - Key offerings
- Exhibits167: Sealed Air Corp. - Overview
- Exhibits168: Sealed Air Corp. - Business segments
- Exhibits169: Sealed Air Corp. - Key news
- Exhibits170: Sealed Air Corp. - Key offerings
- Exhibits171: Sealed Air Corp. - Segment focus
- Exhibits172: Smurfit Kappa Group - Overview
- Exhibits173: Smurfit Kappa Group - Business segments
- Exhibits174: Smurfit Kappa Group - Key news
- Exhibits175: Smurfit Kappa Group - Key offerings
- Exhibits176: Smurfit Kappa Group - Segment focus
- Exhibits177: Sonoco Products Co. - Overview
- Exhibits178: Sonoco Products Co. - Business segments
- Exhibits179: Sonoco Products Co. - Key news
- Exhibits180: Sonoco Products Co. - Key offerings
- Exhibits181: Sonoco Products Co. - Segment focus
- Exhibits182: Swiss Pac Pvt. Ltd. - Overview
- Exhibits183: Swiss Pac Pvt. Ltd. - Product / Service
- Exhibits184: Swiss Pac Pvt. Ltd. - Key offerings
- Exhibits185: Wihuri International Oy - Overview
- Exhibits186: Wihuri International Oy - Product / Service
- Exhibits187: Wihuri International Oy - Key offerings
- Exhibits188: Inclusions checklist
- Exhibits189: Exclusions checklist
- Exhibits190: Currency conversion rates for US$
- Exhibits191: Research methodology
- Exhibits192: Information sources
- Exhibits193: Data validation
- Exhibits194: Validation techniques employed for market sizing
- Exhibits195: Data synthesis
- Exhibits196: 360 degree market analysis
- Exhibits197: List of abbreviations
The stand-up pouches market is forecasted to grow by USD 15726.3 mn during 2023-2028, accelerating at a CAGR of 10.43% during the forecast period. The report on the stand-up pouches market provides a holistic analysis, market size and forecast, trends, growth drivers, and challenges, as well as vendor analysis covering around 25 vendors.
The report offers an up-to-date analysis regarding the current market scenario, the latest trends and drivers, and the overall market environment. The market is driven by growing demand for convenient packaging in food industry, increasing demand for stand-up pouches from developing countries, and rising focus on lightweight packaging.
Technavio's stand-up pouches market is segmented as below:
| Market Scope | |
|---|---|
| Base Year | 2024 |
| End Year | 2028 |
| Series Year | 2024-2028 |
| Growth Momentum | Accelerate |
| YOY 2024 | 8.64% |
| CAGR | 10.43% |
| Incremental Value | $15726.3mn |
ByApplication
- Food and beverages
- Personal care and cosmetics
- Healthcare
- Others
ByType
- Aseptic pouches
- Standard pouches
- Retort pouches
ByGeography
- APAC
- North America
- Europe
- Middle East and Africa
- South America
This study identifies the increasing vendor initiatives to promote sustainable packaging as one of the prime reasons driving the stand-up pouches market growth during the next few years. Also, increasing penetration of intelligent packaging technology and advanced recycling technologies and programs for reducing plastic waste will lead to sizable demand in the market.
The report on the stand-up pouches market covers the following areas:
- Stand-up pouches market sizing
- Stand-up pouches market forecast
- Stand-up pouches market industry analysis
The robust vendor analysis is designed to help clients improve their market position, and in line with this, this report provides a detailed analysis of several leading stand-up pouches market vendors that include Allegion Public Ltd. Co., Amcor Plc, Berry Global Inc., Bryce Corp., Clondalkin Group Holdings BV, Constantia Flexibles Group GmbH, Coveris Management GmbH, Flexible Packaging LLC, Glenroy Inc., Guala Pack S.p.a., Huhtamaki Oyj, Mondi Plc, Packman Packaging Pvt. Ltd., ProAmpac Holdings Inc., Sealed Air Corp., Smurfit Kappa Group, Sonoco Products Co., Swiss Pac Pvt. Ltd., UFlex Ltd., and Wihuri International Oy. Also, the stand-up pouches market analysis report includes information on upcoming trends and challenges that will influence market growth. This is to help companies strategize and leverage all forthcoming growth opportunities.
The study was conducted using an objective combination of primary and secondary information including inputs from key participants in the industry. The report contains a comprehensive market and vendor landscape in addition to an analysis of the key vendors.
The publisher presents a detailed picture of the market by the way of study, synthesis, and summation of data from multiple sources by an analysis of key parameters such as profit, pricing, competition, and promotions. It presents various market facets by identifying the key industry influencers. The data presented is comprehensive, reliable, and a result of extensive research - both primary and secondary. The market research reports provide a complete competitive landscape and an in-depth vendor selection methodology and analysis using qualitative and quantitative research to forecast the accurate market growth.
Table of Contents
1 Executive Summary
- 1.1 Market overview
- Executive Summary - Chart on Market Overview
- Executive Summary - Data Table on Market Overview
- Executive Summary - Chart on Global Market Characteristics
- Executive Summary - Chart on Market By Geographical Landscape
- Executive Summary - Chart on Market Segmentation by Application
- Executive Summary - Chart on Market Segmentation by Type
- Executive Summary - Chart on Incremental Growth
- Executive Summary - Data Table on Incremental Growth
- Executive Summary - Chart on Company Market Positioning
2 Market Landscape
- 2.1 Market ecosystem
- Parent Market
- Data Table on - Parent Market
- 2.2 Market characteristics
- Market characteristics analysis
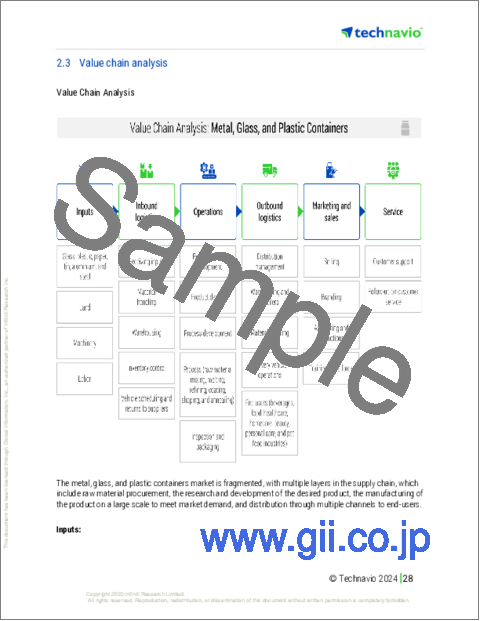
- 2.3 Value chain analysis
- Value Chain Analysis
3 Market Sizing
- 3.1 Market definition
- Offerings of companies included in the market definition
- 3.2 Market segment analysis
- Market segments
- 3.3 Market size 2023
- 3.4 Market outlook: Forecast for 2023-2028
- Chart on Global - Market size and forecast 2023-2028 ($ million)
- Data Table on Global - Market size and forecast 2023-2028 ($ million)
- Chart on Global Market: Year-over-year growth 2023-2028 (%)
- Data Table on Global Market: Year-over-year growth 2023-2028 (%)
4 Historic Market Size
- 4.1 Global Stand-Up Pouches Market 2018 - 2022
- Historic Market Size - Data Table on Global Stand-Up Pouches Market 2018 - 2022 ($ million)
- 4.2 Application segment analysis 2018 - 2022
- Historic Market Size - Application Segment 2018 - 2022 ($ million)
- 4.3 Type segment analysis 2018 - 2022
- Historic Market Size - Type Segment 2018 - 2022 ($ million)
- 4.4 Geography segment analysis 2018 - 2022
- Historic Market Size - Geography Segment 2018 - 2022 ($ million)
- 4.5 Country segment analysis 2018 - 2022
- Historic Market Size - Country Segment 2018 - 2022 ($ million)
5 Five Forces Analysis
- 5.1 Five forces summary
- Five forces analysis - Comparison between 2023 and 2028
- 5.2 Bargaining power of buyers
- Bargaining power of buyers - Impact of key factors 2023 and 2028
- 5.3 Bargaining power of suppliers
- Bargaining power of suppliers - Impact of key factors in 2023 and 2028
- 5.4 Threat of new entrants
- Threat of new entrants - Impact of key factors in 2023 and 2028
- 5.5 Threat of substitutes
- Threat of substitutes - Impact of key factors in 2023 and 2028
- 5.6 Threat of rivalry
- Threat of rivalry - Impact of key factors in 2023 and 2028
- 5.7 Market condition
- Chart on Market condition - Five forces 2023 and 2028
6 Market Segmentation by Application
- 6.1 Market segments
- Chart on Application - Market share 2023-2028 (%)
- Data Table on Application - Market share 2023-2028 (%)
- 6.2 Comparison by Application
- Chart on Comparison by Application
- Data Table on Comparison by Application
- 6.3 Food and beverages - Market size and forecast 2023-2028
- Chart on Food and beverages - Market size and forecast 2023-2028 ($ million)
- Data Table on Food and beverages - Market size and forecast 2023-2028 ($ million)
- Chart on Food and beverages - Year-over-year growth 2023-2028 (%)
- Data Table on Food and beverages - Year-over-year growth 2023-2028 (%)
- 6.4 Personal care and cosmetics - Market size and forecast 2023-2028
- Chart on Personal care and cosmetics - Market size and forecast 2023-2028 ($ million)
- Data Table on Personal care and cosmetics - Market size and forecast 2023-2028 ($ million)
- Chart on Personal care and cosmetics - Year-over-year growth 2023-2028 (%)
- Data Table on Personal care and cosmetics - Year-over-year growth 2023-2028 (%)
- 6.5 Healthcare - Market size and forecast 2023-2028
- Chart on Healthcare - Market size and forecast 2023-2028 ($ million)
- Data Table on Healthcare - Market size and forecast 2023-2028 ($ million)
- Chart on Healthcare - Year-over-year growth 2023-2028 (%)
- Data Table on Healthcare - Year-over-year growth 2023-2028 (%)
- 6.6 Others - Market size and forecast 2023-2028
- Chart on Others - Market size and forecast 2023-2028 ($ million)
- Data Table on Others - Market size and forecast 2023-2028 ($ million)
- Chart on Others - Year-over-year growth 2023-2028 (%)
- Data Table on Others - Year-over-year growth 2023-2028 (%)
- 6.7 Market opportunity by Application
- Market opportunity by Application ($ million)
- Data Table on Market opportunity by Application ($ million)
7 Market Segmentation by Type
- 7.1 Market segments
- Chart on Type - Market share 2023-2028 (%)
- Data Table on Type - Market share 2023-2028 (%)
- 7.2 Comparison by Type
- Chart on Comparison by Type
- Data Table on Comparison by Type
- 7.3 Aseptic pouches - Market size and forecast 2023-2028
- Chart on Aseptic pouches - Market size and forecast 2023-2028 ($ million)
- Data Table on Aseptic pouches - Market size and forecast 2023-2028 ($ million)
- Chart on Aseptic pouches - Year-over-year growth 2023-2028 (%)
- Data Table on Aseptic pouches - Year-over-year growth 2023-2028 (%)
- 7.4 Standard pouches - Market size and forecast 2023-2028
- Chart on Standard pouches - Market size and forecast 2023-2028 ($ million)
- Data Table on Standard pouches - Market size and forecast 2023-2028 ($ million)
- Chart on Standard pouches - Year-over-year growth 2023-2028 (%)
- Data Table on Standard pouches - Year-over-year growth 2023-2028 (%)
- 7.5 Retort pouches - Market size and forecast 2023-2028
- Chart on Retort pouches - Market size and forecast 2023-2028 ($ million)
- Data Table on Retort pouches - Market size and forecast 2023-2028 ($ million)
- Chart on Retort pouches - Year-over-year growth 2023-2028 (%)
- Data Table on Retort pouches - Year-over-year growth 2023-2028 (%)
- 7.6 Market opportunity by Type
- Market opportunity by Type ($ million)
- Data Table on Market opportunity by Type ($ million)
8 Customer Landscape
- 8.1 Customer landscape overview
- Analysis of price sensitivity, lifecycle, customer purchase basket, adoption rates, and purchase criteria
9 Geographic Landscape
- 9.1 Geographic segmentation
- Chart on Market share By Geographical Landscape 2023-2028 (%)
- Data Table on Market share By Geographical Landscape 2023-2028 (%)
- 9.2 Geographic comparison
- Chart on Geographic comparison
- Data Table on Geographic comparison
- 9.3 APAC - Market size and forecast 2023-2028
- Chart on APAC - Market size and forecast 2023-2028 ($ million)
- Data Table on APAC - Market size and forecast 2023-2028 ($ million)
- Chart on APAC - Year-over-year growth 2023-2028 (%)
- Data Table on APAC - Year-over-year growth 2023-2028 (%)
- 9.4 North America - Market size and forecast 2023-2028
- Chart on North America - Market size and forecast 2023-2028 ($ million)
- Data Table on North America - Market size and forecast 2023-2028 ($ million)
- Chart on North America - Year-over-year growth 2023-2028 (%)
- Data Table on North America - Year-over-year growth 2023-2028 (%)
- 9.5 Europe - Market size and forecast 2023-2028
- Chart on Europe - Market size and forecast 2023-2028 ($ million)
- Data Table on Europe - Market size and forecast 2023-2028 ($ million)
- Chart on Europe - Year-over-year growth 2023-2028 (%)
- Data Table on Europe - Year-over-year growth 2023-2028 (%)
- 9.6 Middle East and Africa - Market size and forecast 2023-2028
- Chart on Middle East and Africa - Market size and forecast 2023-2028 ($ million)
- Data Table on Middle East and Africa - Market size and forecast 2023-2028 ($ million)
- Chart on Middle East and Africa - Year-over-year growth 2023-2028 (%)
- Data Table on Middle East and Africa - Year-over-year growth 2023-2028 (%)
- 9.7 South America - Market size and forecast 2023-2028
- Chart on South America - Market size and forecast 2023-2028 ($ million)
- Data Table on South America - Market size and forecast 2023-2028 ($ million)
- Chart on South America - Year-over-year growth 2023-2028 (%)
- Data Table on South America - Year-over-year growth 2023-2028 (%)
- 9.8 China - Market size and forecast 2023-2028
- Chart on China - Market size and forecast 2023-2028 ($ million)
- Data Table on China - Market size and forecast 2023-2028 ($ million)
- Chart on China - Year-over-year growth 2023-2028 (%)
- Data Table on China - Year-over-year growth 2023-2028 (%)
- 9.9 US - Market size and forecast 2023-2028
- Chart on US - Market size and forecast 2023-2028 ($ million)
- Data Table on US - Market size and forecast 2023-2028 ($ million)
- Chart on US - Year-over-year growth 2023-2028 (%)
- Data Table on US - Year-over-year growth 2023-2028 (%)
- 9.10 Japan - Market size and forecast 2023-2028
- Chart on Japan - Market size and forecast 2023-2028 ($ million)
- Data Table on Japan - Market size and forecast 2023-2028 ($ million)
- Chart on Japan - Year-over-year growth 2023-2028 (%)
- Data Table on Japan - Year-over-year growth 2023-2028 (%)
- 9.11 UK - Market size and forecast 2023-2028
- Chart on UK - Market size and forecast 2023-2028 ($ million)
- Data Table on UK - Market size and forecast 2023-2028 ($ million)
- Chart on UK - Year-over-year growth 2023-2028 (%)
- Data Table on UK - Year-over-year growth 2023-2028 (%)
- 9.12 Germany - Market size and forecast 2023-2028
- Chart on Germany - Market size and forecast 2023-2028 ($ million)
- Data Table on Germany - Market size and forecast 2023-2028 ($ million)
- Chart on Germany - Year-over-year growth 2023-2028 (%)
- Data Table on Germany - Year-over-year growth 2023-2028 (%)
- 9.13 Market opportunity By Geographical Landscape
- Market opportunity By Geographical Landscape ($ million)
- Data Tables on Market opportunity By Geographical Landscape ($ million)
10 Drivers, Challenges, and Opportunity/Restraints
- 10.1 Market drivers
- 10.2 Market challenges
- 10.3 Impact of drivers and challenges
- Impact of drivers and challenges in 2023 and 2028
- 10.4 Market opportunities/restraints
11 Competitive Landscape
- 11.1 Overview
- 11.2 Competitive Landscape
- Overview on criticality of inputs and factors of differentiation
- 11.3 Landscape disruption
- Overview on factors of disruption
- 11.4 Industry risks
- Impact of key risks on business
12 Competitive Analysis
- 12.1 Companies profiled
- Companies covered
- 12.2 Market positioning of companies
- Matrix on companies position and classification
- 12.3 Allegion Public Ltd. Co.
- Allegion Public Ltd. Co. - Overview
- Allegion Public Ltd. Co. - Business segments
- Allegion Public Ltd. Co. - Key news
- Allegion Public Ltd. Co. - Key offerings
- Allegion Public Ltd. Co. - Segment focus
- 12.4 Amcor Plc
- Amcor Plc - Overview
- Amcor Plc - Business segments
- Amcor Plc - Key news
- Amcor Plc - Key offerings
- Amcor Plc - Segment focus
- 12.5 Berry Global Inc.
- Berry Global Inc. - Overview
- Berry Global Inc. - Business segments
- Berry Global Inc. - Key news
- Berry Global Inc. - Key offerings
- Berry Global Inc. - Segment focus
- 12.6 Bryce Corp.
- Bryce Corp. - Overview
- Bryce Corp. - Product / Service
- Bryce Corp. - Key offerings
- 12.7 Constantia Flexibles Group GmbH
- Constantia Flexibles Group GmbH - Overview
- Constantia Flexibles Group GmbH - Product / Service
- Constantia Flexibles Group GmbH - Key news
- Constantia Flexibles Group GmbH - Key offerings
- 12.8 Coveris Management GmbH
- Coveris Management GmbH - Overview
- Coveris Management GmbH - Product / Service
- Coveris Management GmbH - Key offerings
- 12.9 Guala Pack S.p.a.
- Guala Pack S.p.a. - Overview
- Guala Pack S.p.a. - Product / Service
- Guala Pack S.p.a. - Key offerings
- 12.10 Huhtamaki Oyj
- Huhtamaki Oyj - Overview
- Huhtamaki Oyj - Business segments
- Huhtamaki Oyj - Key news
- Huhtamaki Oyj - Key offerings
- Huhtamaki Oyj - Segment focus
- 12.11 Mondi Plc
- Mondi Plc - Overview
- Mondi Plc - Business segments
- Mondi Plc - Key news
- Mondi Plc - Key offerings
- Mondi Plc - Segment focus
- 12.12 ProAmpac Holdings Inc.
- ProAmpac Holdings Inc. - Overview
- ProAmpac Holdings Inc. - Product / Service
- ProAmpac Holdings Inc. - Key news
- ProAmpac Holdings Inc. - Key offerings
- 12.13 Sealed Air Corp.
- Sealed Air Corp. - Overview
- Sealed Air Corp. - Business segments
- Sealed Air Corp. - Key news
- Sealed Air Corp. - Key offerings
- Sealed Air Corp. - Segment focus
- 12.14 Smurfit Kappa Group
- Smurfit Kappa Group - Overview
- Smurfit Kappa Group - Business segments
- Smurfit Kappa Group - Key news
- Smurfit Kappa Group - Key offerings
- Smurfit Kappa Group - Segment focus
- 12.15 Sonoco Products Co.
- Sonoco Products Co. - Overview
- Sonoco Products Co. - Business segments
- Sonoco Products Co. - Key news
- Sonoco Products Co. - Key offerings
- Sonoco Products Co. - Segment focus
- 12.16 Swiss Pac Pvt. Ltd.
- Swiss Pac Pvt. Ltd. - Overview
- Swiss Pac Pvt. Ltd. - Product / Service
- Swiss Pac Pvt. Ltd. - Key offerings
- 12.17 Wihuri International Oy
- Wihuri International Oy - Overview
- Wihuri International Oy - Product / Service
- Wihuri International Oy - Key offerings
13 Appendix
- 13.1 Scope of the report
- 13.2 Inclusions and exclusions checklist
- Inclusions checklist
- Exclusions checklist
- 13.3 Currency conversion rates for US$
- Currency conversion rates for US$
- 13.4 Research methodology
- Research methodology
- 13.5 Data procurement
- Information sources
- 13.6 Data validation
- Data validation
- 13.7 Validation techniques employed for market sizing
- Validation techniques employed for market sizing
- 13.8 Data synthesis
- Data synthesis
- 13.9 360 degree market analysis
- 360 degree market analysis
- 13.10 List of abbreviations
- List of abbreviations

