|
|
市場調査レポート
商品コード
1544499
農産物向け工業用乾燥機の世界市場 2024-2028Global Industrial Dryers Market for Agricultural Products Market 2024-2028 |
||||||
|
|||||||
カスタマイズ可能
|
|||||||


| 農産物向け工業用乾燥機の世界市場 2024-2028 |
|
出版日: 2024年07月12日
発行: TechNavio
ページ情報: 英文 173 Pages
納期: 即納可能
|

全表示
- 概要
- 図表
- 目次
農産物向け工業用乾燥機の世界市場2024-2028
農産物向け工業用乾燥機市場は2023-2028年に1億6,950万米ドル、予測期間中のCAGRは3.95%で成長すると予測されます。当レポートでは、農産物向け工業用乾燥機市場の全体的な分析、市場規模と予測、動向、成長促進要因、約25のベンダーを網羅したベンダー分析などを掲載しています。
現在の市場シナリオ、最新動向と促進要因、市場環境全体に関する最新分析を提供しています。市場は、乾燥形態の食品生産の増加、食品加工における凍結乾燥装置の需要の増加、食品加工産業における工場の拡張によって牽引されています。
| 市場範囲 | |
|---|---|
| 基準年 | 2024 |
| 終了年 | 2028 |
| 予測期間 | 2024-2028 |
| 成長モメンタム | 加速 |
| 前年比2024年 | 3.75% |
| CAGR | 3.95% |
| 増分額 | 1億6,950万米ドル |
本調査では、今後数年間の農産物向け工業用乾燥機市場の成長を促進する主な要因の1つとして、エネルギー効率とコスト効率に優れた乾燥機の普及を挙げています。また、自動化された多機能乾燥システムの人気の高まりと、食品カプセル化のためのスプレー乾燥装置の応用は、市場の大きな需要につながります。
目次
第1章 エグゼクティブサマリー
- 市場概要
第2章 市場情勢
- 市場エコシステム
- 市場の特徴
- バリューチェーン分析
第3章 市場規模の評価
- 市場の定義
- 市場セグメント分析
- 市場規模 2023
- 市場の見通し 2023-2028
第4章 市場規模実績
- 農産物向け工業用乾燥機の世界市場 2018-2022
- タイプ別セグメント分析 2018-2022
- 用途別セグメント分析 2018-2022
- 地域別セグメント分析 2018-2022
- 国別セグメント分析 2018-2022
第5章 ファイブフォース分析
- ファイブフォースの要約
- 買い手の交渉力
- 供給企業の交渉力
- 新規参入業者の脅威
- 代替品の脅威
- 競争の脅威
- 市況
第6章 市場セグメンテーション:タイプ別
- 市場セグメンテーション
- 比較:タイプ別
- 熱風乾燥装置:市場規模と予測 2023-2028
- 加熱表面乾燥装置:市場規模と予測 2023-2028
- その他:市場規模と予測 2023-2028
- 市場機会:タイプ別
第7章 市場セグメンテーション:用途別
- 市場セグメンテーション
- 比較:用途別
- 野菜:市場規模と予測 2023-2028
- 果物:市場規模と予測 2023-2028
- ナッツ:市場規模と予測 2023-2028
- その他:市場規模と予測 2023-2028
- 市場機会:用途別
第8章 顧客情勢
- 顧客情勢の概要
第9章 地域別情勢
- 地域別セグメンテーション
- 地域別比較
- アジア太平洋:市場規模と予測 2023-2028
- 北米:市場規模と予測 2023-2028
- 欧州:市場規模と予測 2023-2028
- 南米:市場規模と予測 2023-2028
- 中東・アフリカ:市場規模と予測 2023-2028
- 米国:市場規模と予測 2023-2028
- 中国:市場規模と予測 2023-2028
- 英国:市場規模と予測 2023-2028
- ドイツ:市場規模と予測 2023-2028
- 日本:市場規模と予測 2023-2028
- 市場機会:地域情勢別
第10章 促進要因・課題・機会・抑制要因
- 市場促進要因
- 市場の課題
- 促進要因と課題の影響
- 市場の機会・抑制要因
第11章 競合情勢
- 概要
- 競合情勢
- 混乱の状況
- 業界のリスク
第12章 競合分析
- 企業プロファイル
- 企業の市場ポジショニング
- Agridry Dryers Pty Ltd.
- Andritz AG
- Binder and Theilen Dehydration GmbH and Co. KG
- Bucher Industries AG
- Buhler AG
- GEA Group AG
- GrainPro Inc.
- Henan Boda Microwave Equipment Co. Ltd.
- Malnutrition Matters
- MechaTech Systems Ltd.
- My Solar Dryer
- New AVM Systech Pvt. Ltd.
- OKAWARA MFG. Co. Ltd.
- SSP Pvt. Ltd.
- Turatti Srl
第13章 付録
Exhibits:
- Exhibits1: Executive Summary - Chart on Market Overview
- Exhibits2: Executive Summary - Data Table on Market Overview
- Exhibits3: Executive Summary - Chart on Global Market Characteristics
- Exhibits4: Executive Summary - Chart on Market By Geographical Landscape
- Exhibits5: Executive Summary - Chart on Market Segmentation by Type
- Exhibits6: Executive Summary - Chart on Market Segmentation by Application
- Exhibits7: Executive Summary - Chart on Incremental Growth
- Exhibits8: Executive Summary - Data Table on Incremental Growth
- Exhibits9: Executive Summary - Chart on Company Market Positioning
- Exhibits10: Parent Market
- Exhibits11: Data Table on - Parent Market
- Exhibits12: Market characteristics analysis
- Exhibits13: Value Chain Analysis
- Exhibits14: Offerings of companies included in the market definition
- Exhibits15: Market segments
- Exhibits16: Chart on Global - Market size and forecast 2023-2028 ($ million)
- Exhibits17: Data Table on Global - Market size and forecast 2023-2028 ($ million)
- Exhibits18: Chart on Global Market: Year-over-year growth 2023-2028 (%)
- Exhibits19: Data Table on Global Market: Year-over-year growth 2023-2028 (%)
- Exhibits20: Historic Market Size - Data Table on Global Industrial Dryers Market For Agricultural Products Market 2018 - 2022 ($ million)
- Exhibits21: Historic Market Size - Type Segment 2018 - 2022 ($ million)
- Exhibits22: Historic Market Size - Application Segment 2018 - 2022 ($ million)
- Exhibits23: Historic Market Size - Geography Segment 2018 - 2022 ($ million)
- Exhibits24: Historic Market Size - Country Segment 2018 - 2022 ($ million)
- Exhibits25: Five forces analysis - Comparison between 2023 and 2028
- Exhibits26: Bargaining power of buyers - Impact of key factors 2023 and 2028
- Exhibits27: Bargaining power of suppliers - Impact of key factors in 2023 and 2028
- Exhibits28: Threat of new entrants - Impact of key factors in 2023 and 2028
- Exhibits29: Threat of substitutes - Impact of key factors in 2023 and 2028
- Exhibits30: Threat of rivalry - Impact of key factors in 2023 and 2028
- Exhibits31: Chart on Market condition - Five forces 2023 and 2028
- Exhibits32: Chart on Type - Market share 2023-2028 (%)
- Exhibits33: Data Table on Type - Market share 2023-2028 (%)
- Exhibits34: Chart on Comparison by Type
- Exhibits35: Data Table on Comparison by Type
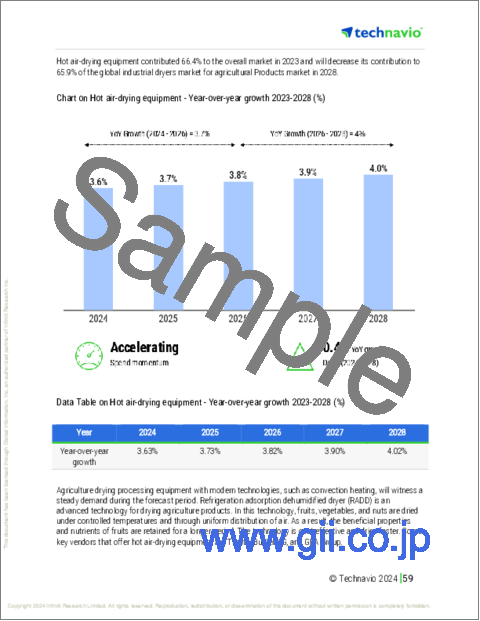
- Exhibits36: Chart on Hot air-drying equipment - Market size and forecast 2023-2028 ($ million)
- Exhibits37: Data Table on Hot air-drying equipment - Market size and forecast 2023-2028 ($ million)
- Exhibits38: Chart on Hot air-drying equipment - Year-over-year growth 2023-2028 (%)
- Exhibits39: Data Table on Hot air-drying equipment - Year-over-year growth 2023-2028 (%)
- Exhibits40: Chart on Heated-surface drying equipment - Market size and forecast 2023-2028 ($ million)
- Exhibits41: Data Table on Heated-surface drying equipment - Market size and forecast 2023-2028 ($ million)
- Exhibits42: Chart on Heated-surface drying equipment - Year-over-year growth 2023-2028 (%)
- Exhibits43: Data Table on Heated-surface drying equipment - Year-over-year growth 2023-2028 (%)
- Exhibits44: Chart on Others - Market size and forecast 2023-2028 ($ million)
- Exhibits45: Data Table on Others - Market size and forecast 2023-2028 ($ million)
- Exhibits46: Chart on Others - Year-over-year growth 2023-2028 (%)
- Exhibits47: Data Table on Others - Year-over-year growth 2023-2028 (%)
- Exhibits48: Market opportunity by Type ($ million)
- Exhibits49: Data Table on Market opportunity by Type ($ million)
- Exhibits50: Chart on Application - Market share 2023-2028 (%)
- Exhibits51: Data Table on Application - Market share 2023-2028 (%)
- Exhibits52: Chart on Comparison by Application
- Exhibits53: Data Table on Comparison by Application
- Exhibits54: Chart on Vegetables - Market size and forecast 2023-2028 ($ million)
- Exhibits55: Data Table on Vegetables - Market size and forecast 2023-2028 ($ million)
- Exhibits56: Chart on Vegetables - Year-over-year growth 2023-2028 (%)
- Exhibits57: Data Table on Vegetables - Year-over-year growth 2023-2028 (%)
- Exhibits58: Chart on Fruits - Market size and forecast 2023-2028 ($ million)
- Exhibits59: Data Table on Fruits - Market size and forecast 2023-2028 ($ million)
- Exhibits60: Chart on Fruits - Year-over-year growth 2023-2028 (%)
- Exhibits61: Data Table on Fruits - Year-over-year growth 2023-2028 (%)
- Exhibits62: Chart on Nuts - Market size and forecast 2023-2028 ($ million)
- Exhibits63: Data Table on Nuts - Market size and forecast 2023-2028 ($ million)
- Exhibits64: Chart on Nuts - Year-over-year growth 2023-2028 (%)
- Exhibits65: Data Table on Nuts - Year-over-year growth 2023-2028 (%)
- Exhibits66: Chart on Others - Market size and forecast 2023-2028 ($ million)
- Exhibits67: Data Table on Others - Market size and forecast 2023-2028 ($ million)
- Exhibits68: Chart on Others - Year-over-year growth 2023-2028 (%)
- Exhibits69: Data Table on Others - Year-over-year growth 2023-2028 (%)
- Exhibits70: Market opportunity by Application ($ million)
- Exhibits71: Data Table on Market opportunity by Application ($ million)
- Exhibits72: Analysis of price sensitivity, lifecycle, customer purchase basket, adoption rates, and purchase criteria
- Exhibits73: Chart on Market share By Geographical Landscape 2023-2028 (%)
- Exhibits74: Data Table on Market share By Geographical Landscape 2023-2028 (%)
- Exhibits75: Chart on Geographic comparison
- Exhibits76: Data Table on Geographic comparison
- Exhibits77: Chart on APAC - Market size and forecast 2023-2028 ($ million)
- Exhibits78: Data Table on APAC - Market size and forecast 2023-2028 ($ million)
- Exhibits79: Chart on APAC - Year-over-year growth 2023-2028 (%)
- Exhibits80: Data Table on APAC - Year-over-year growth 2023-2028 (%)
- Exhibits81: Chart on North America - Market size and forecast 2023-2028 ($ million)
- Exhibits82: Data Table on North America - Market size and forecast 2023-2028 ($ million)
- Exhibits83: Chart on North America - Year-over-year growth 2023-2028 (%)
- Exhibits84: Data Table on North America - Year-over-year growth 2023-2028 (%)
- Exhibits85: Chart on Europe - Market size and forecast 2023-2028 ($ million)
- Exhibits86: Data Table on Europe - Market size and forecast 2023-2028 ($ million)
- Exhibits87: Chart on Europe - Year-over-year growth 2023-2028 (%)
- Exhibits88: Data Table on Europe - Year-over-year growth 2023-2028 (%)
- Exhibits89: Chart on South America - Market size and forecast 2023-2028 ($ million)
- Exhibits90: Data Table on South America - Market size and forecast 2023-2028 ($ million)
- Exhibits91: Chart on South America - Year-over-year growth 2023-2028 (%)
- Exhibits92: Data Table on South America - Year-over-year growth 2023-2028 (%)
- Exhibits93: Chart on Middle East and Africa - Market size and forecast 2023-2028 ($ million)
- Exhibits94: Data Table on Middle East and Africa - Market size and forecast 2023-2028 ($ million)
- Exhibits95: Chart on Middle East and Africa - Year-over-year growth 2023-2028 (%)
- Exhibits96: Data Table on Middle East and Africa - Year-over-year growth 2023-2028 (%)
- Exhibits97: Chart on US - Market size and forecast 2023-2028 ($ million)
- Exhibits98: Data Table on US - Market size and forecast 2023-2028 ($ million)
- Exhibits99: Chart on US - Year-over-year growth 2023-2028 (%)
- Exhibits100: Data Table on US - Year-over-year growth 2023-2028 (%)
- Exhibits101: Chart on China - Market size and forecast 2023-2028 ($ million)
- Exhibits102: Data Table on China - Market size and forecast 2023-2028 ($ million)
- Exhibits103: Chart on China - Year-over-year growth 2023-2028 (%)
- Exhibits104: Data Table on China - Year-over-year growth 2023-2028 (%)
- Exhibits105: Chart on UK - Market size and forecast 2023-2028 ($ million)
- Exhibits106: Data Table on UK - Market size and forecast 2023-2028 ($ million)
- Exhibits107: Chart on UK - Year-over-year growth 2023-2028 (%)
- Exhibits108: Data Table on UK - Year-over-year growth 2023-2028 (%)
- Exhibits109: Chart on Germany - Market size and forecast 2023-2028 ($ million)
- Exhibits110: Data Table on Germany - Market size and forecast 2023-2028 ($ million)
- Exhibits111: Chart on Germany - Year-over-year growth 2023-2028 (%)
- Exhibits112: Data Table on Germany - Year-over-year growth 2023-2028 (%)
- Exhibits113: Chart on Japan - Market size and forecast 2023-2028 ($ million)
- Exhibits114: Data Table on Japan - Market size and forecast 2023-2028 ($ million)
- Exhibits115: Chart on Japan - Year-over-year growth 2023-2028 (%)
- Exhibits116: Data Table on Japan - Year-over-year growth 2023-2028 (%)
- Exhibits117: Market opportunity By Geographical Landscape ($ million)
- Exhibits118: Data Tables on Market opportunity By Geographical Landscape ($ million)
- Exhibits119: Impact of drivers and challenges in 2023 and 2028
- Exhibits120: Overview on criticality of inputs and factors of differentiation
- Exhibits121: Overview on factors of disruption
- Exhibits122: Impact of key risks on business
- Exhibits123: Companies covered
- Exhibits124: Matrix on companies position and classification
- Exhibits125: Agridry Dryers Pty Ltd. - Overview
- Exhibits126: Agridry Dryers Pty Ltd. - Product / Service
- Exhibits127: Agridry Dryers Pty Ltd. - Key offerings
- Exhibits128: Andritz AG - Overview
- Exhibits129: Andritz AG - Business segments
- Exhibits130: Andritz AG - Key news
- Exhibits131: Andritz AG - Key offerings
- Exhibits132: Andritz AG - Segment focus
- Exhibits133: Binder and Theilen Dehydration GmbH and Co. KG - Overview
- Exhibits134: Binder and Theilen Dehydration GmbH and Co. KG - Product / Service
- Exhibits135: Binder and Theilen Dehydration GmbH and Co. KG - Key offerings
- Exhibits136: Bucher Industries AG - Overview
- Exhibits137: Bucher Industries AG - Business segments
- Exhibits138: Bucher Industries AG - Key offerings
- Exhibits139: Bucher Industries AG - Segment focus
- Exhibits140: Buhler AG - Overview
- Exhibits141: Buhler AG - Business segments
- Exhibits142: Buhler AG - Key news
- Exhibits143: Buhler AG - Key offerings
- Exhibits144: Buhler AG - Segment focus
- Exhibits145: GEA Group AG - Overview
- Exhibits146: GEA Group AG - Business segments
- Exhibits147: GEA Group AG - Key news
- Exhibits148: GEA Group AG - Key offerings
- Exhibits149: GEA Group AG - Segment focus
- Exhibits150: GrainPro Inc. - Overview
- Exhibits151: GrainPro Inc. - Product / Service
- Exhibits152: GrainPro Inc. - Key offerings
- Exhibits153: Henan Boda Microwave Equipment Co. Ltd. - Overview
- Exhibits154: Henan Boda Microwave Equipment Co. Ltd. - Product / Service
- Exhibits155: Henan Boda Microwave Equipment Co. Ltd. - Key offerings
- Exhibits156: Malnutrition Matters - Overview
- Exhibits157: Malnutrition Matters - Product / Service
- Exhibits158: Malnutrition Matters - Key offerings
- Exhibits159: MechaTech Systems Ltd. - Overview
- Exhibits160: MechaTech Systems Ltd. - Product / Service
- Exhibits161: MechaTech Systems Ltd. - Key offerings
- Exhibits162: My Solar Dryer - Overview
- Exhibits163: My Solar Dryer - Product / Service
- Exhibits164: My Solar Dryer - Key offerings
- Exhibits165: New AVM Systech Pvt. Ltd. - Overview
- Exhibits166: New AVM Systech Pvt. Ltd. - Product / Service
- Exhibits167: New AVM Systech Pvt. Ltd. - Key offerings
- Exhibits168: OKAWARA MFG. Co. Ltd. - Overview
- Exhibits169: OKAWARA MFG. Co. Ltd. - Product / Service
- Exhibits170: OKAWARA MFG. Co. Ltd. - Key offerings
- Exhibits171: SSP Pvt. Ltd. - Overview
- Exhibits172: SSP Pvt. Ltd. - Product / Service
- Exhibits173: SSP Pvt. Ltd. - Key offerings
- Exhibits174: Turatti Srl - Overview
- Exhibits175: Turatti Srl - Product / Service
- Exhibits176: Turatti Srl - Key offerings
- Exhibits177: Inclusions checklist
- Exhibits178: Exclusions checklist
- Exhibits179: Currency conversion rates for US$
- Exhibits180: Research methodology
- Exhibits181: Information sources
- Exhibits182: Data validation
- Exhibits183: Validation techniques employed for market sizing
- Exhibits184: Data synthesis
- Exhibits185: 360 degree market analysis
- Exhibits186: List of abbreviations
Global Industrial Dryers For Agricultural Products Market 2024-2028
The industrial dryers for agricultural products market is forecasted to grow by USD 169.5 mn during 2023-2028, accelerating at a CAGR of 3.95% during the forecast period. The report on the industrial dryers for agricultural products market provides a holistic analysis, market size and forecast, trends, growth drivers, and challenges, as well as vendor analysis covering around 25 vendors.
The report offers an up-to-date analysis regarding the current market scenario, the latest trends and drivers, and the overall market environment. The market is driven by increasing production of food products in dried forms, increasing demand for freeze-drying equipment in food processing, and expansions of plants in food processing industry.
| Market Scope | |
|---|---|
| Base Year | 2024 |
| End Year | 2028 |
| Series Year | 2024-2028 |
| Growth Momentum | Accelerate |
| YOY 2024 | 3.75% |
| CAGR | 3.95% |
| Incremental Value | $169.5 mn |
Technavio's industrial dryers for agricultural products market is segmented as below:
By Type
- Hot air-drying equipment
- Heated-surface drying equipment
- Others
By Application
- Vegetables
- Fruits
- Nuts
- Others
By Geographical Landscape
- APAC
- North America
- Europe
- South America
- Middle East and Africa
This study identifies the energy and cost-efficient dryers gaining traction as one of the prime reasons driving the industrial dryers for agricultural products market growth during the next few years. Also, growing popularity of automated multifunctional drying systems and application of spray drying equipment for food encapsulation will lead to sizable demand in the market.
The report on the industrial dryers for agricultural products market covers the following areas:
- Industrial dryers for agricultural products market sizing
- Industrial dryers for agricultural products market forecast
- Industrial dryers for agricultural products market industry analysis
The robust vendor analysis is designed to help clients improve their market position, and in line with this, this report provides a detailed analysis of several leading industrial dryers for agricultural products market vendors that include Agridry Dryers Pty Ltd., Andritz AG, Binder and Theilen Dehydration GmbH and Co. KG, Bucher Industries AG, Buhler AG, Effimax Solar, GEA Group AG, GrainPro Inc., Henan Boda Microwave Equipment Co. Ltd., JUA Technologies International LLC, Malnutrition Matters, MechaTech Systems Ltd., My Solar Dryer, New AVM Systech Pvt. Ltd., OKAWARA MFG. Co. Ltd., Radha Energy Cell, Rudra Solar Energy, Science For Society Techno Services Pvt. Ltd., SSP Pvt. Ltd., TAYLORMADE RENEWABLES LTD., Thompson Dryers, and Turatti Srl. Also, the industrial dryers for agricultural products market analysis report includes information on upcoming trends and challenges that will influence market growth. This is to help companies strategize and leverage all forthcoming growth opportunities.
The study was conducted using an objective combination of primary and secondary information including inputs from key participants in the industry. The report contains a comprehensive market and vendor landscape in addition to an analysis of the key vendors.
The publisher presents a detailed picture of the market by the way of study, synthesis, and summation of data from multiple sources by an analysis of key parameters such as profit, pricing, competition, and promotions. It presents various market facets by identifying the key industry influencers. The data presented is comprehensive, reliable, and a result of extensive research - both primary and secondary. The market research reports provide a complete competitive landscape and an in-depth vendor selection methodology and analysis using qualitative and quantitative research to forecast the accurate market growth.
Table of Contents
1 Executive Summary
- 1.1 Market overview
- Executive Summary - Chart on Market Overview
- Executive Summary - Data Table on Market Overview
- Executive Summary - Chart on Global Market Characteristics
- Executive Summary - Chart on Market By Geographical Landscape
- Executive Summary - Chart on Market Segmentation by Type
- Executive Summary - Chart on Market Segmentation by Application
- Executive Summary - Chart on Incremental Growth
- Executive Summary - Data Table on Incremental Growth
- Executive Summary - Chart on Company Market Positioning
2 Market Landscape
- 2.1 Market ecosystem
- Parent Market
- Data Table on - Parent Market
- 2.2 Market characteristics
- Market characteristics analysis
- 2.3 Value chain analysis
- Value Chain Analysis
3 Market Sizing
- 3.1 Market definition
- Offerings of companies included in the market definition
- 3.2 Market segment analysis
- Market segments
- 3.3 Market size 2023
- 3.4 Market outlook: Forecast for 2023-2028
- Chart on Global - Market size and forecast 2023-2028 ($ million)
- Data Table on Global - Market size and forecast 2023-2028 ($ million)
- Chart on Global Market: Year-over-year growth 2023-2028 (%)
- Data Table on Global Market: Year-over-year growth 2023-2028 (%)
4 Historic Market Size
- 4.1 Global Industrial Dryers Market For Agricultural Products Market 2018 - 2022
- Historic Market Size - Data Table on Global Industrial Dryers Market For Agricultural Products Market 2018 - 2022 ($ million)
- 4.2 Type segment analysis 2018 - 2022
- Historic Market Size - Type Segment 2018 - 2022 ($ million)
- 4.3 Application segment analysis 2018 - 2022
- Historic Market Size - Application Segment 2018 - 2022 ($ million)
- 4.4 Geography segment analysis 2018 - 2022
- Historic Market Size - Geography Segment 2018 - 2022 ($ million)
- 4.5 Country segment analysis 2018 - 2022
- Historic Market Size - Country Segment 2018 - 2022 ($ million)
5 Five Forces Analysis
- 5.1 Five forces summary
- Five forces analysis - Comparison between 2023 and 2028
- 5.2 Bargaining power of buyers
- Bargaining power of buyers - Impact of key factors 2023 and 2028
- 5.3 Bargaining power of suppliers
- Bargaining power of suppliers - Impact of key factors in 2023 and 2028
- 5.4 Threat of new entrants
- Threat of new entrants - Impact of key factors in 2023 and 2028
- 5.5 Threat of substitutes
- Threat of substitutes - Impact of key factors in 2023 and 2028
- 5.6 Threat of rivalry
- Threat of rivalry - Impact of key factors in 2023 and 2028
- 5.7 Market condition
- Chart on Market condition - Five forces 2023 and 2028
6 Market Segmentation by Type
- 6.1 Market segments
- Chart on Type - Market share 2023-2028 (%)
- Data Table on Type - Market share 2023-2028 (%)
- 6.2 Comparison by Type
- Chart on Comparison by Type
- Data Table on Comparison by Type
- 6.3 Hot air-drying equipment - Market size and forecast 2023-2028
- Chart on Hot air-drying equipment - Market size and forecast 2023-2028 ($ million)
- Data Table on Hot air-drying equipment - Market size and forecast 2023-2028 ($ million)
- Chart on Hot air-drying equipment - Year-over-year growth 2023-2028 (%)
- Data Table on Hot air-drying equipment - Year-over-year growth 2023-2028 (%)
- 6.4 Heated-surface drying equipment - Market size and forecast 2023-2028
- Chart on Heated-surface drying equipment - Market size and forecast 2023-2028 ($ million)
- Data Table on Heated-surface drying equipment - Market size and forecast 2023-2028 ($ million)
- Chart on Heated-surface drying equipment - Year-over-year growth 2023-2028 (%)
- Data Table on Heated-surface drying equipment - Year-over-year growth 2023-2028 (%)
- 6.5 Others - Market size and forecast 2023-2028
- Chart on Others - Market size and forecast 2023-2028 ($ million)
- Data Table on Others - Market size and forecast 2023-2028 ($ million)
- Chart on Others - Year-over-year growth 2023-2028 (%)
- Data Table on Others - Year-over-year growth 2023-2028 (%)
- 6.6 Market opportunity by Type
- Market opportunity by Type ($ million)
- Data Table on Market opportunity by Type ($ million)
7 Market Segmentation by Application
- 7.1 Market segments
- Chart on Application - Market share 2023-2028 (%)
- Data Table on Application - Market share 2023-2028 (%)
- 7.2 Comparison by Application
- Chart on Comparison by Application
- Data Table on Comparison by Application
- 7.3 Vegetables - Market size and forecast 2023-2028
- Chart on Vegetables - Market size and forecast 2023-2028 ($ million)
- Data Table on Vegetables - Market size and forecast 2023-2028 ($ million)
- Chart on Vegetables - Year-over-year growth 2023-2028 (%)
- Data Table on Vegetables - Year-over-year growth 2023-2028 (%)
- 7.4 Fruits - Market size and forecast 2023-2028
- Chart on Fruits - Market size and forecast 2023-2028 ($ million)
- Data Table on Fruits - Market size and forecast 2023-2028 ($ million)
- Chart on Fruits - Year-over-year growth 2023-2028 (%)
- Data Table on Fruits - Year-over-year growth 2023-2028 (%)
- 7.5 Nuts - Market size and forecast 2023-2028
- Chart on Nuts - Market size and forecast 2023-2028 ($ million)
- Data Table on Nuts - Market size and forecast 2023-2028 ($ million)
- Chart on Nuts - Year-over-year growth 2023-2028 (%)
- Data Table on Nuts - Year-over-year growth 2023-2028 (%)
- 7.6 Others - Market size and forecast 2023-2028
- Chart on Others - Market size and forecast 2023-2028 ($ million)
- Data Table on Others - Market size and forecast 2023-2028 ($ million)
- Chart on Others - Year-over-year growth 2023-2028 (%)
- Data Table on Others - Year-over-year growth 2023-2028 (%)
- 7.7 Market opportunity by Application
- Market opportunity by Application ($ million)
- Data Table on Market opportunity by Application ($ million)
8 Customer Landscape
- 8.1 Customer landscape overview
- Analysis of price sensitivity, lifecycle, customer purchase basket, adoption rates, and purchase criteria
9 Geographic Landscape
- 9.1 Geographic segmentation
- Chart on Market share By Geographical Landscape 2023-2028 (%)
- Data Table on Market share By Geographical Landscape 2023-2028 (%)
- 9.2 Geographic comparison
- Chart on Geographic comparison
- Data Table on Geographic comparison
- 9.3 APAC - Market size and forecast 2023-2028
- Chart on APAC - Market size and forecast 2023-2028 ($ million)
- Data Table on APAC - Market size and forecast 2023-2028 ($ million)
- Chart on APAC - Year-over-year growth 2023-2028 (%)
- Data Table on APAC - Year-over-year growth 2023-2028 (%)
- 9.4 North America - Market size and forecast 2023-2028
- Chart on North America - Market size and forecast 2023-2028 ($ million)
- Data Table on North America - Market size and forecast 2023-2028 ($ million)
- Chart on North America - Year-over-year growth 2023-2028 (%)
- Data Table on North America - Year-over-year growth 2023-2028 (%)
- 9.5 Europe - Market size and forecast 2023-2028
- Chart on Europe - Market size and forecast 2023-2028 ($ million)
- Data Table on Europe - Market size and forecast 2023-2028 ($ million)
- Chart on Europe - Year-over-year growth 2023-2028 (%)
- Data Table on Europe - Year-over-year growth 2023-2028 (%)
- 9.6 South America - Market size and forecast 2023-2028
- Chart on South America - Market size and forecast 2023-2028 ($ million)
- Data Table on South America - Market size and forecast 2023-2028 ($ million)
- Chart on South America - Year-over-year growth 2023-2028 (%)
- Data Table on South America - Year-over-year growth 2023-2028 (%)
- 9.7 Middle East and Africa - Market size and forecast 2023-2028
- Chart on Middle East and Africa - Market size and forecast 2023-2028 ($ million)
- Data Table on Middle East and Africa - Market size and forecast 2023-2028 ($ million)
- Chart on Middle East and Africa - Year-over-year growth 2023-2028 (%)
- Data Table on Middle East and Africa - Year-over-year growth 2023-2028 (%)
- 9.8 US - Market size and forecast 2023-2028
- Chart on US - Market size and forecast 2023-2028 ($ million)
- Data Table on US - Market size and forecast 2023-2028 ($ million)
- Chart on US - Year-over-year growth 2023-2028 (%)
- Data Table on US - Year-over-year growth 2023-2028 (%)
- 9.9 China - Market size and forecast 2023-2028
- Chart on China - Market size and forecast 2023-2028 ($ million)
- Data Table on China - Market size and forecast 2023-2028 ($ million)
- Chart on China - Year-over-year growth 2023-2028 (%)
- Data Table on China - Year-over-year growth 2023-2028 (%)
- 9.10 UK - Market size and forecast 2023-2028
- Chart on UK - Market size and forecast 2023-2028 ($ million)
- Data Table on UK - Market size and forecast 2023-2028 ($ million)
- Chart on UK - Year-over-year growth 2023-2028 (%)
- Data Table on UK - Year-over-year growth 2023-2028 (%)
- 9.11 Germany - Market size and forecast 2023-2028
- Chart on Germany - Market size and forecast 2023-2028 ($ million)
- Data Table on Germany - Market size and forecast 2023-2028 ($ million)
- Chart on Germany - Year-over-year growth 2023-2028 (%)
- Data Table on Germany - Year-over-year growth 2023-2028 (%)
- 9.12 Japan - Market size and forecast 2023-2028
- Chart on Japan - Market size and forecast 2023-2028 ($ million)
- Data Table on Japan - Market size and forecast 2023-2028 ($ million)
- Chart on Japan - Year-over-year growth 2023-2028 (%)
- Data Table on Japan - Year-over-year growth 2023-2028 (%)
- 9.13 Market opportunity By Geographical Landscape
- Market opportunity By Geographical Landscape ($ million)
- Data Tables on Market opportunity By Geographical Landscape ($ million)
10 Drivers, Challenges, and Opportunity/Restraints
- 10.1 Market drivers
- 10.2 Market challenges
- 10.3 Impact of drivers and challenges
- Impact of drivers and challenges in 2023 and 2028
- 10.4 Market opportunities/restraints
11 Competitive Landscape
- 11.1 Overview
- 11.2 Competitive Landscape
- Overview on criticality of inputs and factors of differentiation
- 11.3 Landscape disruption
- Overview on factors of disruption
- 11.4 Industry risks
- Impact of key risks on business
12 Competitive Analysis
- 12.1 Companies profiled
- Companies covered
- 12.2 Market positioning of companies
- Matrix on companies position and classification
- 12.3 Agridry Dryers Pty Ltd.
- Agridry Dryers Pty Ltd. - Overview
- Agridry Dryers Pty Ltd. - Product / Service
- Agridry Dryers Pty Ltd. - Key offerings
- 12.4 Andritz AG
- Andritz AG - Overview
- Andritz AG - Business segments
- Andritz AG - Key news
- Andritz AG - Key offerings
- Andritz AG - Segment focus
- 12.5 Binder and Theilen Dehydration GmbH and Co. KG
- Binder and Theilen Dehydration GmbH and Co. KG - Overview
- Binder and Theilen Dehydration GmbH and Co. KG - Product / Service
- Binder and Theilen Dehydration GmbH and Co. KG - Key offerings
- 12.6 Bucher Industries AG
- Bucher Industries AG - Overview
- Bucher Industries AG - Business segments
- Bucher Industries AG - Key offerings
- Bucher Industries AG - Segment focus
- 12.7 Buhler AG
- Buhler AG - Overview
- Buhler AG - Business segments
- Buhler AG - Key news
- Buhler AG - Key offerings
- Buhler AG - Segment focus
- 12.8 GEA Group AG
- GEA Group AG - Overview
- GEA Group AG - Business segments
- GEA Group AG - Key news
- GEA Group AG - Key offerings
- GEA Group AG - Segment focus
- 12.9 GrainPro Inc.
- GrainPro Inc. - Overview
- GrainPro Inc. - Product / Service
- GrainPro Inc. - Key offerings
- 12.10 Henan Boda Microwave Equipment Co. Ltd.
- Henan Boda Microwave Equipment Co. Ltd. - Overview
- Henan Boda Microwave Equipment Co. Ltd. - Product / Service
- Henan Boda Microwave Equipment Co. Ltd. - Key offerings
- 12.11 Malnutrition Matters
- Malnutrition Matters - Overview
- Malnutrition Matters - Product / Service
- Malnutrition Matters - Key offerings
- 12.12 MechaTech Systems Ltd.
- MechaTech Systems Ltd. - Overview
- MechaTech Systems Ltd. - Product / Service
- MechaTech Systems Ltd. - Key offerings
- 12.13 My Solar Dryer
- My Solar Dryer - Overview
- My Solar Dryer - Product / Service
- My Solar Dryer - Key offerings
- 12.14 New AVM Systech Pvt. Ltd.
- New AVM Systech Pvt. Ltd. - Overview
- New AVM Systech Pvt. Ltd. - Product / Service
- New AVM Systech Pvt. Ltd. - Key offerings
- 12.15 OKAWARA MFG. Co. Ltd.
- OKAWARA MFG. Co. Ltd. - Overview
- OKAWARA MFG. Co. Ltd. - Product / Service
- OKAWARA MFG. Co. Ltd. - Key offerings
- 12.16 SSP Pvt. Ltd.
- SSP Pvt. Ltd. - Overview
- SSP Pvt. Ltd. - Product / Service
- SSP Pvt. Ltd. - Key offerings
- 12.17 Turatti Srl
- Turatti Srl - Overview
- Turatti Srl - Product / Service
- Turatti Srl - Key offerings
13 Appendix
- 13.1 Scope of the report
- 13.2 Inclusions and exclusions checklist
- Inclusions checklist
- Exclusions checklist
- 13.3 Currency conversion rates for US$
- Currency conversion rates for US$
- 13.4 Research methodology
- Research methodology
- 13.5 Data procurement
- Information sources
- 13.6 Data validation
- Data validation
- 13.7 Validation techniques employed for market sizing
- Validation techniques employed for market sizing
- 13.8 Data synthesis
- Data synthesis
- 13.9 360 degree market analysis
- 360 degree market analysis
- 13.10 List of abbreviations
- List of abbreviations

