|
|
市場調査レポート
商品コード
1275471
オーガニックシュガーの世界市場 2023-2027Global Organic Sugar Market 2023-2027 |
||||||
|
|
|||||||
|
● お客様のご希望に応じて、既存データの加工や未掲載情報(例:国別セグメント)の追加などの対応が可能です。 詳細はお問い合わせください。 |
|||||||


| オーガニックシュガーの世界市場 2023-2027 |
|
出版日: 2023年04月24日
発行: TechNavio
ページ情報: 英文 148 Pages
納期: 即納可能
|
- 全表示
- 概要
- 図表
- 目次
当レポートでは、オーガニックシュガー市場を監視し、2022年から2027年の間にCAGR 5.98%で10億6,216万米ドル成長すると予測しています。
当レポートでは、オーガニックシュガー市場について、全体的な分析、市場規模・予測、動向、成長促進要因・課題、約25のベンダーをカバーするベンダー分析などを掲載しています。
現在の市場シナリオ、最新動向と促進要因、市場環境全体に関する最新の分析を提供しています。健康志向の高まり、可処分所得の増加、食品加工業の増加などが市場を牽引しています。
本調査では、今後数年間のオーガニックシュガー市場の成長を促進する主な理由の一つとして、eコマースプラットフォームの登場を挙げています。また、有機農業への投資の増加や天然甘味料への需要の高まりは、市場の大きな需要につながるでしょう。
目次
第1章 エグゼクティブサマリー
- 市場概要
第2章 市場情勢
- 市場エコシステム
第3章 市場規模
- 市場の定義
- 市場セグメント分析
- 市場規模 2022
- 市場の見通し 2022-2027
第4章 市場規模実績
- オーガニックシュガーの世界市場 2017-2021
- タイプセグメント分析 2017-2021
- 流通チャネルセグメント分析 2017-2021
- 地域別セグメント分析 2017-2021
- 国別セグメント分析 2017-2021
第5章 ファイブフォース分析
- ファイブフォースの要約
- 買い手の交渉力
- 供給企業の交渉力
- 新規参入業者の脅威
- 代替品の脅威
- 競争の脅威
- 市況
第6章 市場セグメンテーション:タイプ別
- 市場セグメント
- 比較:タイプ別
- クリスタル:市場規模と予測 2022-2027
- 糖蜜:市場規模と予測 2022-2027
- 市場機会:タイプ別
第7章 市場セグメンテーション:流通チャネル別
- 市場セグメント
- 比較:流通チャネル別
- オフライン:市場規模と予測 2022-2027
- オンライン:市場規模と予測 2022-2027
- 市場機会:流通チャネル別
第8章 顧客情勢
- 顧客情勢の概要
第9章 地域別情勢
- 地域別セグメンテーション
- 地域別比較
- 北米:市場規模と予測 2022-2027
- 欧州:市場規模と予測 2022-2027
- アジア太平洋:市場規模と予測 2022-2027
- 南米:市場規模と予測 2022-2027
- 中東・アフリカ:市場規模と予測 2022-2027
- 米国:市場規模と予測 2022-2027
- 中国:市場規模と予測 2022-2027
- ドイツ:市場規模と予測 2022-2027
- 英国:市場規模と予測 2022-2027
- 日本:市場規模と予測 2022-2027
- 市場機会:地域別
第10章 促進要因、課題、および動向
- 市場促進要因
- 市場の課題
- 促進要因と課題の影響
- 市場動向
第11章 ベンダー情勢
- 概要
- ベンダー情勢
- 混乱の状況
- 業界のリスク
第12章 ベンダー分析
- 対象ベンダー
- ベンダーの市場ポジショニング
- Big Tree Farms Inc.
- Madhava Ltd.
- Mehrotra Consumer Products Pvt. Ltd.
- Mitr Phol Group
- Nimbark Organic
- NOW Health Group Inc.
- Pronatec AG
- PT Mega Inovasi Organik
- Raizen Energia SA
- Sudzucker AG
- Tereos Group
- The Coconut Company UK Ltd.
- The Groovy Food Co.
- Tradin Organic Agriculture B.V.
- Treelife
第13章 付録
Exhibits:
- Exhibits1: Executive Summary - Chart on Market Overview
- Exhibits2: Executive Summary - Data Table on Market Overview
- Exhibits3: Executive Summary - Chart on Global Market Characteristics
- Exhibits4: Executive Summary - Chart on Market by Geography
- Exhibits5: Executive Summary - Chart on Market Segmentation by Type
- Exhibits6: Executive Summary - Chart on Market Segmentation by Distribution Channel
- Exhibits7: Executive Summary - Chart on Incremental Growth
- Exhibits8: Executive Summary - Data Table on Incremental Growth
- Exhibits9: Executive Summary - Chart on Vendor Market Positioning
- Exhibits10: Parent market
- Exhibits11: Market Characteristics
- Exhibits12: Offerings of vendors included in the market definition
- Exhibits13: Market segments
- Exhibits14: Chart on Global - Market size and forecast 2022-2027 ($ million)
- Exhibits15: Data Table on Global - Market size and forecast 2022-2027 ($ million)
- Exhibits16: Chart on Global Market: Year-over-year growth 2022-2027 (%)
- Exhibits17: Data Table on Global Market: Year-over-year growth 2022-2027 (%)
- Exhibits18: Historic Market Size - Data Table on global organic sugar market 2017 - 2021 ($ million)
- Exhibits19: Historic Market Size - Type Segment 2017 - 2021 ($ million)
- Exhibits20: Historic Market Size - Distribution Channel Segment 2017 - 2021 ($ million)
- Exhibits21: Historic Market Size - Geography Segment 2017 - 2021 ($ million)
- Exhibits22: Historic Market Size - Country Segment 2017 - 2021 ($ million)
- Exhibits23: Five forces analysis - Comparison between 2022 and 2027
- Exhibits24: Chart on Bargaining power of buyers - Impact of key factors 2022 and 2027
- Exhibits25: Bargaining power of suppliers - Impact of key factors in 2022 and 2027
- Exhibits26: Threat of new entrants - Impact of key factors in 2022 and 2027
- Exhibits27: Threat of substitutes - Impact of key factors in 2022 and 2027
- Exhibits28: Threat of rivalry - Impact of key factors in 2022 and 2027
- Exhibits29: Chart on Market condition - Five forces 2022 and 2027
- Exhibits30: Chart on Type - Market share 2022-2027 (%)
- Exhibits31: Data Table on Type - Market share 2022-2027 (%)
- Exhibits32: Chart on Comparison by Type
- Exhibits33: Data Table on Comparison by Type
- Exhibits34: Chart on Crystals - Market size and forecast 2022-2027 ($ million)
- Exhibits35: Data Table on Crystals - Market size and forecast 2022-2027 ($ million)
- Exhibits36: Chart on Crystals - Year-over-year growth 2022-2027 (%)
- Exhibits37: Data Table on Crystals - Year-over-year growth 2022-2027 (%)
- Exhibits38: Chart on Molasses - Market size and forecast 2022-2027 ($ million)
- Exhibits39: Data Table on Molasses - Market size and forecast 2022-2027 ($ million)
- Exhibits40: Chart on Molasses - Year-over-year growth 2022-2027 (%)
- Exhibits41: Data Table on Molasses - Year-over-year growth 2022-2027 (%)
- Exhibits42: Market opportunity by Type ($ million)
- Exhibits43: Data Table on Market opportunity by Type ($ million)
- Exhibits44: Chart on Distribution Channel - Market share 2022-2027 (%)
- Exhibits45: Data Table on Distribution Channel - Market share 2022-2027 (%)
- Exhibits46: Chart on Comparison by Distribution Channel
- Exhibits47: Data Table on Comparison by Distribution Channel
- Exhibits48: Chart on Offline - Market size and forecast 2022-2027 ($ million)
- Exhibits49: Data Table on Offline - Market size and forecast 2022-2027 ($ million)
- Exhibits50: Chart on Offline - Year-over-year growth 2022-2027 (%)
- Exhibits51: Data Table on Offline - Year-over-year growth 2022-2027 (%)
- Exhibits52: Chart on Online - Market size and forecast 2022-2027 ($ million)
- Exhibits53: Data Table on Online - Market size and forecast 2022-2027 ($ million)
- Exhibits54: Chart on Online - Year-over-year growth 2022-2027 (%)
- Exhibits55: Data Table on Online - Year-over-year growth 2022-2027 (%)
- Exhibits56: Market opportunity by Distribution Channel ($ million)
- Exhibits57: Data Table on Market opportunity by Distribution Channel ($ million)
- Exhibits58: Analysis of price sensitivity, lifecycle, customer purchase basket, adoption rates, and purchase criteria
- Exhibits59: Chart on Market share by geography 2022-2027 (%)
- Exhibits60: Data Table on Market share by geography 2022-2027 (%)
- Exhibits61: Chart on Geographic comparison
- Exhibits62: Data Table on Geographic comparison
- Exhibits63: Chart on North America - Market size and forecast 2022-2027 ($ million)
- Exhibits64: Data Table on North America - Market size and forecast 2022-2027 ($ million)
- Exhibits65: Chart on North America - Year-over-year growth 2022-2027 (%)
- Exhibits66: Data Table on North America - Year-over-year growth 2022-2027 (%)
- Exhibits67: Chart on Europe - Market size and forecast 2022-2027 ($ million)
- Exhibits68: Data Table on Europe - Market size and forecast 2022-2027 ($ million)
- Exhibits69: Chart on Europe - Year-over-year growth 2022-2027 (%)
- Exhibits70: Data Table on Europe - Year-over-year growth 2022-2027 (%)
- Exhibits71: Chart on APAC - Market size and forecast 2022-2027 ($ million)
- Exhibits72: Data Table on APAC - Market size and forecast 2022-2027 ($ million)
- Exhibits73: Chart on APAC - Year-over-year growth 2022-2027 (%)
- Exhibits74: Data Table on APAC - Year-over-year growth 2022-2027 (%)
- Exhibits75: Chart on South America - Market size and forecast 2022-2027 ($ million)
- Exhibits76: Data Table on South America - Market size and forecast 2022-2027 ($ million)
- Exhibits77: Chart on South America - Year-over-year growth 2022-2027 (%)
- Exhibits78: Data Table on South America - Year-over-year growth 2022-2027 (%)
- Exhibits79: Chart on Middle East and Africa - Market size and forecast 2022-2027 ($ million)
- Exhibits80: Data Table on Middle East and Africa - Market size and forecast 2022-2027 ($ million)
- Exhibits81: Chart on Middle East and Africa - Year-over-year growth 2022-2027 (%)
- Exhibits82: Data Table on Middle East and Africa - Year-over-year growth 2022-2027 (%)
- Exhibits83: Chart on US - Market size and forecast 2022-2027 ($ million)
- Exhibits84: Data Table on US - Market size and forecast 2022-2027 ($ million)
- Exhibits85: Chart on US - Year-over-year growth 2022-2027 (%)
- Exhibits86: Data Table on US - Year-over-year growth 2022-2027 (%)
- Exhibits87: Chart on China - Market size and forecast 2022-2027 ($ million)
- Exhibits88: Data Table on China - Market size and forecast 2022-2027 ($ million)
- Exhibits89: Chart on China - Year-over-year growth 2022-2027 (%)
- Exhibits90: Data Table on China - Year-over-year growth 2022-2027 (%)
- Exhibits91: Chart on Germany - Market size and forecast 2022-2027 ($ million)
- Exhibits92: Data Table on Germany - Market size and forecast 2022-2027 ($ million)
- Exhibits93: Chart on Germany - Year-over-year growth 2022-2027 (%)
- Exhibits94: Data Table on Germany - Year-over-year growth 2022-2027 (%)
- Exhibits95: Chart on UK - Market size and forecast 2022-2027 ($ million)
- Exhibits96: Data Table on UK - Market size and forecast 2022-2027 ($ million)
- Exhibits97: Chart on UK - Year-over-year growth 2022-2027 (%)
- Exhibits98: Data Table on UK - Year-over-year growth 2022-2027 (%)
- Exhibits99: Chart on Japan - Market size and forecast 2022-2027 ($ million)
- Exhibits100: Data Table on Japan - Market size and forecast 2022-2027 ($ million)
- Exhibits101: Chart on Japan - Year-over-year growth 2022-2027 (%)
- Exhibits102: Data Table on Japan - Year-over-year growth 2022-2027 (%)
- Exhibits103: Market opportunity by geography ($ million)
- Exhibits104: Data Tables on Market opportunity by geography ($ million)
- Exhibits105: Impact of drivers and challenges in 2022 and 2027
- Exhibits106: Overview on Criticality of inputs and Factors of differentiation
- Exhibits107: Overview on factors of disruption
- Exhibits108: Impact of key risks on business
- Exhibits109: Vendors covered
- Exhibits110: Matrix on vendor position and classification
- Exhibits111: Big Tree Farms Inc. - Overview
- Exhibits112: Big Tree Farms Inc. - Product / Service
- Exhibits113: Big Tree Farms Inc. - Key offerings
- Exhibits114: Madhava Ltd. - Overview
- Exhibits115: Madhava Ltd. - Product / Service
- Exhibits116: Madhava Ltd. - Key offerings
- Exhibits117: Mehrotra Consumer Products Pvt. Ltd. - Overview
- Exhibits118: Mehrotra Consumer Products Pvt. Ltd. - Product / Service
- Exhibits119: Mehrotra Consumer Products Pvt. Ltd. - Key offerings
- Exhibits120: Mitr Phol Group - Overview
- Exhibits121: Mitr Phol Group - Product / Service
- Exhibits122: Mitr Phol Group - Key offerings
- Exhibits123: Nimbark Organic - Overview
- Exhibits124: Nimbark Organic - Product / Service
- Exhibits125: Nimbark Organic - Key offerings
- Exhibits126: NOW Health Group Inc. - Overview
- Exhibits127: NOW Health Group Inc. - Product / Service
- Exhibits128: NOW Health Group Inc. - Key offerings
- Exhibits129: Pronatec AG - Overview
- Exhibits130: Pronatec AG - Product / Service
- Exhibits131: Pronatec AG - Key offerings
- Exhibits132: PT Mega Inovasi Organik - Overview
- Exhibits133: PT Mega Inovasi Organik - Product / Service
- Exhibits134: PT Mega Inovasi Organik - Key offerings
- Exhibits135: Raizen Energia SA - Overview
- Exhibits136: Raizen Energia SA - Product / Service
- Exhibits137: Raizen Energia SA - Key offerings
- Exhibits138: Sudzucker AG - Overview
- Exhibits139: Sudzucker AG - Business segments
- Exhibits140: Sudzucker AG - Key offerings
- Exhibits141: Sudzucker AG - Segment focus
- Exhibits142: Tereos Group - Overview
- Exhibits143: Tereos Group - Business segments
- Exhibits144: Tereos Group - Key offerings
- Exhibits145: Tereos Group - Segment focus
- Exhibits146: The Coconut Company UK Ltd. - Overview
- Exhibits147: The Coconut Company UK Ltd. - Product / Service
- Exhibits148: The Coconut Company UK Ltd. - Key offerings
- Exhibits149: The Groovy Food Co. - Overview
- Exhibits150: The Groovy Food Co. - Product / Service
- Exhibits151: The Groovy Food Co. - Key offerings
- Exhibits152: Tradin Organic Agriculture B.V. - Overview
- Exhibits153: Tradin Organic Agriculture B.V. - Product / Service
- Exhibits154: Tradin Organic Agriculture B.V. - Key offerings
- Exhibits155: Treelife - Overview
- Exhibits156: Treelife - Product / Service
- Exhibits157: Treelife - Key offerings
- Exhibits158: Inclusions checklist
- Exhibits159: Exclusions checklist
- Exhibits160: Currency conversion rates for US$
- Exhibits161: Research methodology
- Exhibits162: Validation techniques employed for market sizing
- Exhibits163: Information sources
- Exhibits164: List of abbreviations
Technavio has been monitoring the organic sugar market and is forecast to grow by USD 1,062.16 mn during 2022-2027, accelerating at a CAGR of 5.98% during the forecast period. Our report on the organic sugar market provides a holistic analysis, market size, and forecast, trends, growth drivers, and challenges, as well as vendor analysis covering around 25 vendors.
The report offers an up-to-date analysis regarding the current market scenario, the latest trends and drivers, and the overall market environment. The market is driven by growing health consciousness, an increase in disposable income, and a rise in food processing industries.
Technavio's organic sugar market is segmented as below:
By Type
- Crystals
- Molasses
By Distribution Channel
- Offline
- Online
By Geography
- North America
- Europe
- APAC
- South America
- Middle East and Africa
This study identifies the emergence of e-commerce platforms as one of the prime reasons driving the organic sugar market growth during the next few years. Also, increasing investments in organic farming and growing demand for natural sweeteners will lead to sizable demand in the market.
- Organic sugar market sizing
- Organic sugar market forecast
- Organic sugar market industry analysis
Technavio's robust vendor analysis is designed to help clients improve their market position, and in line with this, this report provides a detailed analysis of several leading organic sugar market vendors that include Big Tree Farms Inc., Celebes Coconut Corp., Dhampur Bio Organics Ltd., Finasucre SA, JALLES MACHADO SA, Madhava Ltd., Mehrotra Consumer Products Pvt. Ltd., Mitr Phol Group, Natureland Organic Foods Pvt. Ltd., Nimbark Organic, NOW Health Group Inc., Pronatec AG, PT Mega Inovasi Organik, Raizen Energia SA, Sudzucker AG, Tereos Group, The Coconut Company UK Ltd., The Groovy Food Co., Tradin Organic Agriculture B.V., and Treelife. Also, the organic sugar market analysis report includes information on upcoming trends and challenges that will influence market growth. This is to help companies strategize and leverage all forthcoming growth opportunities.
The study was conducted using an objective combination of primary and secondary information including inputs from key participants in the industry. The report contains a comprehensive market and vendor landscape in addition to an analysis of the key vendors.
Table of Contents
1 Executive Summary
- 1.1 Market overview
- Exhibit 01: Executive Summary - Chart on Market Overview
- Exhibit 02: Executive Summary - Data Table on Market Overview
- Exhibit 03: Executive Summary - Chart on Global Market Characteristics
- Exhibit 04: Executive Summary - Chart on Market by Geography
- Exhibit 05: Executive Summary - Chart on Market Segmentation by Type
- Exhibit 06: Executive Summary - Chart on Market Segmentation by Distribution Channel
- Exhibit 07: Executive Summary - Chart on Incremental Growth
- Exhibit 08: Executive Summary - Data Table on Incremental Growth
- Exhibit 09: Executive Summary - Chart on Vendor Market Positioning
2 Market Landscape
- 2.1 Market ecosystem
- Exhibit 10: Parent market
- Exhibit 11: Market Characteristics
3 Market Sizing
- 3.1 Market definition
- Exhibit 12: Offerings of vendors included in the market definition
- 3.2 Market segment analysis
- Exhibit 13: Market segments
- 3.3 Market size 2022
- 3.4 Market outlook: Forecast for 2022-2027
- Exhibit 14: Chart on Global - Market size and forecast 2022-2027 ($ million)
- Exhibit 15: Data Table on Global - Market size and forecast 2022-2027 ($ million)
- Exhibit 16: Chart on Global Market: Year-over-year growth 2022-2027 (%)
- Exhibit 17: Data Table on Global Market: Year-over-year growth 2022-2027 (%)
4 Historic Market Size
- 4.1 Global organic sugar market 2017 - 2021
- Exhibit 18: Historic Market Size - Data Table on global organic sugar market 2017 - 2021 ($ million)
- 4.2 Type Segment Analysis 2017 - 2021
- Exhibit 19: Historic Market Size - Type Segment 2017 - 2021 ($ million)
- 4.3 Distribution Channel Segment Analysis 2017 - 2021
- Exhibit 20: Historic Market Size - Distribution Channel Segment 2017 - 2021 ($ million)
- 4.4 Geography Segment Analysis 2017 - 2021
- Exhibit 21: Historic Market Size - Geography Segment 2017 - 2021 ($ million)
- 4.5 Country Segment Analysis 2017 - 2021
- Exhibit 22: Historic Market Size - Country Segment 2017 - 2021 ($ million)
5 Five Forces Analysis
- 5.1 Five forces summary
- Exhibit 23: Five forces analysis - Comparison between 2022 and 2027
- 5.2 Bargaining power of buyers
- Exhibit 24: Chart on Bargaining power of buyers - Impact of key factors 2022 and 2027
- 5.3 Bargaining power of suppliers
- Exhibit 25: Bargaining power of suppliers - Impact of key factors in 2022 and 2027
- 5.4 Threat of new entrants
- Exhibit 26: Threat of new entrants - Impact of key factors in 2022 and 2027
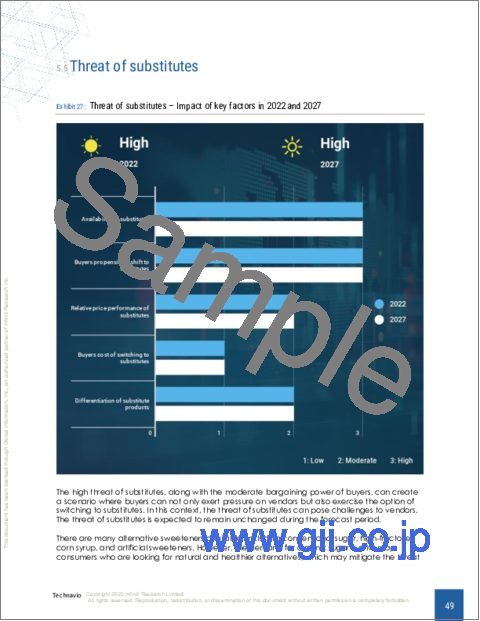
- 5.5 Threat of substitutes
- Exhibit 27: Threat of substitutes - Impact of key factors in 2022 and 2027
- 5.6 Threat of rivalry
- Exhibit 28: Threat of rivalry - Impact of key factors in 2022 and 2027
- 5.7 Market condition
- Exhibit 29: Chart on Market condition - Five forces 2022 and 2027
6 Market Segmentation by Type
- 6.1 Market segments
- Exhibit 30: Chart on Type - Market share 2022-2027 (%)
- Exhibit 31: Data Table on Type - Market share 2022-2027 (%)
- 6.2 Comparison by Type
- Exhibit 32: Chart on Comparison by Type
- Exhibit 33: Data Table on Comparison by Type
- 6.3 Crystals - Market size and forecast 2022-2027
- Exhibit 34: Chart on Crystals - Market size and forecast 2022-2027 ($ million)
- Exhibit 35: Data Table on Crystals - Market size and forecast 2022-2027 ($ million)
- Exhibit 36: Chart on Crystals - Year-over-year growth 2022-2027 (%)
- Exhibit 37: Data Table on Crystals - Year-over-year growth 2022-2027 (%)
- 6.4 Molasses - Market size and forecast 2022-2027
- Exhibit 38: Chart on Molasses - Market size and forecast 2022-2027 ($ million)
- Exhibit 39: Data Table on Molasses - Market size and forecast 2022-2027 ($ million)
- Exhibit 40: Chart on Molasses - Year-over-year growth 2022-2027 (%)
- Exhibit 41: Data Table on Molasses - Year-over-year growth 2022-2027 (%)
- 6.5 Market opportunity by Type
- Exhibit 42: Market opportunity by Type ($ million)
- Exhibit 43: Data Table on Market opportunity by Type ($ million)
7 Market Segmentation by Distribution Channel
- 7.1 Market segments
- Exhibit 44: Chart on Distribution Channel - Market share 2022-2027 (%)
- Exhibit 45: Data Table on Distribution Channel - Market share 2022-2027 (%)
- 7.2 Comparison by Distribution Channel
- Exhibit 46: Chart on Comparison by Distribution Channel
- Exhibit 47: Data Table on Comparison by Distribution Channel
- 7.3 Offline - Market size and forecast 2022-2027
- Exhibit 48: Chart on Offline - Market size and forecast 2022-2027 ($ million)
- Exhibit 49: Data Table on Offline - Market size and forecast 2022-2027 ($ million)
- Exhibit 50: Chart on Offline - Year-over-year growth 2022-2027 (%)
- Exhibit 51: Data Table on Offline - Year-over-year growth 2022-2027 (%)
- 7.4 Online - Market size and forecast 2022-2027
- Exhibit 52: Chart on Online - Market size and forecast 2022-2027 ($ million)
- Exhibit 53: Data Table on Online - Market size and forecast 2022-2027 ($ million)
- Exhibit 54: Chart on Online - Year-over-year growth 2022-2027 (%)
- Exhibit 55: Data Table on Online - Year-over-year growth 2022-2027 (%)
- 7.5 Market opportunity by Distribution Channel
- Exhibit 56: Market opportunity by Distribution Channel ($ million)
- Exhibit 57: Data Table on Market opportunity by Distribution Channel ($ million)
8 Customer Landscape
- 8.1 Customer landscape overview
- Exhibit 58: Analysis of price sensitivity, lifecycle, customer purchase basket, adoption rates, and purchase criteria
9 Geographic Landscape
- 9.1 Geographic segmentation
- Exhibit 59: Chart on Market share by geography 2022-2027 (%)
- Exhibit 60: Data Table on Market share by geography 2022-2027 (%)
- 9.2 Geographic comparison
- Exhibit 61: Chart on Geographic comparison
- Exhibit 62: Data Table on Geographic comparison
- 9.3 North America - Market size and forecast 2022-2027
- Exhibit 63: Chart on North America - Market size and forecast 2022-2027 ($ million)
- Exhibit 64: Data Table on North America - Market size and forecast 2022-2027 ($ million)
- Exhibit 65: Chart on North America - Year-over-year growth 2022-2027 (%)
- Exhibit 66: Data Table on North America - Year-over-year growth 2022-2027 (%)
- 9.4 Europe - Market size and forecast 2022-2027
- Exhibit 67: Chart on Europe - Market size and forecast 2022-2027 ($ million)
- Exhibit 68: Data Table on Europe - Market size and forecast 2022-2027 ($ million)
- Exhibit 69: Chart on Europe - Year-over-year growth 2022-2027 (%)
- Exhibit 70: Data Table on Europe - Year-over-year growth 2022-2027 (%)
- 9.5 APAC - Market size and forecast 2022-2027
- Exhibit 71: Chart on APAC - Market size and forecast 2022-2027 ($ million)
- Exhibit 72: Data Table on APAC - Market size and forecast 2022-2027 ($ million)
- Exhibit 73: Chart on APAC - Year-over-year growth 2022-2027 (%)
- Exhibit 74: Data Table on APAC - Year-over-year growth 2022-2027 (%)
- 9.6 South America - Market size and forecast 2022-2027
- Exhibit 75: Chart on South America - Market size and forecast 2022-2027 ($ million)
- Exhibit 76: Data Table on South America - Market size and forecast 2022-2027 ($ million)
- Exhibit 77: Chart on South America - Year-over-year growth 2022-2027 (%)
- Exhibit 78: Data Table on South America - Year-over-year growth 2022-2027 (%)
- 9.7 Middle East and Africa - Market size and forecast 2022-2027
- Exhibit 79: Chart on Middle East and Africa - Market size and forecast 2022-2027 ($ million)
- Exhibit 80: Data Table on Middle East and Africa - Market size and forecast 2022-2027 ($ million)
- Exhibit 81: Chart on Middle East and Africa - Year-over-year growth 2022-2027 (%)
- Exhibit 82: Data Table on Middle East and Africa - Year-over-year growth 2022-2027 (%)
- 9.8 US - Market size and forecast 2022-2027
- Exhibit 83: Chart on US - Market size and forecast 2022-2027 ($ million)
- Exhibit 84: Data Table on US - Market size and forecast 2022-2027 ($ million)
- Exhibit 85: Chart on US - Year-over-year growth 2022-2027 (%)
- Exhibit 86: Data Table on US - Year-over-year growth 2022-2027 (%)
- 9.9 China - Market size and forecast 2022-2027
- Exhibit 87: Chart on China - Market size and forecast 2022-2027 ($ million)
- Exhibit 88: Data Table on China - Market size and forecast 2022-2027 ($ million)
- Exhibit 89: Chart on China - Year-over-year growth 2022-2027 (%)
- Exhibit 90: Data Table on China - Year-over-year growth 2022-2027 (%)
- 9.10 Germany - Market size and forecast 2022-2027
- Exhibit 91: Chart on Germany - Market size and forecast 2022-2027 ($ million)
- Exhibit 92: Data Table on Germany - Market size and forecast 2022-2027 ($ million)
- Exhibit 93: Chart on Germany - Year-over-year growth 2022-2027 (%)
- Exhibit 94: Data Table on Germany - Year-over-year growth 2022-2027 (%)
- 9.11 UK - Market size and forecast 2022-2027
- Exhibit 95: Chart on UK - Market size and forecast 2022-2027 ($ million)
- Exhibit 96: Data Table on UK - Market size and forecast 2022-2027 ($ million)
- Exhibit 97: Chart on UK - Year-over-year growth 2022-2027 (%)
- Exhibit 98: Data Table on UK - Year-over-year growth 2022-2027 (%)
- 9.12 Japan - Market size and forecast 2022-2027
- Exhibit 99: Chart on Japan - Market size and forecast 2022-2027 ($ million)
- Exhibit 100: Data Table on Japan - Market size and forecast 2022-2027 ($ million)
- Exhibit 101: Chart on Japan - Year-over-year growth 2022-2027 (%)
- Exhibit 102: Data Table on Japan - Year-over-year growth 2022-2027 (%)
- 9.13 Market opportunity by geography
- Exhibit 103: Market opportunity by geography ($ million)
- Exhibit 104: Data Tables on Market opportunity by geography ($ million)
10 Drivers, Challenges, and Trends
- 10.1 Market drivers
- 10.2 Market challenges
- 10.3 Impact of drivers and challenges
- Exhibit 105: Impact of drivers and challenges in 2022 and 2027
- 10.4 Market trends
11 Vendor Landscape
- 11.1 Overview
- 11.2 Vendor landscape
- Exhibit 106: Overview on Criticality of inputs and Factors of differentiation
- 11.3 Landscape disruption
- Exhibit 107: Overview on factors of disruption
- 11.4 Industry risks
- Exhibit 108: Impact of key risks on business
12 Vendor Analysis
- 12.1 Vendors covered
- Exhibit 109: Vendors covered
- 12.2 Market positioning of vendors
- Exhibit 110: Matrix on vendor position and classification
- 12.3 Big Tree Farms Inc.
- Exhibit 111: Big Tree Farms Inc. - Overview
- Exhibit 112: Big Tree Farms Inc. - Product / Service
- Exhibit 113: Big Tree Farms Inc. - Key offerings
- 12.4 Madhava Ltd.
- Exhibit 114: Madhava Ltd. - Overview
- Exhibit 115: Madhava Ltd. - Product / Service
- Exhibit 116: Madhava Ltd. - Key offerings
- 12.5 Mehrotra Consumer Products Pvt. Ltd.
- Exhibit 117: Mehrotra Consumer Products Pvt. Ltd. - Overview
- Exhibit 118: Mehrotra Consumer Products Pvt. Ltd. - Product / Service
- Exhibit 119: Mehrotra Consumer Products Pvt. Ltd. - Key offerings
- 12.6 Mitr Phol Group
- Exhibit 120: Mitr Phol Group - Overview
- Exhibit 121: Mitr Phol Group - Product / Service
- Exhibit 122: Mitr Phol Group - Key offerings
- 12.7 Nimbark Organic
- Exhibit 123: Nimbark Organic - Overview
- Exhibit 124: Nimbark Organic - Product / Service
- Exhibit 125: Nimbark Organic - Key offerings
- 12.8 NOW Health Group Inc.
- Exhibit 126: NOW Health Group Inc. - Overview
- Exhibit 127: NOW Health Group Inc. - Product / Service
- Exhibit 128: NOW Health Group Inc. - Key offerings
- 12.9 Pronatec AG
- Exhibit 129: Pronatec AG - Overview
- Exhibit 130: Pronatec AG - Product / Service
- Exhibit 131: Pronatec AG - Key offerings
- 12.10 PT Mega Inovasi Organik
- Exhibit 132: PT Mega Inovasi Organik - Overview
- Exhibit 133: PT Mega Inovasi Organik - Product / Service
- Exhibit 134: PT Mega Inovasi Organik - Key offerings
- 12.11 Raizen Energia SA
- Exhibit 135: Raizen Energia SA - Overview
- Exhibit 136: Raizen Energia SA - Product / Service
- Exhibit 137: Raizen Energia SA - Key offerings
- 12.12 Sudzucker AG
- Exhibit 138: Sudzucker AG - Overview
- Exhibit 139: Sudzucker AG - Business segments
- Exhibit 140: Sudzucker AG - Key offerings
- Exhibit 141: Sudzucker AG - Segment focus
- 12.13 Tereos Group
- Exhibit 142: Tereos Group - Overview
- Exhibit 143: Tereos Group - Business segments
- Exhibit 144: Tereos Group - Key offerings
- Exhibit 145: Tereos Group - Segment focus
- 12.14 The Coconut Company UK Ltd.
- Exhibit 146: The Coconut Company UK Ltd. - Overview
- Exhibit 147: The Coconut Company UK Ltd. - Product / Service
- Exhibit 148: The Coconut Company UK Ltd. - Key offerings
- 12.15 The Groovy Food Co.
- Exhibit 149: The Groovy Food Co. - Overview
- Exhibit 150: The Groovy Food Co. - Product / Service
- Exhibit 151: The Groovy Food Co. - Key offerings
- 12.16 Tradin Organic Agriculture B.V.
- Exhibit 152: Tradin Organic Agriculture B.V. - Overview
- Exhibit 153: Tradin Organic Agriculture B.V. - Product / Service
- Exhibit 154: Tradin Organic Agriculture B.V. - Key offerings
- 12.17 Treelife
- Exhibit 155: Treelife - Overview
- Exhibit 156: Treelife - Product / Service
- Exhibit 157: Treelife - Key offerings
13 Appendix
- 13.1 Scope of the report
- 13.2 Inclusions and exclusions checklist
- Exhibit 158: Inclusions checklist
- Exhibit 159: Exclusions checklist
- 13.3 Currency conversion rates for US$
- Exhibit 160: Currency conversion rates for US$
- 13.4 Research methodology
- Exhibit 161: Research methodology
- Exhibit 162: Validation techniques employed for market sizing
- Exhibit 163: Information sources
- 13.5 List of abbreviations
- Exhibit 164: List of abbreviations