|
|
市場調査レポート
商品コード
1502450
アトピー性皮膚炎治療薬の世界市場 2024-2028Global atopic dermatitis drugs market 2024-2028 |
||||||
|
|||||||
カスタマイズ可能
|
|||||||


| アトピー性皮膚炎治療薬の世界市場 2024-2028 |
|
出版日: 2024年05月22日
発行: TechNavio
ページ情報: 英文 175 Pages
納期: 即納可能
|

全表示
- 概要
- 図表
- 目次
Technavio社は、アトピー性皮膚炎治療薬市場を調査し、2023年から2028年にかけて62億480万米ドル、予測期間中のCAGRは10.87%で成長すると予測しています。
当レポートでは、アトピー性皮膚炎治療薬市場の全体的な分析、市場規模・予測、動向、成長促進要因、課題、約25のベンダーを網羅したベンダー分析などを掲載しています。
現在の市場シナリオ、最新動向と促進要因、市場環境全体に関する最新分析を提供しています。アトピー性皮膚炎の有病率の高さ、ヘルスケア支出の増加、強力な研究開発パイプラインが市場を牽引しています。
| 市場範囲 | |
|---|---|
| 基準年 | 2024 |
| 終了年 | 2028 |
| 予測期間 | 2024-2028 |
| 成長モメンタム | 加速 |
| 前年比2024年 | 9.53% |
| CAGR | 10.87% |
| 増分額 | 62億480万米ドル |
本調査では、今後数年間のアトピー性皮膚炎治療薬市場成長を牽引する主要因の一つとして、戦略的パートナーシップと買収を挙げています。また、地政学的な不確実性やアトピー性皮膚炎の認知を促進するプログラムは、市場の大きな需要につながります。
目次
第1章 エグゼクティブサマリー
- 市場概要
第2章 市場情勢
- 市場エコシステム
- 市場の特徴
- バリューチェーン分析
第3章 市場規模の評価
- 市場の定義
- 市場セグメント分析
- 市場規模 2023
- 市場の見通し 2023-2028
第4章 市場規模実績
- 世界のアトピー性皮膚炎治療薬市場 2018-2022
- 投与経路別セグメント分析 2018-2022
- 薬剤クラス別セグメント分析 2018-2022
- 地域別セグメント分析 2018-2022
- 国別セグメント分析 2018-2022
第5章 ファイブフォース分析
- ファイブフォースの要約
- 買い手の交渉力
- 供給企業の交渉力
- 新規参入業者の脅威
- 代替品の脅威
- 競争の脅威
- 市況
第6章 市場セグメンテーション:投与経路別
- 市場セグメンテーション
- 比較:投与経路別
- 経口:市場規模と予測 2023-2028
- 外用:市場規模と予測 2023-2028
- 注射:市場規模と予測 2023-2028
- 市場機会:投与経路別
第7章 市場セグメンテーション:薬剤クラス別
- 市場セグメンテーション
- 比較:薬剤クラス別
- 生物学的製剤:市場規模と予測 2023-2028
- PDE4阻害剤:市場規模と予測 2023-2028
- コルチコステロイド:市場規模と予測 2023-2028
- カルシニューリン阻害剤:市場規模と予測 2023-2028
- 市場機会:薬剤クラス別
第8章 顧客情勢
- 顧客情勢の概要
第9章 地域別情勢
- 地域別セグメンテーション
- 地域別比較
- 北米:市場規模と予測 2023-2028
- 欧州:市場規模と予測 2023-2028
- アジア:市場規模と予測 2023-2028
- 世界のその他の地域:市場規模と予測 2023-2028
- 米国:市場規模と予測 2023-2028
- カナダ:市場規模と予測 2023-2028
- ドイツ:市場規模と予測 2023-2028
- 英国:市場規模と予測 2023-2028
- 中国:市場規模と予測 2023-2028
- 市場機会:地域別
第10章 促進要因・課題・機会・抑制要因
- 市場促進要因
- 市場の課題
- 促進要因と課題の影響
- 市場の機会・抑制要因
第11章 競合情勢
- 概要
- 競合情勢
- 混乱の状況
- 業界のリスク
第12章 競合分析
- 企業プロファイル
- 企業の市場ポジショニング
- AbbVie Inc.
- Arcutis Biotherapeutics Inc.
- Bausch Health Companies Inc.
- Bristol Myers Squibb Co.
- Eli Lilly and Co.
- Evelo Biosciences Inc.
- Galderma SA
- Incyte Corp.
- LEO Pharma AS
- Maruho Co. Ltd.
- Novartis AG
- Otsuka Holdings Co. Ltd.
- Pfizer Inc.
- Sanofi SA
- Viatris Inc.
第13章 付録
Exhibits:
- Exhibits1: Executive Summary - Chart on Market Overview
- Exhibits2: Executive Summary - Data Table on Market Overview
- Exhibits3: Executive Summary - Chart on Global Market Characteristics
- Exhibits4: Executive Summary - Chart on Market by Geography
- Exhibits5: Executive Summary - Chart on Market Segmentation by Route of Administration
- Exhibits6: Executive Summary - Chart on Market Segmentation by Drug Class
- Exhibits7: Executive Summary - Chart on Incremental Growth
- Exhibits8: Executive Summary - Data Table on Incremental Growth
- Exhibits9: Executive Summary - Chart on Company Market Positioning
- Exhibits10: Parent Market
- Exhibits11: Data Table on - Parent Market
- Exhibits12: Market characteristics analysis
- Exhibits13: Value Chain Analysis
- Exhibits14: Offerings of companies included in the market definition
- Exhibits15: Market segments
- Exhibits16: Chart on Global - Market size and forecast 2023-2028 ($ million)
- Exhibits17: Data Table on Global - Market size and forecast 2023-2028 ($ million)
- Exhibits18: Chart on Global Market: Year-over-year growth 2023-2028 (%)
- Exhibits19: Data Table on Global Market: Year-over-year growth 2023-2028 (%)
- Exhibits20: Historic Market Size - Data Table on Global Atopic Dermatitis Drugs Market 2018 - 2022 ($ million)
- Exhibits21: Historic Market Size - Route of Administration Segment 2018 - 2022 ($ million)
- Exhibits22: Historic Market Size - Drug Class Segment 2018 - 2022 ($ million)
- Exhibits23: Historic Market Size - Geography Segment 2018 - 2022 ($ million)
- Exhibits24: Historic Market Size - Country Segment 2018 - 2022 ($ million)
- Exhibits25: Five forces analysis - Comparison between 2023 and 2028
- Exhibits26: Bargaining power of buyers - Impact of key factors 2023 and 2028
- Exhibits27: Bargaining power of suppliers - Impact of key factors in 2023 and 2028
- Exhibits28: Threat of new entrants - Impact of key factors in 2023 and 2028
- Exhibits29: Threat of substitutes - Impact of key factors in 2023 and 2028
- Exhibits30: Threat of rivalry - Impact of key factors in 2023 and 2028
- Exhibits31: Chart on Market condition - Five forces 2023 and 2028
- Exhibits32: Chart on Route of Administration - Market share 2023-2028 (%)
- Exhibits33: Data Table on Route of Administration - Market share 2023-2028 (%)
- Exhibits34: Chart on Comparison by Route of Administration
- Exhibits35: Data Table on Comparison by Route of Administration
- Exhibits36: Chart on Oral - Market size and forecast 2023-2028 ($ million)
- Exhibits37: Data Table on Oral - Market size and forecast 2023-2028 ($ million)
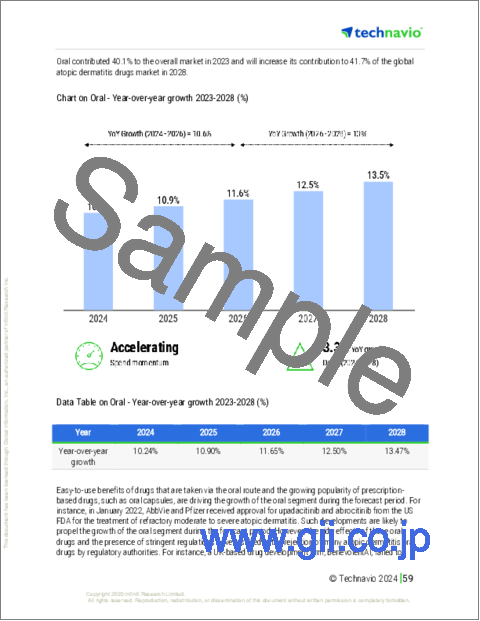
- Exhibits38: Chart on Oral - Year-over-year growth 2023-2028 (%)
- Exhibits39: Data Table on Oral - Year-over-year growth 2023-2028 (%)
- Exhibits40: Chart on Topical - Market size and forecast 2023-2028 ($ million)
- Exhibits41: Data Table on Topical - Market size and forecast 2023-2028 ($ million)
- Exhibits42: Chart on Topical - Year-over-year growth 2023-2028 (%)
- Exhibits43: Data Table on Topical - Year-over-year growth 2023-2028 (%)
- Exhibits44: Chart on Injectable - Market size and forecast 2023-2028 ($ million)
- Exhibits45: Data Table on Injectable - Market size and forecast 2023-2028 ($ million)
- Exhibits46: Chart on Injectable - Year-over-year growth 2023-2028 (%)
- Exhibits47: Data Table on Injectable - Year-over-year growth 2023-2028 (%)
- Exhibits48: Market opportunity by Route of Administration ($ million)
- Exhibits49: Data Table on Market opportunity by Route of Administration ($ million)
- Exhibits50: Chart on Drug Class - Market share 2023-2028 (%)
- Exhibits51: Data Table on Drug Class - Market share 2023-2028 (%)
- Exhibits52: Chart on Comparison by Drug Class
- Exhibits53: Data Table on Comparison by Drug Class
- Exhibits54: Chart on Biologics - Market size and forecast 2023-2028 ($ million)
- Exhibits55: Data Table on Biologics - Market size and forecast 2023-2028 ($ million)
- Exhibits56: Chart on Biologics - Year-over-year growth 2023-2028 (%)
- Exhibits57: Data Table on Biologics - Year-over-year growth 2023-2028 (%)
- Exhibits58: Chart on PDE4 inhibitors - Market size and forecast 2023-2028 ($ million)
- Exhibits59: Data Table on PDE4 inhibitors - Market size and forecast 2023-2028 ($ million)
- Exhibits60: Chart on PDE4 inhibitors - Year-over-year growth 2023-2028 (%)
- Exhibits61: Data Table on PDE4 inhibitors - Year-over-year growth 2023-2028 (%)
- Exhibits62: Chart on Corticosteroids - Market size and forecast 2023-2028 ($ million)
- Exhibits63: Data Table on Corticosteroids - Market size and forecast 2023-2028 ($ million)
- Exhibits64: Chart on Corticosteroids - Year-over-year growth 2023-2028 (%)
- Exhibits65: Data Table on Corticosteroids - Year-over-year growth 2023-2028 (%)
- Exhibits66: Chart on Calcineurin inhibitors - Market size and forecast 2023-2028 ($ million)
- Exhibits67: Data Table on Calcineurin inhibitors - Market size and forecast 2023-2028 ($ million)
- Exhibits68: Chart on Calcineurin inhibitors - Year-over-year growth 2023-2028 (%)
- Exhibits69: Data Table on Calcineurin inhibitors - Year-over-year growth 2023-2028 (%)
- Exhibits70: Market opportunity by Drug Class ($ million)
- Exhibits71: Data Table on Market opportunity by Drug Class ($ million)
- Exhibits72: Analysis of price sensitivity, lifecycle, customer purchase basket, adoption rates, and purchase criteria
- Exhibits73: Chart on Market share By Geographical Landscape2023-2028 (%)
- Exhibits74: Data Table on Market share By Geographical Landscape2023-2028 (%)
- Exhibits75: Chart on Geographic comparison
- Exhibits76: Data Table on Geographic comparison
- Exhibits77: Chart on North America - Market size and forecast 2023-2028 ($ million)
- Exhibits78: Data Table on North America - Market size and forecast 2023-2028 ($ million)
- Exhibits79: Chart on North America - Year-over-year growth 2023-2028 (%)
- Exhibits80: Data Table on North America - Year-over-year growth 2023-2028 (%)
- Exhibits81: Chart on Europe - Market size and forecast 2023-2028 ($ million)
- Exhibits82: Data Table on Europe - Market size and forecast 2023-2028 ($ million)
- Exhibits83: Chart on Europe - Year-over-year growth 2023-2028 (%)
- Exhibits84: Data Table on Europe - Year-over-year growth 2023-2028 (%)
- Exhibits85: Chart on Asia - Market size and forecast 2023-2028 ($ million)
- Exhibits86: Data Table on Asia - Market size and forecast 2023-2028 ($ million)
- Exhibits87: Chart on Asia - Year-over-year growth 2023-2028 (%)
- Exhibits88: Data Table on Asia - Year-over-year growth 2023-2028 (%)
- Exhibits89: Chart on Rest of World (ROW) - Market size and forecast 2023-2028 ($ million)
- Exhibits90: Data Table on Rest of World (ROW) - Market size and forecast 2023-2028 ($ million)
- Exhibits91: Chart on Rest of World (ROW) - Year-over-year growth 2023-2028 (%)
- Exhibits92: Data Table on Rest of World (ROW) - Year-over-year growth 2023-2028 (%)
- Exhibits93: Chart on US - Market size and forecast 2023-2028 ($ million)
- Exhibits94: Data Table on US - Market size and forecast 2023-2028 ($ million)
- Exhibits95: Chart on US - Year-over-year growth 2023-2028 (%)
- Exhibits96: Data Table on US - Year-over-year growth 2023-2028 (%)
- Exhibits97: Chart on Canada - Market size and forecast 2023-2028 ($ million)
- Exhibits98: Data Table on Canada - Market size and forecast 2023-2028 ($ million)
- Exhibits99: Chart on Canada - Year-over-year growth 2023-2028 (%)
- Exhibits100: Data Table on Canada - Year-over-year growth 2023-2028 (%)
- Exhibits101: Chart on Germany - Market size and forecast 2023-2028 ($ million)
- Exhibits102: Data Table on Germany - Market size and forecast 2023-2028 ($ million)
- Exhibits103: Chart on Germany - Year-over-year growth 2023-2028 (%)
- Exhibits104: Data Table on Germany - Year-over-year growth 2023-2028 (%)
- Exhibits105: Chart on UK - Market size and forecast 2023-2028 ($ million)
- Exhibits106: Data Table on UK - Market size and forecast 2023-2028 ($ million)
- Exhibits107: Chart on UK - Year-over-year growth 2023-2028 (%)
- Exhibits108: Data Table on UK - Year-over-year growth 2023-2028 (%)
- Exhibits109: Chart on China - Market size and forecast 2023-2028 ($ million)
- Exhibits110: Data Table on China - Market size and forecast 2023-2028 ($ million)
- Exhibits111: Chart on China - Year-over-year growth 2023-2028 (%)
- Exhibits112: Data Table on China - Year-over-year growth 2023-2028 (%)
- Exhibits113: Market opportunity By Geographical Landscape($ million)
- Exhibits114: Data Tables on Market opportunity By Geographical Landscape($ million)
- Exhibits115: Impact of drivers and challenges in 2023 and 2028
- Exhibits116: Overview on criticality of inputs and factors of differentiation
- Exhibits117: Overview on factors of disruption
- Exhibits118: Impact of key risks on business
- Exhibits119: Companies covered
- Exhibits120: Matrix on companies position and classification
- Exhibits121: AbbVie Inc. - Overview
- Exhibits122: AbbVie Inc. - Product / Service
- Exhibits123: AbbVie Inc. - Key news
- Exhibits124: AbbVie Inc. - Key offerings
- Exhibits125: Arcutis Biotherapeutics Inc. - Overview
- Exhibits126: Arcutis Biotherapeutics Inc. - Product / Service
- Exhibits127: Arcutis Biotherapeutics Inc. - Key news
- Exhibits128: Arcutis Biotherapeutics Inc. - Key offerings
- Exhibits129: Bausch Health Companies Inc. - Overview
- Exhibits130: Bausch Health Companies Inc. - Business segments
- Exhibits131: Bausch Health Companies Inc. - Key news
- Exhibits132: Bausch Health Companies Inc. - Key offerings
- Exhibits133: Bausch Health Companies Inc. - Segment focus
- Exhibits134: Bristol Myers Squibb Co. - Overview
- Exhibits135: Bristol Myers Squibb Co. - Product / Service
- Exhibits136: Bristol Myers Squibb Co. - Key news
- Exhibits137: Bristol Myers Squibb Co. - Key offerings
- Exhibits138: Eli Lilly and Co. - Overview
- Exhibits139: Eli Lilly and Co. - Product / Service
- Exhibits140: Eli Lilly and Co. - Key news
- Exhibits141: Eli Lilly and Co. - Key offerings
- Exhibits142: Evelo Biosciences Inc. - Overview
- Exhibits143: Evelo Biosciences Inc. - Product / Service
- Exhibits144: Evelo Biosciences Inc. - Key offerings
- Exhibits145: Galderma SA - Overview
- Exhibits146: Galderma SA - Product / Service
- Exhibits147: Galderma SA - Key offerings
- Exhibits148: Incyte Corp. - Overview
- Exhibits149: Incyte Corp. - Product / Service
- Exhibits150: Incyte Corp. - Key offerings
- Exhibits151: LEO Pharma AS - Overview
- Exhibits152: LEO Pharma AS - Business segments
- Exhibits153: LEO Pharma AS - Key offerings
- Exhibits154: LEO Pharma AS - Segment focus
- Exhibits155: Maruho Co. Ltd. - Overview
- Exhibits156: Maruho Co. Ltd. - Product / Service
- Exhibits157: Maruho Co. Ltd. - Key news
- Exhibits158: Maruho Co. Ltd. - Key offerings
- Exhibits159: Novartis AG - Overview
- Exhibits160: Novartis AG - Business segments
- Exhibits161: Novartis AG - Key news
- Exhibits162: Novartis AG - Key offerings
- Exhibits163: Novartis AG - Segment focus
- Exhibits164: Otsuka Holdings Co. Ltd. - Overview
- Exhibits165: Otsuka Holdings Co. Ltd. - Business segments
- Exhibits166: Otsuka Holdings Co. Ltd. - Key offerings
- Exhibits167: Otsuka Holdings Co. Ltd. - Segment focus
- Exhibits168: Pfizer Inc. - Overview
- Exhibits169: Pfizer Inc. - Product / Service
- Exhibits170: Pfizer Inc. - Key news
- Exhibits171: Pfizer Inc. - Key offerings
- Exhibits172: Sanofi SA - Overview
- Exhibits173: Sanofi SA - Business segments
- Exhibits174: Sanofi SA - Key news
- Exhibits175: Sanofi SA - Key offerings
- Exhibits176: Sanofi SA - Segment focus
- Exhibits177: Viatris Inc. - Overview
- Exhibits178: Viatris Inc. - Business segments
- Exhibits179: Viatris Inc. - Key news
- Exhibits180: Viatris Inc. - Key offerings
- Exhibits181: Viatris Inc. - Segment focus
- Exhibits182: Inclusions checklist
- Exhibits183: Exclusions checklist
- Exhibits184: Currency conversion rates for US$
- Exhibits185: Research methodology
- Exhibits186: Information sources
- Exhibits187: Data validation
- Exhibits188: Validation techniques employed for market sizing
- Exhibits189: Data synthesis
- Exhibits190: 360 degree market analysis
- Exhibits191: List of abbreviations
Technavio has been monitoring the atopic dermatitis drugs market and is forecast to grow by USD 6204.8 mn during 2023-2028, accelerating at a CAGR of 10.87% during the forecast period. Our report on the atopic dermatitis drugs market provides a holistic analysis, market size and forecast, trends, growth drivers, and challenges, as well as vendor analysis covering around 25 vendors.
The report offers an up-to-date analysis regarding the current market scenario, the latest trends and drivers, and the overall market environment. The market is driven by high prevalence of atopic dermatitis, increasing healthcare expenditure, and strong R and D pipeline.
Technavio's atopic dermatitis drugs market is segmented as below:
| Market Scope | |
|---|---|
| Base Year | 2024 |
| End Year | 2028 |
| Series Year | 2024-2028 |
| Growth Momentum | Accelerate |
| YOY 2024 | 9.53% |
| CAGR | 10.87% |
| Incremental Value | $6204.8mn |
By Route Of Administration
- Oral
- Topical
- Injectable
By Drug Class
- Biologics
- PDE4 inhibitors
- Corticosteroids
- Calcineurin inhibitors
By Geography
- North America
- Europe
- Asia
- Rest of World (ROW)
This study identifies the strategic partnerships and acquisitions as one of the prime reasons driving the atopic dermatitis drugs market growth during the next few years. Also, geopolitical uncertainties and programs to promote awareness of atopic dermatitis will lead to sizable demand in the market.
Technavio presents a detailed picture of the market by the way of study, synthesis, and summation of data from multiple sources by an analysis of key parameters. Our report on the atopic dermatitis drugs market covers the following areas:
- Atopic dermatitis drugs market sizing
- Atopic dermatitis drugs market forecast
- Atopic dermatitis drugs market industry analysis
Technavio's robust vendor analysis is designed to help clients improve their market position, and in line with this, this report provides a detailed analysis of several leading atopic dermatitis drugs market vendors that include AbbVie Inc., Arcutis Biotherapeutics Inc., Asana BioSciences LLC, Astellas Pharma Inc., Bausch Health Companies Inc., Bayer AG, BiomX Inc., Bristol Myers Squibb Co., Dermavant Sciences Inc., Eli Lilly and Co., Evelo Biosciences Inc., Galderma SA, Incyte Corp., LEO Pharma AS, Maruho Co. Ltd., Novartis AG, Otsuka Holdings Co. Ltd., Pfizer Inc., Sanofi SA, and Viatris Inc.. Also, the atopic dermatitis drugs market analysis report includes information on upcoming trends and challenges that will influence market growth. This is to help companies strategize and leverage all forthcoming growth opportunities.
The study was conducted using an objective combination of primary and secondary information including inputs from key participants in the industry. The report contains a comprehensive market and vendor landscape in addition to an analysis of the key vendors.
Technavio presents a detailed picture of the market by the way of study, synthesis, and summation of data from multiple sources by an analysis of key parameters such as profit, pricing, competition, and promotions. It presents various market facets by identifying the key industry influencers. The data presented is comprehensive, reliable, and a result of extensive research - both primary and secondary. Technavio's market research reports provide a complete competitive landscape and an in-depth vendor selection methodology and analysis using qualitative and quantitative research to forecast accurate market growth.
Table of Contents
1 Executive Summary
- 1.1 Market overview
- Executive Summary - Chart on Market Overview
- Executive Summary - Data Table on Market Overview
- Executive Summary - Chart on Global Market Characteristics
- Executive Summary - Chart on Market by Geography
- Executive Summary - Chart on Market Segmentation by Route of Administration
- Executive Summary - Chart on Market Segmentation by Drug Class
- Executive Summary - Chart on Incremental Growth
- Executive Summary - Data Table on Incremental Growth
- Executive Summary - Chart on Company Market Positioning
2 Market Landscape
- 2.1 Market ecosystem
- Parent Market
- Data Table on - Parent Market
- 2.2 Market characteristics
- Market characteristics analysis
- 2.3 Value chain analysis
- Value Chain Analysis
3 Market Sizing
- 3.1 Market definition
- Offerings of companies included in the market definition
- 3.2 Market segment analysis
- Market segments
- 3.3 Market size 2023
- 3.4 Market outlook: Forecast for 2023-2028
- Chart on Global - Market size and forecast 2023-2028 ($ million)
- Data Table on Global - Market size and forecast 2023-2028 ($ million)
- Chart on Global Market: Year-over-year growth 2023-2028 (%)
- Data Table on Global Market: Year-over-year growth 2023-2028 (%)
4 Historic Market Size
- 4.1 Global Atopic Dermatitis Drugs Market 2018 - 2022
- Historic Market Size - Data Table on Global Atopic Dermatitis Drugs Market 2018 - 2022 ($ million)
- 4.2 Route of Administration segment analysis 2018 - 2022
- Historic Market Size - Route of Administration Segment 2018 - 2022 ($ million)
- 4.3 Drug Class segment analysis 2018 - 2022
- Historic Market Size - Drug Class Segment 2018 - 2022 ($ million)
- 4.4 Geography segment analysis 2018 - 2022
- Historic Market Size - Geography Segment 2018 - 2022 ($ million)
- 4.5 Country segment analysis 2018 - 2022
- Historic Market Size - Country Segment 2018 - 2022 ($ million)
5 Five Forces Analysis
- 5.1 Five forces summary
- Five forces analysis - Comparison between 2023 and 2028
- 5.2 Bargaining power of buyers
- Bargaining power of buyers - Impact of key factors 2023 and 2028
- 5.3 Bargaining power of suppliers
- Bargaining power of suppliers - Impact of key factors in 2023 and 2028
- 5.4 Threat of new entrants
- Threat of new entrants - Impact of key factors in 2023 and 2028
- 5.5 Threat of substitutes
- Threat of substitutes - Impact of key factors in 2023 and 2028
- 5.6 Threat of rivalry
- Threat of rivalry - Impact of key factors in 2023 and 2028
- 5.7 Market condition
- Chart on Market condition - Five forces 2023 and 2028
6 Market Segmentation by Route of Administration
- 6.1 Market segments
- Chart on Route of Administration - Market share 2023-2028 (%)
- Data Table on Route of Administration - Market share 2023-2028 (%)
- 6.2 Comparison by Route of Administration
- Chart on Comparison by Route of Administration
- Data Table on Comparison by Route of Administration
- 6.3 Oral - Market size and forecast 2023-2028
- Chart on Oral - Market size and forecast 2023-2028 ($ million)
- Data Table on Oral - Market size and forecast 2023-2028 ($ million)
- Chart on Oral - Year-over-year growth 2023-2028 (%)
- Data Table on Oral - Year-over-year growth 2023-2028 (%)
- 6.4 Topical - Market size and forecast 2023-2028
- Chart on Topical - Market size and forecast 2023-2028 ($ million)
- Data Table on Topical - Market size and forecast 2023-2028 ($ million)
- Chart on Topical - Year-over-year growth 2023-2028 (%)
- Data Table on Topical - Year-over-year growth 2023-2028 (%)
- 6.5 Injectable - Market size and forecast 2023-2028
- Chart on Injectable - Market size and forecast 2023-2028 ($ million)
- Data Table on Injectable - Market size and forecast 2023-2028 ($ million)
- Chart on Injectable - Year-over-year growth 2023-2028 (%)
- Data Table on Injectable - Year-over-year growth 2023-2028 (%)
- 6.6 Market opportunity by Route of Administration
- Market opportunity by Route of Administration ($ million)
- Data Table on Market opportunity by Route of Administration ($ million)
7 Market Segmentation by Drug Class
- 7.1 Market segments
- Chart on Drug Class - Market share 2023-2028 (%)
- Data Table on Drug Class - Market share 2023-2028 (%)
- 7.2 Comparison by Drug Class
- Chart on Comparison by Drug Class
- Data Table on Comparison by Drug Class
- 7.3 Biologics - Market size and forecast 2023-2028
- Chart on Biologics - Market size and forecast 2023-2028 ($ million)
- Data Table on Biologics - Market size and forecast 2023-2028 ($ million)
- Chart on Biologics - Year-over-year growth 2023-2028 (%)
- Data Table on Biologics - Year-over-year growth 2023-2028 (%)
- 7.4 PDE4 inhibitors - Market size and forecast 2023-2028
- Chart on PDE4 inhibitors - Market size and forecast 2023-2028 ($ million)
- Data Table on PDE4 inhibitors - Market size and forecast 2023-2028 ($ million)
- Chart on PDE4 inhibitors - Year-over-year growth 2023-2028 (%)
- Data Table on PDE4 inhibitors - Year-over-year growth 2023-2028 (%)
- 7.5 Corticosteroids - Market size and forecast 2023-2028
- Chart on Corticosteroids - Market size and forecast 2023-2028 ($ million)
- Data Table on Corticosteroids - Market size and forecast 2023-2028 ($ million)
- Chart on Corticosteroids - Year-over-year growth 2023-2028 (%)
- Data Table on Corticosteroids - Year-over-year growth 2023-2028 (%)
- 7.6 Calcineurin inhibitors - Market size and forecast 2023-2028
- Chart on Calcineurin inhibitors - Market size and forecast 2023-2028 ($ million)
- Data Table on Calcineurin inhibitors - Market size and forecast 2023-2028 ($ million)
- Chart on Calcineurin inhibitors - Year-over-year growth 2023-2028 (%)
- Data Table on Calcineurin inhibitors - Year-over-year growth 2023-2028 (%)
- 7.7 Market opportunity by Drug Class
- Market opportunity by Drug Class ($ million)
- Data Table on Market opportunity by Drug Class ($ million)
8 Customer Landscape
- 8.1 Customer landscape overview
- Analysis of price sensitivity, lifecycle, customer purchase basket, adoption rates, and purchase criteria
9 Geographic Landscape
- 9.1 Geographic segmentation
- Chart on Market share By Geographical Landscape2023-2028 (%)
- Data Table on Market share By Geographical Landscape2023-2028 (%)
- 9.2 Geographic comparison
- Chart on Geographic comparison
- Data Table on Geographic comparison
- 9.3 North America - Market size and forecast 2023-2028
- Chart on North America - Market size and forecast 2023-2028 ($ million)
- Data Table on North America - Market size and forecast 2023-2028 ($ million)
- Chart on North America - Year-over-year growth 2023-2028 (%)
- Data Table on North America - Year-over-year growth 2023-2028 (%)
- 9.4 Europe - Market size and forecast 2023-2028
- Chart on Europe - Market size and forecast 2023-2028 ($ million)
- Data Table on Europe - Market size and forecast 2023-2028 ($ million)
- Chart on Europe - Year-over-year growth 2023-2028 (%)
- Data Table on Europe - Year-over-year growth 2023-2028 (%)
- 9.5 Asia - Market size and forecast 2023-2028
- Chart on Asia - Market size and forecast 2023-2028 ($ million)
- Data Table on Asia - Market size and forecast 2023-2028 ($ million)
- Chart on Asia - Year-over-year growth 2023-2028 (%)
- Data Table on Asia - Year-over-year growth 2023-2028 (%)
- 9.6 Rest of World (ROW) - Market size and forecast 2023-2028
- Chart on Rest of World (ROW) - Market size and forecast 2023-2028 ($ million)
- Data Table on Rest of World (ROW) - Market size and forecast 2023-2028 ($ million)
- Chart on Rest of World (ROW) - Year-over-year growth 2023-2028 (%)
- Data Table on Rest of World (ROW) - Year-over-year growth 2023-2028 (%)
- 9.7 US - Market size and forecast 2023-2028
- Chart on US - Market size and forecast 2023-2028 ($ million)
- Data Table on US - Market size and forecast 2023-2028 ($ million)
- Chart on US - Year-over-year growth 2023-2028 (%)
- Data Table on US - Year-over-year growth 2023-2028 (%)
- 9.8 Canada - Market size and forecast 2023-2028
- Chart on Canada - Market size and forecast 2023-2028 ($ million)
- Data Table on Canada - Market size and forecast 2023-2028 ($ million)
- Chart on Canada - Year-over-year growth 2023-2028 (%)
- Data Table on Canada - Year-over-year growth 2023-2028 (%)
- 9.9 Germany - Market size and forecast 2023-2028
- Chart on Germany - Market size and forecast 2023-2028 ($ million)
- Data Table on Germany - Market size and forecast 2023-2028 ($ million)
- Chart on Germany - Year-over-year growth 2023-2028 (%)
- Data Table on Germany - Year-over-year growth 2023-2028 (%)
- 9.10 UK - Market size and forecast 2023-2028
- Chart on UK - Market size and forecast 2023-2028 ($ million)
- Data Table on UK - Market size and forecast 2023-2028 ($ million)
- Chart on UK - Year-over-year growth 2023-2028 (%)
- Data Table on UK - Year-over-year growth 2023-2028 (%)
- 9.11 China - Market size and forecast 2023-2028
- Chart on China - Market size and forecast 2023-2028 ($ million)
- Data Table on China - Market size and forecast 2023-2028 ($ million)
- Chart on China - Year-over-year growth 2023-2028 (%)
- Data Table on China - Year-over-year growth 2023-2028 (%)
- 9.12 Market opportunity by geography
- Market opportunity By Geographical Landscape($ million)
- Data Tables on Market opportunity By Geographical Landscape($ million)
10 Drivers, Challenges, and Opportunity/Restraints
- 10.1 Market drivers
- 10.2 Market challenges
- 10.3 Impact of drivers and challenges
- Impact of drivers and challenges in 2023 and 2028
- 10.4 Market opportunities/restraints
11 Competitive Landscape
- 11.1 Overview
- 11.2 Competitive Landscape
- Overview on criticality of inputs and factors of differentiation
- 11.3 Landscape disruption
- Overview on factors of disruption
- 11.4 Industry risks
- Impact of key risks on business
12 Competitive Analysis
- 12.1 Companies profiled
- Companies covered
- 12.2 Market positioning of companies
- Matrix on companies position and classification
- 12.3 AbbVie Inc.
- AbbVie Inc. - Overview
- AbbVie Inc. - Product / Service
- AbbVie Inc. - Key news
- AbbVie Inc. - Key offerings
- 12.4 Arcutis Biotherapeutics Inc.
- Arcutis Biotherapeutics Inc. - Overview
- Arcutis Biotherapeutics Inc. - Product / Service
- Arcutis Biotherapeutics Inc. - Key news
- Arcutis Biotherapeutics Inc. - Key offerings
- 12.5 Bausch Health Companies Inc.
- Bausch Health Companies Inc. - Overview
- Bausch Health Companies Inc. - Business segments
- Bausch Health Companies Inc. - Key news
- Bausch Health Companies Inc. - Key offerings
- Bausch Health Companies Inc. - Segment focus
- 12.6 Bristol Myers Squibb Co.
- Bristol Myers Squibb Co. - Overview
- Bristol Myers Squibb Co. - Product / Service
- Bristol Myers Squibb Co. - Key news
- Bristol Myers Squibb Co. - Key offerings
- 12.7 Eli Lilly and Co.
- Eli Lilly and Co. - Overview
- Eli Lilly and Co. - Product / Service
- Eli Lilly and Co. - Key news
- Eli Lilly and Co. - Key offerings
- 12.8 Evelo Biosciences Inc.
- Evelo Biosciences Inc. - Overview
- Evelo Biosciences Inc. - Product / Service
- Evelo Biosciences Inc. - Key offerings
- 12.9 Galderma SA
- Galderma SA - Overview
- Galderma SA - Product / Service
- Galderma SA - Key offerings
- 12.10 Incyte Corp.
- Incyte Corp. - Overview
- Incyte Corp. - Product / Service
- Incyte Corp. - Key offerings
- 12.11 LEO Pharma AS
- LEO Pharma AS - Overview
- LEO Pharma AS - Business segments
- LEO Pharma AS - Key offerings
- LEO Pharma AS - Segment focus
- 12.12 Maruho Co. Ltd.
- Maruho Co. Ltd. - Overview
- Maruho Co. Ltd. - Product / Service
- Maruho Co. Ltd. - Key news
- Maruho Co. Ltd. - Key offerings
- 12.13 Novartis AG
- Novartis AG - Overview
- Novartis AG - Business segments
- Novartis AG - Key news
- Novartis AG - Key offerings
- Novartis AG - Segment focus
- 12.14 Otsuka Holdings Co. Ltd.
- Otsuka Holdings Co. Ltd. - Overview
- Otsuka Holdings Co. Ltd. - Business segments
- Otsuka Holdings Co. Ltd. - Key offerings
- Otsuka Holdings Co. Ltd. - Segment focus
- 12.15 Pfizer Inc.
- Pfizer Inc. - Overview
- Pfizer Inc. - Product / Service
- Pfizer Inc. - Key news
- Pfizer Inc. - Key offerings
- 12.16 Sanofi SA
- Sanofi SA - Overview
- Sanofi SA - Business segments
- Sanofi SA - Key news
- Sanofi SA - Key offerings
- Sanofi SA - Segment focus
- 12.17 Viatris Inc.
- Viatris Inc. - Overview
- Viatris Inc. - Business segments
- Viatris Inc. - Key news
- Viatris Inc. - Key offerings
- Viatris Inc. - Segment focus
13 Appendix
- 13.1 Scope of the report
- 13.2 Inclusions and exclusions checklist
- Inclusions checklist
- Exclusions checklist
- 13.3 Currency conversion rates for US$
- Currency conversion rates for US$
- 13.4 Research methodology
- Research methodology
- 13.5 Data procurement
- Information sources
- 13.6 Data validation
- Data validation
- 13.7 Validation techniques employed for market sizing
- Validation techniques employed for market sizing
- 13.8 Data synthesis
- Data synthesis
- 13.9 360 degree market analysis
- 360 degree market analysis
- 13.10 List of abbreviations
- List of abbreviations
