|
|
市場調査レポート
商品コード
1583031
海底アンビリカル、ライザー、フローライン(サーフ)の世界市場 2024-2028年Global Subsea Umbilicals, Risers, and Flow Lines (surf) Market 2024-2028 |
||||||

|
|||||||
カスタマイズ可能
|
|||||||

| 海底アンビリカル、ライザー、フローライン(サーフ)の世界市場 2024-2028年 |
|
出版日: 2024年08月21日
発行: TechNavio
ページ情報: 英文 182 Pages
納期: 即納可能
|

全表示
- 概要
- 図表
- 目次
海底アンビリカル、ライザー、フローライン(サーフ)市場 2024-2028年
海底アンビリカル、ライザー、フローライン(サーフ)市場は2023-2028年に49億米ドル、予測期間中のCAGRは9.53%で成長すると予測されます。当レポートでは、海底アンビリカル、ライザー、フローライン(サーフ)市場の全体的な分析、市場規模・予測、動向、成長促進要因、課題、約25のベンダーを網羅したベンダー分析などを掲載しています。
現在の市場シナリオ、最新動向と促進要因、市場環境全体に関する最新分析を提供しています。市場は、新たな探査政策の台頭、エネルギー需要の急増、深海・超深海石油・ガスプロジェクトのE&Pコストの低下によって牽引されています。
| 市場範囲 | |
|---|---|
| 基準年 | 2024 |
| 終了年 | 2028 |
| 予測期間 | 2024-2028 |
| 成長モメンタム | 加速 |
| 前年比2024年 | 8.24% |
| CAGR | 9.53% |
| 増分額 | 49億米ドル |
本調査では、今後数年間の海底アンビリカル、ライザー、フローライン(サーフ)市場成長を牽引する主な要因の1つとして、海底処理の進歩を挙げています。また、ワークオーバーリグでのレーザー技術の使用や次世代自動掘削リグの出現は、市場の大きな需要につながります。
目次
第1章 エグゼクティブサマリー
- 市場概要
第2章 市場情勢
- 市場エコシステム
- 市場の特徴
- バリューチェーン分析
第3章 市場規模の評価
- 市場の定義
- 市場セグメント分析
- 市場規模 2023
- 市場の見通し 2023-2028
第4章 市場規模実績
- 海底アンビリカル、ライザー、フローライン(サーフ)の世界市場 2018-2022
- 製品別セグメント分析 2018-2022
- タイプ別セグメント分析 2018-2022
- 地域別セグメント分析 2018-2022
- 国別セグメント分析 2018-2022
第5章 ファイブフォース分析
- ファイブフォースの要約
- 買い手の交渉力
- 供給企業の交渉力
- 新規参入業者の脅威
- 代替品の脅威
- 競争の脅威
- 市況
第6章 市場セグメンテーション:製品別
- 市場セグメンテーション
- 比較:製品別
- フローライン:市場規模と予測 2023-2028
- アンビリカル:市場規模と予測 2023-2028
- ライザー:市場規模と予測 2023-2028
- 製品別の市場機会
第7章 市場セグメンテーション:タイプ別
- 市場セグメンテーション
- 比較:タイプ別
- 浅瀬:市場規模と予測 2023-2028
- 深海:市場規模と予測 2023-2028
- 超深海:市場規模と予測 2023-2028
- タイプ別の市場機会
第8章 顧客情勢
- 顧客情勢の概要
第9章 地域別情勢
- 地域別セグメンテーション
- 地域別比較
- アジア太平洋:市場規模と予測 2023-2028
- 欧州:市場規模と予測 2023-2028
- 北米:市場規模と予測 2023-2028
- 中東・アフリカ:市場規模と予測 2023-2028
- 南米:市場規模と予測 2023-2028
- 中国:市場規模と予測 2023-2028
- 米国:市場規模と予測 2023-2028
- ロシア:市場規模と予測 2023-2028
- アラブ首長国連邦:市場規模と予測 2023-2028
- カナダ:市場規模と予測 2023-2028
- 地域情勢別市場機会
第10章 促進要因・課題・機会・抑制要因
- 市場促進要因
- 市場の課題
- 促進要因と課題の影響
- 市場の機会・抑制要因
第11章 競合情勢
- 概要
- 競合情勢
- 混乱の状況
- 業界のリスク
第12章 競合分析
- 企業プロファイル
- 企業の市場ポジショニング
- ABB Ltd.
- Aker Solutions ASA
- ArcelorMittal SA
- Baker Hughes Co.
- Dril Quip Inc.
- Havfram
- Kongsberg Gruppen ASA
- McDermott International Ltd.
- Nexans SA
- NOV Inc.
- Oceaneering International Inc.
- Prysmian Spa
- Saipem S.p.A.
- Schlumberger Ltd.
- TechnipFMC plc
第13章 付録
Exhibits:
- Exhibits1: Executive Summary - Chart on Market Overview
- Exhibits2: Executive Summary - Data Table on Market Overview
- Exhibits3: Executive Summary - Chart on Global Market Characteristics
- Exhibits4: Executive Summary - Chart on Market By Geographical Landscape
- Exhibits5: Executive Summary - Chart on Market Segmentation by Product
- Exhibits6: Executive Summary - Chart on Market Segmentation by Type
- Exhibits7: Executive Summary - Chart on Incremental Growth
- Exhibits8: Executive Summary - Data Table on Incremental Growth
- Exhibits9: Executive Summary - Chart on Company Market Positioning
- Exhibits10: Parent Market
- Exhibits11: Data Table on - Parent Market
- Exhibits12: Market characteristics analysis
- Exhibits13: Value Chain Analysis
- Exhibits14: Offerings of companies included in the market definition
- Exhibits15: Market segments
- Exhibits16: Chart on Global - Market size and forecast 2023-2028 ($ billion)
- Exhibits17: Data Table on Global - Market size and forecast 2023-2028 ($ billion)
- Exhibits18: Chart on Global Market: Year-over-year growth 2023-2028 (%)
- Exhibits19: Data Table on Global Market: Year-over-year growth 2023-2028 (%)
- Exhibits20: Historic Market Size - Data Table on Global Subsea Umbilicals, Risers, And Flow Lines (Surf) Market 2018 - 2022 ($ billion)
- Exhibits21: Historic Market Size - Product Segment 2018 - 2022 ($ billion)
- Exhibits22: Historic Market Size - Type Segment 2018 - 2022 ($ billion)
- Exhibits23: Historic Market Size - Geography Segment 2018 - 2022 ($ billion)
- Exhibits24: Historic Market Size - Country Segment 2018 - 2022 ($ billion)
- Exhibits25: Five forces analysis - Comparison between 2023 and 2028
- Exhibits26: Bargaining power of buyers - Impact of key factors 2023 and 2028
- Exhibits27: Bargaining power of suppliers - Impact of key factors in 2023 and 2028
- Exhibits28: Threat of new entrants - Impact of key factors in 2023 and 2028
- Exhibits29: Threat of substitutes - Impact of key factors in 2023 and 2028
- Exhibits30: Threat of rivalry - Impact of key factors in 2023 and 2028
- Exhibits31: Chart on Market condition - Five forces 2023 and 2028
- Exhibits32: Chart on Product - Market share 2023-2028 (%)
- Exhibits33: Data Table on Product - Market share 2023-2028 (%)
- Exhibits34: Chart on Comparison by Product
- Exhibits35: Data Table on Comparison by Product
- Exhibits36: Chart on Flowlines - Market size and forecast 2023-2028 ($ billion)
- Exhibits37: Data Table on Flowlines - Market size and forecast 2023-2028 ($ billion)
- Exhibits38: Chart on Flowlines - Year-over-year growth 2023-2028 (%)
- Exhibits39: Data Table on Flowlines - Year-over-year growth 2023-2028 (%)
- Exhibits40: Chart on Umbilicals - Market size and forecast 2023-2028 ($ billion)
- Exhibits41: Data Table on Umbilicals - Market size and forecast 2023-2028 ($ billion)
- Exhibits42: Chart on Umbilicals - Year-over-year growth 2023-2028 (%)
- Exhibits43: Data Table on Umbilicals - Year-over-year growth 2023-2028 (%)
- Exhibits44: Chart on Risers - Market size and forecast 2023-2028 ($ billion)
- Exhibits45: Data Table on Risers - Market size and forecast 2023-2028 ($ billion)
- Exhibits46: Chart on Risers - Year-over-year growth 2023-2028 (%)
- Exhibits47: Data Table on Risers - Year-over-year growth 2023-2028 (%)
- Exhibits48: Market opportunity by Product ($ billion)
- Exhibits49: Data Table on Market opportunity by Product ($ billion)
- Exhibits50: Chart on Type - Market share 2023-2028 (%)
- Exhibits51: Data Table on Type - Market share 2023-2028 (%)
- Exhibits52: Chart on Comparison by Type
- Exhibits53: Data Table on Comparison by Type
- Exhibits54: Chart on Shallow water - Market size and forecast 2023-2028 ($ billion)
- Exhibits55: Data Table on Shallow water - Market size and forecast 2023-2028 ($ billion)
- Exhibits56: Chart on Shallow water - Year-over-year growth 2023-2028 (%)
- Exhibits57: Data Table on Shallow water - Year-over-year growth 2023-2028 (%)
- Exhibits58: Chart on Deep water - Market size and forecast 2023-2028 ($ billion)
- Exhibits59: Data Table on Deep water - Market size and forecast 2023-2028 ($ billion)
- Exhibits60: Chart on Deep water - Year-over-year growth 2023-2028 (%)
- Exhibits61: Data Table on Deep water - Year-over-year growth 2023-2028 (%)
- Exhibits62: Chart on Ultra deep water - Market size and forecast 2023-2028 ($ billion)
- Exhibits63: Data Table on Ultra deep water - Market size and forecast 2023-2028 ($ billion)
- Exhibits64: Chart on Ultra deep water - Year-over-year growth 2023-2028 (%)
- Exhibits65: Data Table on Ultra deep water - Year-over-year growth 2023-2028 (%)
- Exhibits66: Market opportunity by Type ($ billion)
- Exhibits67: Data Table on Market opportunity by Type ($ billion)
- Exhibits68: Analysis of price sensitivity, lifecycle, customer purchase basket, adoption rates, and purchase criteria
- Exhibits69: Chart on Market share By Geographical Landscape 2023-2028 (%)
- Exhibits70: Data Table on Market share By Geographical Landscape 2023-2028 (%)
- Exhibits71: Chart on Geographic comparison
- Exhibits72: Data Table on Geographic comparison
- Exhibits73: Chart on APAC - Market size and forecast 2023-2028 ($ billion)
- Exhibits74: Data Table on APAC - Market size and forecast 2023-2028 ($ billion)
- Exhibits75: Chart on APAC - Year-over-year growth 2023-2028 (%)
- Exhibits76: Data Table on APAC - Year-over-year growth 2023-2028 (%)
- Exhibits77: Chart on Europe - Market size and forecast 2023-2028 ($ billion)
- Exhibits78: Data Table on Europe - Market size and forecast 2023-2028 ($ billion)
- Exhibits79: Chart on Europe - Year-over-year growth 2023-2028 (%)
- Exhibits80: Data Table on Europe - Year-over-year growth 2023-2028 (%)
- Exhibits81: Chart on North America - Market size and forecast 2023-2028 ($ billion)
- Exhibits82: Data Table on North America - Market size and forecast 2023-2028 ($ billion)
- Exhibits83: Chart on North America - Year-over-year growth 2023-2028 (%)
- Exhibits84: Data Table on North America - Year-over-year growth 2023-2028 (%)
- Exhibits85: Chart on Middle East and Africa - Market size and forecast 2023-2028 ($ billion)
- Exhibits86: Data Table on Middle East and Africa - Market size and forecast 2023-2028 ($ billion)
- Exhibits87: Chart on Middle East and Africa - Year-over-year growth 2023-2028 (%)
- Exhibits88: Data Table on Middle East and Africa - Year-over-year growth 2023-2028 (%)
- Exhibits89: Chart on South America - Market size and forecast 2023-2028 ($ billion)
- Exhibits90: Data Table on South America - Market size and forecast 2023-2028 ($ billion)
- Exhibits91: Chart on South America - Year-over-year growth 2023-2028 (%)
- Exhibits92: Data Table on South America - Year-over-year growth 2023-2028 (%)
- Exhibits93: Chart on China - Market size and forecast 2023-2028 ($ billion)
- Exhibits94: Data Table on China - Market size and forecast 2023-2028 ($ billion)
- Exhibits95: Chart on China - Year-over-year growth 2023-2028 (%)
- Exhibits96: Data Table on China - Year-over-year growth 2023-2028 (%)
- Exhibits97: Chart on US - Market size and forecast 2023-2028 ($ billion)
- Exhibits98: Data Table on US - Market size and forecast 2023-2028 ($ billion)
- Exhibits99: Chart on US - Year-over-year growth 2023-2028 (%)
- Exhibits100: Data Table on US - Year-over-year growth 2023-2028 (%)
- Exhibits101: Chart on Russia - Market size and forecast 2023-2028 ($ billion)
- Exhibits102: Data Table on Russia - Market size and forecast 2023-2028 ($ billion)
- Exhibits103: Chart on Russia - Year-over-year growth 2023-2028 (%)
- Exhibits104: Data Table on Russia - Year-over-year growth 2023-2028 (%)
- Exhibits105: Chart on United Arab Emirates - Market size and forecast 2023-2028 ($ billion)
- Exhibits106: Data Table on United Arab Emirates - Market size and forecast 2023-2028 ($ billion)
- Exhibits107: Chart on United Arab Emirates - Year-over-year growth 2023-2028 (%)
- Exhibits108: Data Table on United Arab Emirates - Year-over-year growth 2023-2028 (%)
- Exhibits109: Chart on Canada - Market size and forecast 2023-2028 ($ billion)
- Exhibits110: Data Table on Canada - Market size and forecast 2023-2028 ($ billion)
- Exhibits111: Chart on Canada - Year-over-year growth 2023-2028 (%)
- Exhibits112: Data Table on Canada - Year-over-year growth 2023-2028 (%)
- Exhibits113: Market opportunity By Geographical Landscape ($ billion)
- Exhibits114: Data Tables on Market opportunity By Geographical Landscape ($ billion)
- Exhibits115: Impact of drivers and challenges in 2023 and 2028
- Exhibits116: Overview on criticality of inputs and factors of differentiation
- Exhibits117: Overview on factors of disruption
- Exhibits118: Impact of key risks on business
- Exhibits119: Companies covered
- Exhibits120: Matrix on companies position and classification
- Exhibits121: ABB Ltd. - Overview
- Exhibits122: ABB Ltd. - Business segments
- Exhibits123: ABB Ltd. - Key news
- Exhibits124: ABB Ltd. - Key offerings
- Exhibits125: ABB Ltd. - Segment focus
- Exhibits126: Aker Solutions ASA - Overview
- Exhibits127: Aker Solutions ASA - Business segments
- Exhibits128: Aker Solutions ASA - Key news
- Exhibits129: Aker Solutions ASA - Key offerings
- Exhibits130: Aker Solutions ASA - Segment focus
- Exhibits131: ArcelorMittal SA - Overview
- Exhibits132: ArcelorMittal SA - Business segments
- Exhibits133: ArcelorMittal SA - Key news
- Exhibits134: ArcelorMittal SA - Key offerings
- Exhibits135: ArcelorMittal SA - Segment focus
- Exhibits136: Baker Hughes Co. - Overview
- Exhibits137: Baker Hughes Co. - Business segments
- Exhibits138: Baker Hughes Co. - Key news
- Exhibits139: Baker Hughes Co. - Key offerings
- Exhibits140: Baker Hughes Co. - Segment focus
- Exhibits141: Dril Quip Inc. - Overview
- Exhibits142: Dril Quip Inc. - Business segments
- Exhibits143: Dril Quip Inc. - Key news
- Exhibits144: Dril Quip Inc. - Key offerings
- Exhibits145: Dril Quip Inc. - Segment focus
- Exhibits146: Havfram - Overview
- Exhibits147: Havfram - Product / Service
- Exhibits148: Havfram - Key offerings
- Exhibits149: Kongsberg Gruppen ASA - Overview
- Exhibits150: Kongsberg Gruppen ASA - Business segments
- Exhibits151: Kongsberg Gruppen ASA - Key news
- Exhibits152: Kongsberg Gruppen ASA - Key offerings
- Exhibits153: Kongsberg Gruppen ASA - Segment focus
- Exhibits154: McDermott International Ltd. - Overview
- Exhibits155: McDermott International Ltd. - Product / Service
- Exhibits156: McDermott International Ltd. - Key offerings
- Exhibits157: Nexans SA - Overview
- Exhibits158: Nexans SA - Business segments
- Exhibits159: Nexans SA - Key news
- Exhibits160: Nexans SA - Key offerings
- Exhibits161: Nexans SA - Segment focus
- Exhibits162: NOV Inc. - Overview
- Exhibits163: NOV Inc. - Business segments
- Exhibits164: NOV Inc. - Key news
- Exhibits165: NOV Inc. - Key offerings
- Exhibits166: NOV Inc. - Segment focus
- Exhibits167: Oceaneering International Inc. - Overview
- Exhibits168: Oceaneering International Inc. - Product / Service
- Exhibits169: Oceaneering International Inc. - Key offerings
- Exhibits170: Prysmian Spa - Overview
- Exhibits171: Prysmian Spa - Business segments
- Exhibits172: Prysmian Spa - Key news
- Exhibits173: Prysmian Spa - Key offerings
- Exhibits174: Prysmian Spa - Segment focus
- Exhibits175: Saipem S.p.A. - Overview
- Exhibits176: Saipem S.p.A. - Business segments
- Exhibits177: Saipem S.p.A. - Key offerings
- Exhibits178: Saipem S.p.A. - Segment focus
- Exhibits179: Schlumberger Ltd. - Overview
- Exhibits180: Schlumberger Ltd. - Business segments
- Exhibits181: Schlumberger Ltd. - Key news
- Exhibits182: Schlumberger Ltd. - Key offerings
- Exhibits183: Schlumberger Ltd. - Segment focus
- Exhibits184: TechnipFMC plc - Overview
- Exhibits185: TechnipFMC plc - Business segments
- Exhibits186: TechnipFMC plc - Key news
- Exhibits187: TechnipFMC plc - Key offerings
- Exhibits188: TechnipFMC plc - Segment focus
- Exhibits189: Inclusions checklist
- Exhibits190: Exclusions checklist
- Exhibits191: Currency conversion rates for US$
- Exhibits192: Research methodology
- Exhibits193: Information sources
- Exhibits194: Data validation
- Exhibits195: Validation techniques employed for market sizing
- Exhibits196: Data synthesis
- Exhibits197: 360 degree market analysis
- Exhibits198: List of abbreviations
Subsea Umbilicals, Risers, And Flow Lines (SURF) Market 2024-2028
The subsea umbilicals, risers, and flow lines (SURF) market is forecasted to grow by USD 4.9 bn during 2023-2028, accelerating at a CAGR of 9.53% during the forecast period. The report on the subsea umbilicals, risers, and flow lines (SURF) market provides a holistic analysis, market size and forecast, trends, growth drivers, and challenges, as well as vendor analysis covering around 25 vendors.
The report offers an up-to-date analysis regarding the current market scenario, the latest trends and drivers, and the overall market environment. The market is driven by rise in new exploration policies, surge in energy demand, and declining E&P cost of deep water and ultra-deepwater oil and gas projects.
| Market Scope | |
|---|---|
| Base Year | 2024 |
| End Year | 2028 |
| Series Year | 2024-2028 |
| Growth Momentum | Accelerate |
| YOY 2024 | 8.24% |
| CAGR | 9.53% |
| Incremental Value | $4.9 bn |
Technavio's subsea umbilicals, risers, and flow lines (SURF) market is segmented as below:
By Product
- Flowlines
- Umbilicals
- Risers
By Type
- Shallow water
- Deep water
- Ultra deep water
By Geographical Landscape
- APAC
- Europe
- North America
- Middle East and Africa
- South America
This study identifies the advances in subsea processing as one of the prime reasons driving the subsea umbilicals, risers, and flow lines (SURF) market growth during the next few years. Also, using laser technology in workover rigs and emergence of next-generation automated drilling rigs will lead to sizable demand in the market.
The report on the subsea umbilicals, risers, and flow lines (SURF) market covers the following areas:
- Subsea umbilicals, risers, and flow lines (SURF) market sizing
- Subsea umbilicals, risers, and flow lines (SURF) market forecast
- Subsea umbilicals, risers, and flow lines (SURF) market industry analysis
The vendor analysis is designed to help clients improve their market position, and in line with this, this report provides a detailed analysis of several leading subsea umbilicals, risers, and flow lines (SURF) market vendors that include ABB Ltd., Aker Solutions ASA, ArcelorMittal SA, Baker Hughes Co., Bureau Veritas SA, Dril Quip Inc., FIRST Exploration and Petroleum Development Co. Ltd., Havfram, Kongsberg Gruppen ASA, McDermott International Ltd., Nexans SA, NOV Inc., Oceaneering International Inc., Parker Hannifin Corp., Prysmian Spa, Saipem S.p.A., Schlumberger Ltd., Subsea 7 SA, TechnipFMC PLC, and Vallourec SA. Also, the subsea umbilicals, risers, and flow lines (SURF) market analysis report includes information on upcoming trends and challenges that will influence market growth. This is to help companies strategize and leverage all forthcoming growth opportunities.
The study was conducted using an objective combination of primary and secondary information including inputs from key participants in the industry. The report contains a comprehensive market and vendor landscape in addition to an analysis of the key vendors.
It presents various market facets by identifying the key industry influencers. The data presented is comprehensive, reliable, and a result of extensive research - both primary and secondary. The market research reports provide a complete competitive landscape and an in-depth vendor selection methodology and analysis using qualitative and quantitative research to forecast the accurate market growth.
Table of Contents
1 Executive Summary
- 1.1 Market overview
- Executive Summary - Chart on Market Overview
- Executive Summary - Data Table on Market Overview
- Executive Summary - Chart on Global Market Characteristics
- Executive Summary - Chart on Market By Geographical Landscape
- Executive Summary - Chart on Market Segmentation by Product
- Executive Summary - Chart on Market Segmentation by Type
- Executive Summary - Chart on Incremental Growth
- Executive Summary - Data Table on Incremental Growth
- Executive Summary - Chart on Company Market Positioning
2 Market Landscape
- 2.1 Market ecosystem
- Parent Market
- Data Table on - Parent Market
- 2.2 Market characteristics
- Market characteristics analysis
- 2.3 Value chain analysis
- Value Chain Analysis
3 Market Sizing
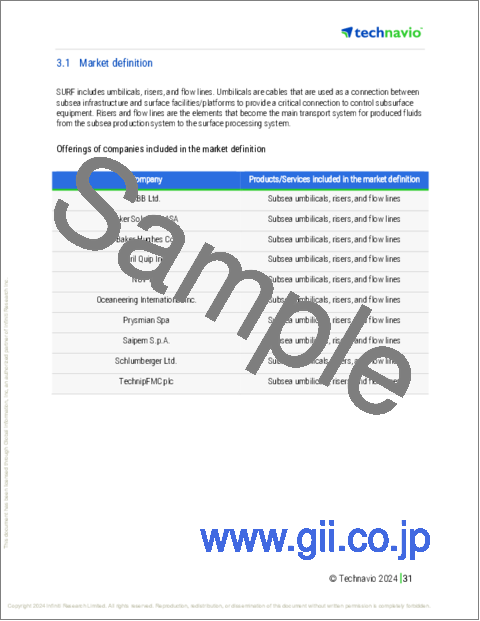
- 3.1 Market definition
- Offerings of companies included in the market definition
- 3.2 Market segment analysis
- Market segments
- 3.3 Market size 2023
- 3.4 Market outlook: Forecast for 2023-2028
- Chart on Global - Market size and forecast 2023-2028 ($ billion)
- Data Table on Global - Market size and forecast 2023-2028 ($ billion)
- Chart on Global Market: Year-over-year growth 2023-2028 (%)
- Data Table on Global Market: Year-over-year growth 2023-2028 (%)
4 Historic Market Size
- 4.1 Global Subsea Umbilicals, Risers, And Flow Lines (Surf) Market 2018 - 2022
- Historic Market Size - Data Table on Global Subsea Umbilicals, Risers, And Flow Lines (Surf) Market 2018 - 2022 ($ billion)
- 4.2 Product segment analysis 2018 - 2022
- Historic Market Size - Product Segment 2018 - 2022 ($ billion)
- 4.3 Type segment analysis 2018 - 2022
- Historic Market Size - Type Segment 2018 - 2022 ($ billion)
- 4.4 Geography segment analysis 2018 - 2022
- Historic Market Size - Geography Segment 2018 - 2022 ($ billion)
- 4.5 Country segment analysis 2018 - 2022
- Historic Market Size - Country Segment 2018 - 2022 ($ billion)
5 Five Forces Analysis
- 5.1 Five forces summary
- Five forces analysis - Comparison between 2023 and 2028
- 5.2 Bargaining power of buyers
- Bargaining power of buyers - Impact of key factors 2023 and 2028
- 5.3 Bargaining power of suppliers
- Bargaining power of suppliers - Impact of key factors in 2023 and 2028
- 5.4 Threat of new entrants
- Threat of new entrants - Impact of key factors in 2023 and 2028
- 5.5 Threat of substitutes
- Threat of substitutes - Impact of key factors in 2023 and 2028
- 5.6 Threat of rivalry
- Threat of rivalry - Impact of key factors in 2023 and 2028
- 5.7 Market condition
- Chart on Market condition - Five forces 2023 and 2028
6 Market Segmentation by Product
- 6.1 Market segments
- Chart on Product - Market share 2023-2028 (%)
- Data Table on Product - Market share 2023-2028 (%)
- 6.2 Comparison by Product
- Chart on Comparison by Product
- Data Table on Comparison by Product
- 6.3 Flowlines - Market size and forecast 2023-2028
- Chart on Flowlines - Market size and forecast 2023-2028 ($ billion)
- Data Table on Flowlines - Market size and forecast 2023-2028 ($ billion)
- Chart on Flowlines - Year-over-year growth 2023-2028 (%)
- Data Table on Flowlines - Year-over-year growth 2023-2028 (%)
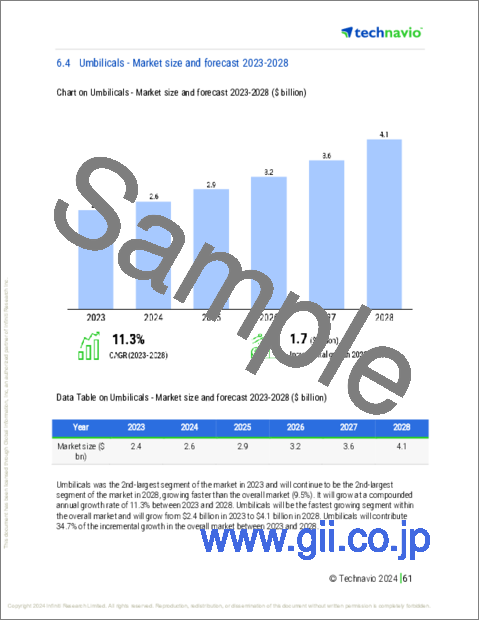
- 6.4 Umbilicals - Market size and forecast 2023-2028
- Chart on Umbilicals - Market size and forecast 2023-2028 ($ billion)
- Data Table on Umbilicals - Market size and forecast 2023-2028 ($ billion)
- Chart on Umbilicals - Year-over-year growth 2023-2028 (%)
- Data Table on Umbilicals - Year-over-year growth 2023-2028 (%)
- 6.5 Risers - Market size and forecast 2023-2028
- Chart on Risers - Market size and forecast 2023-2028 ($ billion)
- Data Table on Risers - Market size and forecast 2023-2028 ($ billion)
- Chart on Risers - Year-over-year growth 2023-2028 (%)
- Data Table on Risers - Year-over-year growth 2023-2028 (%)
- 6.6 Market opportunity by Product
- Market opportunity by Product ($ billion)
- Data Table on Market opportunity by Product ($ billion)
7 Market Segmentation by Type
- 7.1 Market segments
- Chart on Type - Market share 2023-2028 (%)
- Data Table on Type - Market share 2023-2028 (%)
- 7.2 Comparison by Type
- Chart on Comparison by Type
- Data Table on Comparison by Type
- 7.3 Shallow water - Market size and forecast 2023-2028
- Chart on Shallow water - Market size and forecast 2023-2028 ($ billion)
- Data Table on Shallow water - Market size and forecast 2023-2028 ($ billion)
- Chart on Shallow water - Year-over-year growth 2023-2028 (%)
- Data Table on Shallow water - Year-over-year growth 2023-2028 (%)
- 7.4 Deep water - Market size and forecast 2023-2028
- Chart on Deep water - Market size and forecast 2023-2028 ($ billion)
- Data Table on Deep water - Market size and forecast 2023-2028 ($ billion)
- Chart on Deep water - Year-over-year growth 2023-2028 (%)
- Data Table on Deep water - Year-over-year growth 2023-2028 (%)
- 7.5 Ultra deep water - Market size and forecast 2023-2028
- Chart on Ultra deep water - Market size and forecast 2023-2028 ($ billion)
- Data Table on Ultra deep water - Market size and forecast 2023-2028 ($ billion)
- Chart on Ultra deep water - Year-over-year growth 2023-2028 (%)
- Data Table on Ultra deep water - Year-over-year growth 2023-2028 (%)
- 7.6 Market opportunity by Type
- Market opportunity by Type ($ billion)
- Data Table on Market opportunity by Type ($ billion)
8 Customer Landscape
- 8.1 Customer landscape overview
- Analysis of price sensitivity, lifecycle, customer purchase basket, adoption rates, and purchase criteria
9 Geographic Landscape
- 9.1 Geographic segmentation
- Chart on Market share By Geographical Landscape 2023-2028 (%)
- Data Table on Market share By Geographical Landscape 2023-2028 (%)
- 9.2 Geographic comparison
- Chart on Geographic comparison
- Data Table on Geographic comparison
- 9.3 APAC - Market size and forecast 2023-2028
- Chart on APAC - Market size and forecast 2023-2028 ($ billion)
- Data Table on APAC - Market size and forecast 2023-2028 ($ billion)
- Chart on APAC - Year-over-year growth 2023-2028 (%)
- Data Table on APAC - Year-over-year growth 2023-2028 (%)
- 9.4 Europe - Market size and forecast 2023-2028
- Chart on Europe - Market size and forecast 2023-2028 ($ billion)
- Data Table on Europe - Market size and forecast 2023-2028 ($ billion)
- Chart on Europe - Year-over-year growth 2023-2028 (%)
- Data Table on Europe - Year-over-year growth 2023-2028 (%)
- 9.5 North America - Market size and forecast 2023-2028
- Chart on North America - Market size and forecast 2023-2028 ($ billion)
- Data Table on North America - Market size and forecast 2023-2028 ($ billion)
- Chart on North America - Year-over-year growth 2023-2028 (%)
- Data Table on North America - Year-over-year growth 2023-2028 (%)
- 9.6 Middle East and Africa - Market size and forecast 2023-2028
- Chart on Middle East and Africa - Market size and forecast 2023-2028 ($ billion)
- Data Table on Middle East and Africa - Market size and forecast 2023-2028 ($ billion)
- Chart on Middle East and Africa - Year-over-year growth 2023-2028 (%)
- Data Table on Middle East and Africa - Year-over-year growth 2023-2028 (%)
- 9.7 South America - Market size and forecast 2023-2028
- Chart on South America - Market size and forecast 2023-2028 ($ billion)
- Data Table on South America - Market size and forecast 2023-2028 ($ billion)
- Chart on South America - Year-over-year growth 2023-2028 (%)
- Data Table on South America - Year-over-year growth 2023-2028 (%)
- 9.8 China - Market size and forecast 2023-2028
- Chart on China - Market size and forecast 2023-2028 ($ billion)
- Data Table on China - Market size and forecast 2023-2028 ($ billion)
- Chart on China - Year-over-year growth 2023-2028 (%)
- Data Table on China - Year-over-year growth 2023-2028 (%)
- 9.9 US - Market size and forecast 2023-2028
- Chart on US - Market size and forecast 2023-2028 ($ billion)
- Data Table on US - Market size and forecast 2023-2028 ($ billion)
- Chart on US - Year-over-year growth 2023-2028 (%)
- Data Table on US - Year-over-year growth 2023-2028 (%)
- 9.10 Russia - Market size and forecast 2023-2028
- Chart on Russia - Market size and forecast 2023-2028 ($ billion)
- Data Table on Russia - Market size and forecast 2023-2028 ($ billion)
- Chart on Russia - Year-over-year growth 2023-2028 (%)
- Data Table on Russia - Year-over-year growth 2023-2028 (%)
- 9.11 United Arab Emirates - Market size and forecast 2023-2028
- Chart on United Arab Emirates - Market size and forecast 2023-2028 ($ billion)
- Data Table on United Arab Emirates - Market size and forecast 2023-2028 ($ billion)
- Chart on United Arab Emirates - Year-over-year growth 2023-2028 (%)
- Data Table on United Arab Emirates - Year-over-year growth 2023-2028 (%)
- 9.12 Canada - Market size and forecast 2023-2028
- Chart on Canada - Market size and forecast 2023-2028 ($ billion)
- Data Table on Canada - Market size and forecast 2023-2028 ($ billion)
- Chart on Canada - Year-over-year growth 2023-2028 (%)
- Data Table on Canada - Year-over-year growth 2023-2028 (%)
- 9.13 Market opportunity By Geographical Landscape
- Market opportunity By Geographical Landscape ($ billion)
- Data Tables on Market opportunity By Geographical Landscape ($ billion)
10 Drivers, Challenges, and Opportunity/Restraints
- 10.1 Market drivers
- 10.2 Market challenges
- 10.3 Impact of drivers and challenges
- Impact of drivers and challenges in 2023 and 2028
- 10.4 Market opportunities/restraints
11 Competitive Landscape
- 11.1 Overview
- 11.2 Competitive Landscape
- Overview on criticality of inputs and factors of differentiation
- 11.3 Landscape disruption
- Overview on factors of disruption
- 11.4 Industry risks
- Impact of key risks on business
12 Competitive Analysis
- 12.1 Companies profiled
- Companies covered
- 12.2 Market positioning of companies
- Matrix on companies position and classification
- 12.3 ABB Ltd.
- ABB Ltd. - Overview
- ABB Ltd. - Business segments
- ABB Ltd. - Key news
- ABB Ltd. - Key offerings
- ABB Ltd. - Segment focus
- 12.4 Aker Solutions ASA
- Aker Solutions ASA - Overview
- Aker Solutions ASA - Business segments
- Aker Solutions ASA - Key news
- Aker Solutions ASA - Key offerings
- Aker Solutions ASA - Segment focus
- 12.5 ArcelorMittal SA
- ArcelorMittal SA - Overview
- ArcelorMittal SA - Business segments
- ArcelorMittal SA - Key news
- ArcelorMittal SA - Key offerings
- ArcelorMittal SA - Segment focus
- 12.6 Baker Hughes Co.
- Baker Hughes Co. - Overview
- Baker Hughes Co. - Business segments
- Baker Hughes Co. - Key news
- Baker Hughes Co. - Key offerings
- Baker Hughes Co. - Segment focus
- 12.7 Dril Quip Inc.
- Dril Quip Inc. - Overview
- Dril Quip Inc. - Business segments
- Dril Quip Inc. - Key news
- Dril Quip Inc. - Key offerings
- Dril Quip Inc. - Segment focus
- 12.8 Havfram
- Havfram - Overview
- Havfram - Product / Service
- Havfram - Key offerings
- 12.9 Kongsberg Gruppen ASA
- Kongsberg Gruppen ASA - Overview
- Kongsberg Gruppen ASA - Business segments
- Kongsberg Gruppen ASA - Key news
- Kongsberg Gruppen ASA - Key offerings
- Kongsberg Gruppen ASA - Segment focus
- 12.10 McDermott International Ltd.
- McDermott International Ltd. - Overview
- McDermott International Ltd. - Product / Service
- McDermott International Ltd. - Key offerings
- 12.11 Nexans SA
- Nexans SA - Overview
- Nexans SA - Business segments
- Nexans SA - Key news
- Nexans SA - Key offerings
- Nexans SA - Segment focus
- 12.12 NOV Inc.
- NOV Inc. - Overview
- NOV Inc. - Business segments
- NOV Inc. - Key news
- NOV Inc. - Key offerings
- NOV Inc. - Segment focus
- 12.13 Oceaneering International Inc.
- Oceaneering International Inc. - Overview
- Oceaneering International Inc. - Product / Service
- Oceaneering International Inc. - Key offerings
- 12.14 Prysmian Spa
- Prysmian Spa - Overview
- Prysmian Spa - Business segments
- Prysmian Spa - Key news
- Prysmian Spa - Key offerings
- Prysmian Spa - Segment focus
- 12.15 Saipem S.p.A.
- Saipem S.p.A. - Overview
- Saipem S.p.A. - Business segments
- Saipem S.p.A. - Key offerings
- Saipem S.p.A. - Segment focus
- 12.16 Schlumberger Ltd.
- Schlumberger Ltd. - Overview
- Schlumberger Ltd. - Business segments
- Schlumberger Ltd. - Key news
- Schlumberger Ltd. - Key offerings
- Schlumberger Ltd. - Segment focus
- 12.17 TechnipFMC plc
- TechnipFMC plc - Overview
- TechnipFMC plc - Business segments
- TechnipFMC plc - Key news
- TechnipFMC plc - Key offerings
- TechnipFMC plc - Segment focus
13 Appendix
- 13.1 Scope of the report
- 13.2 Inclusions and exclusions checklist
- Inclusions checklist
- Exclusions checklist
- 13.3 Currency conversion rates for US$
- Currency conversion rates for US$
- 13.4 Research methodology
- Research methodology
- 13.5 Data procurement
- Information sources
- 13.6 Data validation
- Data validation
- 13.7 Validation techniques employed for market sizing
- Validation techniques employed for market sizing
- 13.8 Data synthesis
- Data synthesis
- 13.9 360 degree market analysis
- 360 degree market analysis
- 13.10 List of abbreviations
- List of abbreviations

