|
|
市場調査レポート
商品コード
1525068
ヒアルロン酸の世界市場 2024-2028Global hyaluronic acid market 2024-2028 |
||||||
|
|||||||
カスタマイズ可能
|
|||||||


| ヒアルロン酸の世界市場 2024-2028 |
|
出版日: 2024年05月20日
発行: TechNavio
ページ情報: 英文 180 Pages
納期: 即納可能
|

全表示
- 概要
- 図表
- 目次
ヒアルロン酸市場は2023-2028年に44億6,280万米ドル、予測期間中のCAGRは8.09%で成長すると予測されます。
当レポートでは、ヒアルロン酸市場の全体的な分析、市場規模・予測、動向、成長促進要因、課題、約25のベンダーを網羅したベンダー分析などを掲載しています。
現在の市場シナリオ、最新動向と促進要因、市場環境全体に関する最新分析を提供しています。同市場は、最小限のモニタリングで済む安全で安定した薬剤へのニーズ、非外科的美容施術への需要の高まり、化粧品におけるヒアルロン酸分子のデリバリーシステムの進歩によって牽引されています。
| 市場範囲 | |
|---|---|
| 基準年 | 2024 |
| 終了年 | 2028 |
| 予測期間 | 2024-2028 |
| 成長モメンタム | 加速 |
| 前年比2024年 | 7.32% |
| CAGR | 8.09% |
| 増分額 | 44億6,280万米ドル |
本調査では、今後数年間のヒアルロン酸市場成長を牽引する主な要因の一つとして、市場ベンダーによる買収や合弁事業の増加を挙げています。また、ハイブリッドおよび多機能ヒアルロン酸製剤の台頭、ヒアルロン酸サプリメントおよび栄養化粧品の市場開発は、市場の大きな需要につながります。
目次
第1章 エグゼクティブサマリー
- 市場概要
第2章 市場情勢
- 市場エコシステム
- 市場の特徴
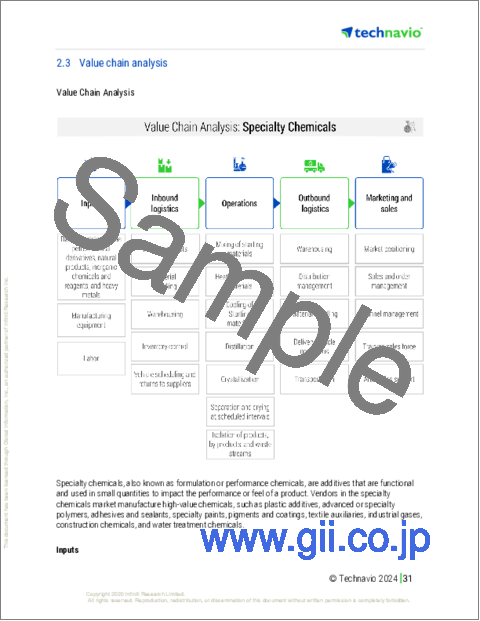
- バリューチェーン分析
第3章 市場規模の評価
- 市場の定義
- 市場セグメント分析
- 市場規模 2023
- 市場の見通し 2023-2028
第4章 市場規模実績
- 世界ヒアルロン酸市場 2018-2022
- 用途別セグメント分析 2018-2022
- エンドユーザー別セグメント分析 2018-2022
- 地域別セグメント分析 2018-2022
- 国別セグメント分析 2018-2022
第5章 ファイブフォース分析
- ファイブフォースの要約
- 買い手の交渉力
- 供給企業の交渉力
- 新規参入業者の脅威
- 代替品の脅威
- 競争の脅威
- 市況
第6章 市場セグメンテーション:用途別
- 市場セグメンテーション
- 比較:用途別
- 皮膚充填剤:市場規模と予測 2023-2028
- 変形性関節症:市場規模と予測 2023-2028
- 眼科:市場規模と予測 2023-2028
- 膀胱尿管逆流症:市場規模と予測 2023-2028
- 市場機会:用途別
第7章 市場セグメンテーション:エンドユーザー別
- 市場セグメンテーション
- 比較:エンドユーザー別
- 製薬業界:市場規模と予測 2023-2028
- 化粧品業界:市場規模と予測 2023-2028
- 市場機会:エンドユーザー別
第8章 顧客情勢
- 顧客情勢の概要
第9章 地域別情勢
- 地域別セグメンテーション
- 地域別比較
- 北米:市場規模と予測 2023-2028
- アジア太平洋:市場規模と予測 2023-2028
- 欧州:市場規模と予測 2023-2028
- 中東・アフリカ:市場規模と予測 2023-2028
- 南米:市場規模と予測 2023-2028
- 米国:市場規模と予測 2023-2028
- カナダ:市場規模と予測 2023-2028
- 中国:市場規模と予測 2023-2028
- 韓国:市場規模と予測 2023-2028
- ドイツ:市場規模と予測 2023-2028
- 市場機会:地域情勢別
第10章 促進要因・課題・機会・抑制要因
- 市場促進要因
- 市場の課題
- 促進要因と課題の影響
- 市場の機会・抑制要因
第11章 競合情勢
- 概要
- 競合情勢
- 混乱の状況
- 業界のリスク
第12章 競合分析
- 企業プロファイル
- 企業の市場ポジショニング
- AbbVie Inc.
- Abdi Ibrahim Ilac Sanayi ve Tic A.S.
- Anika Therapeutics Inc.
- Bausch Health Companies Inc.
- Bioxis Pharmaceutical
- Bloomage Biotech Co. Ltd.
- Ferring BV
- Fidia Farmaceutici Spa
- Galderma SA
- LG Chem Ltd.
- Merz Pharma GmbH and Co KGaA
- Sanofi SA
- Smith and Nephew plc
- Teva Pharmaceutical Industries Ltd.
- Zimmer Biomet Holdings Inc.
第13章 付録
Exhibits:
- Exhibits1: Executive Summary - Chart on Market Overview
- Exhibits2: Executive Summary - Data Table on Market Overview
- Exhibits3: Executive Summary - Chart on Global Market Characteristics
- Exhibits4: Executive Summary - Chart on Market By Geographical Landscape
- Exhibits5: Executive Summary - Chart on Market Segmentation by Application
- Exhibits6: Executive Summary - Chart on Market Segmentation by End-user
- Exhibits7: Executive Summary - Chart on Incremental Growth
- Exhibits8: Executive Summary - Data Table on Incremental Growth
- Exhibits9: Executive Summary - Chart on Company Market Positioning
- Exhibits10: Parent Market
- Exhibits11: Data Table on - Parent Market
- Exhibits12: Market characteristics analysis
- Exhibits13: Value Chain Analysis
- Exhibits14: Offerings of companies included in the market definition
- Exhibits15: Market segments
- Exhibits16: Chart on Global - Market size and forecast 2023-2028 ($ million)
- Exhibits17: Data Table on Global - Market size and forecast 2023-2028 ($ million)
- Exhibits18: Chart on Global Market: Year-over-year growth 2023-2028 (%)
- Exhibits19: Data Table on Global Market: Year-over-year growth 2023-2028 (%)
- Exhibits20: Historic Market Size - Data Table on Global Hyaluronic Acid Market 2018 - 2022 ($ million)
- Exhibits21: Historic Market Size - Application Segment 2018 - 2022 ($ million)
- Exhibits22: Historic Market Size - End-user Segment 2018 - 2022 ($ million)
- Exhibits23: Historic Market Size - Geography Segment 2018 - 2022 ($ million)
- Exhibits24: Historic Market Size - Country Segment 2018 - 2022 ($ million)
- Exhibits25: Five forces analysis - Comparison between 2023 and 2028
- Exhibits26: Bargaining power of buyers - Impact of key factors 2023 and 2028
- Exhibits27: Bargaining power of suppliers - Impact of key factors in 2023 and 2028
- Exhibits28: Threat of new entrants - Impact of key factors in 2023 and 2028
- Exhibits29: Threat of substitutes - Impact of key factors in 2023 and 2028
- Exhibits30: Threat of rivalry - Impact of key factors in 2023 and 2028
- Exhibits31: Chart on Market condition - Five forces 2023 and 2028
- Exhibits32: Chart on Application - Market share 2023-2028 (%)
- Exhibits33: Data Table on Application - Market share 2023-2028 (%)
- Exhibits34: Chart on Comparison by Application
- Exhibits35: Data Table on Comparison by Application
- Exhibits36: Chart on Dermal fillers - Market size and forecast 2023-2028 ($ million)
- Exhibits37: Data Table on Dermal fillers - Market size and forecast 2023-2028 ($ million)
- Exhibits38: Chart on Dermal fillers - Year-over-year growth 2023-2028 (%)
- Exhibits39: Data Table on Dermal fillers - Year-over-year growth 2023-2028 (%)
- Exhibits40: Chart on Osteoarthritis - Market size and forecast 2023-2028 ($ million)
- Exhibits41: Data Table on Osteoarthritis - Market size and forecast 2023-2028 ($ million)
- Exhibits42: Chart on Osteoarthritis - Year-over-year growth 2023-2028 (%)
- Exhibits43: Data Table on Osteoarthritis - Year-over-year growth 2023-2028 (%)
- Exhibits44: Chart on Ophthalmic - Market size and forecast 2023-2028 ($ million)
- Exhibits45: Data Table on Ophthalmic - Market size and forecast 2023-2028 ($ million)
- Exhibits46: Chart on Ophthalmic - Year-over-year growth 2023-2028 (%)
- Exhibits47: Data Table on Ophthalmic - Year-over-year growth 2023-2028 (%)
- Exhibits48: Chart on Vesicoureteral reflux - Market size and forecast 2023-2028 ($ million)
- Exhibits49: Data Table on Vesicoureteral reflux - Market size and forecast 2023-2028 ($ million)
- Exhibits50: Chart on Vesicoureteral reflux - Year-over-year growth 2023-2028 (%)
- Exhibits51: Data Table on Vesicoureteral reflux - Year-over-year growth 2023-2028 (%)
- Exhibits52: Market opportunity by Application ($ million)
- Exhibits53: Data Table on Market opportunity by Application ($ million)
- Exhibits54: Chart on End-user - Market share 2023-2028 (%)
- Exhibits55: Data Table on End-user - Market share 2023-2028 (%)
- Exhibits56: Chart on Comparison by End-user
- Exhibits57: Data Table on Comparison by End-user
- Exhibits58: Chart on Pharmaceutical industry - Market size and forecast 2023-2028 ($ million)
- Exhibits59: Data Table on Pharmaceutical industry - Market size and forecast 2023-2028 ($ million)
- Exhibits60: Chart on Pharmaceutical industry - Year-over-year growth 2023-2028 (%)
- Exhibits61: Data Table on Pharmaceutical industry - Year-over-year growth 2023-2028 (%)
- Exhibits62: Chart on Cosmetic industry - Market size and forecast 2023-2028 ($ million)
- Exhibits63: Data Table on Cosmetic industry - Market size and forecast 2023-2028 ($ million)
- Exhibits64: Chart on Cosmetic industry - Year-over-year growth 2023-2028 (%)
- Exhibits65: Data Table on Cosmetic industry - Year-over-year growth 2023-2028 (%)
- Exhibits66: Market opportunity by End-user ($ million)
- Exhibits67: Data Table on Market opportunity by End-user ($ million)
- Exhibits68: Analysis of price sensitivity, lifecycle, customer purchase basket, adoption rates, and purchase criteria
- Exhibits69: Chart on Market share By Geographical Landscape 2023-2028 (%)
- Exhibits70: Data Table on Market share By Geographical Landscape 2023-2028 (%)
- Exhibits71: Chart on Geographic comparison
- Exhibits72: Data Table on Geographic comparison
- Exhibits73: Chart on North America - Market size and forecast 2023-2028 ($ million)
- Exhibits74: Data Table on North America - Market size and forecast 2023-2028 ($ million)
- Exhibits75: Chart on North America - Year-over-year growth 2023-2028 (%)
- Exhibits76: Data Table on North America - Year-over-year growth 2023-2028 (%)
- Exhibits77: Chart on APAC - Market size and forecast 2023-2028 ($ million)
- Exhibits78: Data Table on APAC - Market size and forecast 2023-2028 ($ million)
- Exhibits79: Chart on APAC - Year-over-year growth 2023-2028 (%)
- Exhibits80: Data Table on APAC - Year-over-year growth 2023-2028 (%)
- Exhibits81: Chart on Europe - Market size and forecast 2023-2028 ($ million)
- Exhibits82: Data Table on Europe - Market size and forecast 2023-2028 ($ million)
- Exhibits83: Chart on Europe - Year-over-year growth 2023-2028 (%)
- Exhibits84: Data Table on Europe - Year-over-year growth 2023-2028 (%)
- Exhibits85: Chart on Middle East and Africa - Market size and forecast 2023-2028 ($ million)
- Exhibits86: Data Table on Middle East and Africa - Market size and forecast 2023-2028 ($ million)
- Exhibits87: Chart on Middle East and Africa - Year-over-year growth 2023-2028 (%)
- Exhibits88: Data Table on Middle East and Africa - Year-over-year growth 2023-2028 (%)
- Exhibits89: Chart on South America - Market size and forecast 2023-2028 ($ million)
- Exhibits90: Data Table on South America - Market size and forecast 2023-2028 ($ million)
- Exhibits91: Chart on South America - Year-over-year growth 2023-2028 (%)
- Exhibits92: Data Table on South America - Year-over-year growth 2023-2028 (%)
- Exhibits93: Chart on US - Market size and forecast 2023-2028 ($ million)
- Exhibits94: Data Table on US - Market size and forecast 2023-2028 ($ million)
- Exhibits95: Chart on US - Year-over-year growth 2023-2028 (%)
- Exhibits96: Data Table on US - Year-over-year growth 2023-2028 (%)
- Exhibits97: Chart on Canada - Market size and forecast 2023-2028 ($ million)
- Exhibits98: Data Table on Canada - Market size and forecast 2023-2028 ($ million)
- Exhibits99: Chart on Canada - Year-over-year growth 2023-2028 (%)
- Exhibits100: Data Table on Canada - Year-over-year growth 2023-2028 (%)
- Exhibits101: Chart on China - Market size and forecast 2023-2028 ($ million)
- Exhibits102: Data Table on China - Market size and forecast 2023-2028 ($ million)
- Exhibits103: Chart on China - Year-over-year growth 2023-2028 (%)
- Exhibits104: Data Table on China - Year-over-year growth 2023-2028 (%)
- Exhibits105: Chart on South Korea - Market size and forecast 2023-2028 ($ million)
- Exhibits106: Data Table on South Korea - Market size and forecast 2023-2028 ($ million)
- Exhibits107: Chart on South Korea - Year-over-year growth 2023-2028 (%)
- Exhibits108: Data Table on South Korea - Year-over-year growth 2023-2028 (%)
- Exhibits109: Chart on Germany - Market size and forecast 2023-2028 ($ million)
- Exhibits110: Data Table on Germany - Market size and forecast 2023-2028 ($ million)
- Exhibits111: Chart on Germany - Year-over-year growth 2023-2028 (%)
- Exhibits112: Data Table on Germany - Year-over-year growth 2023-2028 (%)
- Exhibits113: Market opportunity By Geographical Landscape ($ million)
- Exhibits114: Data Tables on Market opportunity By Geographical Landscape ($ million)
- Exhibits115: Impact of drivers and challenges in 2023 and 2028
- Exhibits116: Overview on criticality of inputs and factors of differentiation
- Exhibits117: Overview on factors of disruption
- Exhibits118: Impact of key risks on business
- Exhibits119: Companies covered
- Exhibits120: Matrix on companies position and classification
- Exhibits121: AbbVie Inc. - Overview
- Exhibits122: AbbVie Inc. - Product / Service
- Exhibits123: AbbVie Inc. - Key news
- Exhibits124: AbbVie Inc. - Key offerings
- Exhibits125: Abdi Ibrahim Ilac Sanayi ve Tic A.S. - Overview
- Exhibits126: Abdi Ibrahim Ilac Sanayi ve Tic A.S. - Product / Service
- Exhibits127: Abdi Ibrahim Ilac Sanayi ve Tic A.S. - Key offerings
- Exhibits128: Anika Therapeutics Inc. - Overview
- Exhibits129: Anika Therapeutics Inc. - Product / Service
- Exhibits130: Anika Therapeutics Inc. - Key offerings
- Exhibits131: Bausch Health Companies Inc. - Overview
- Exhibits132: Bausch Health Companies Inc. - Business segments
- Exhibits133: Bausch Health Companies Inc. - Key news
- Exhibits134: Bausch Health Companies Inc. - Key offerings
- Exhibits135: Bausch Health Companies Inc. - Segment focus
- Exhibits136: Bioxis Pharmaceutical - Overview
- Exhibits137: Bioxis Pharmaceutical - Product / Service
- Exhibits138: Bioxis Pharmaceutical - Key offerings
- Exhibits139: Bloomage Biotech Co. Ltd. - Overview
- Exhibits140: Bloomage Biotech Co. Ltd. - Product / Service
- Exhibits141: Bloomage Biotech Co. Ltd. - Key offerings
- Exhibits142: Ferring BV - Overview
- Exhibits143: Ferring BV - Product / Service
- Exhibits144: Ferring BV - Key offerings
- Exhibits145: Fidia Farmaceutici Spa - Overview
- Exhibits146: Fidia Farmaceutici Spa - Product / Service
- Exhibits147: Fidia Farmaceutici Spa - Key offerings
- Exhibits148: Galderma SA - Overview
- Exhibits149: Galderma SA - Product / Service
- Exhibits150: Galderma SA - Key offerings
- Exhibits151: LG Chem Ltd. - Overview
- Exhibits152: LG Chem Ltd. - Business segments
- Exhibits153: LG Chem Ltd. - Key news
- Exhibits154: LG Chem Ltd. - Key offerings
- Exhibits155: LG Chem Ltd. - Segment focus
- Exhibits156: Merz Pharma GmbH and Co KGaA - Overview
- Exhibits157: Merz Pharma GmbH and Co KGaA - Product / Service
- Exhibits158: Merz Pharma GmbH and Co KGaA - Key offerings
- Exhibits159: Sanofi SA - Overview
- Exhibits160: Sanofi SA - Business segments
- Exhibits161: Sanofi SA - Key news
- Exhibits162: Sanofi SA - Key offerings
- Exhibits163: Sanofi SA - Segment focus
- Exhibits164: Smith and Nephew plc - Overview
- Exhibits165: Smith and Nephew plc - Business segments
- Exhibits166: Smith and Nephew plc - Key news
- Exhibits167: Smith and Nephew plc - Key offerings
- Exhibits168: Smith and Nephew plc - Segment focus
- Exhibits169: Teva Pharmaceutical Industries Ltd. - Overview
- Exhibits170: Teva Pharmaceutical Industries Ltd. - Business segments
- Exhibits171: Teva Pharmaceutical Industries Ltd. - Key news
- Exhibits172: Teva Pharmaceutical Industries Ltd. - Key offerings
- Exhibits173: Teva Pharmaceutical Industries Ltd. - Segment focus
- Exhibits174: Zimmer Biomet Holdings Inc. - Overview
- Exhibits175: Zimmer Biomet Holdings Inc. - Business segments
- Exhibits176: Zimmer Biomet Holdings Inc. - Key news
- Exhibits177: Zimmer Biomet Holdings Inc. - Key offerings
- Exhibits178: Zimmer Biomet Holdings Inc. - Segment focus
- Exhibits179: Inclusions checklist
- Exhibits180: Exclusions checklist
- Exhibits181: Currency conversion rates for US$
- Exhibits182: Research methodology
- Exhibits183: Information sources
- Exhibits184: Data validation
- Exhibits185: Validation techniques employed for market sizing
- Exhibits186: Data synthesis
- Exhibits187: 360 degree market analysis
- Exhibits188: List of abbreviations
The hyaluronic acid market is forecasted to grow by USD 4462.8 mn during 2023-2028, accelerating at a CAGR of 8.09% during the forecast period. The report on the hyaluronic acid market provides a holistic analysis, market size and forecast, trends, growth drivers, and challenges, as well as vendor analysis covering around 25 vendors.
The report offers an up-to-date analysis regarding the current market scenario, the latest trends and drivers, and the overall market environment. The market is driven by need for safe and stable drugs that require minimal monitoring, rising demand for non-surgical aesthetic procedures, and advancements in delivery systems of hyaluronic acid molecules in cosmetics.
Technavio's hyaluronic acid market is segmented as below:
| Market Scope | |
|---|---|
| Base Year | 2024 |
| End Year | 2028 |
| Series Year | 2024-2028 |
| Growth Momentum | Accelerate |
| YOY 2024 | 7.32% |
| CAGR | 8.09% |
| Incremental Value | $4462.8mn |
By Application
- Dermal fillers
- Osteoarthritis
- Ophthalmic
- Vesicoureteral reflux
By End-user
- Pharmaceutical industry
- Cosmetic industry
By Geographical Landscape
- North America
- APAC
- Europe
- Middle East and Africa
- South America
This study identifies the increasing acquisitions and joint ventures by market vendors as one of the prime reasons driving the hyaluronic acid market growth during the next few years. Also, rise of hybrid and multifunctional hyaluronic acid formulations and development of hyaluronic acid supplements and nutricosmetic products will lead to sizable demand in the market.
The report on the hyaluronic acid market covers the following areas:
- Hyaluronic acid market sizing
- Hyaluronic acid market forecast
- Hyaluronic acid market industry analysis
The robust vendor analysis is designed to help clients improve their market position, and in line with this, this report provides a detailed analysis of several leading hyaluronic acid market vendors that include AbbVie Inc., Abdi Ibrahim Ilac Sanayi ve Tic A.S., Anika Therapeutics Inc., Bausch Health Companies Inc., Bio plus Co. Ltd., BioScience GmbH Cosmetics Trading LLC, Bioxis Pharmaceutical, Bloomage Biotech Co. Ltd., Ferring BV, Fidia Farmaceutici Spa, Galderma SA, Huadong Medicine Co. Ltd., Laboratoires VIVACY, LG Chem Ltd., Merz Pharma GmbH and Co KGaA, Sanofi SA, SEIKAGAKU CORP., Smith and Nephew plc, Syrhatech, Teva Pharmaceutical Industries Ltd., and Zimmer Biomet Holdings Inc.. Also, the hyaluronic acid market analysis report includes information on upcoming trends and challenges that will influence market growth. This is to help companies strategize and leverage all forthcoming growth opportunities.
The study was conducted using an objective combination of primary and secondary information including inputs from key participants in the industry. The report contains a comprehensive market and vendor landscape in addition to an analysis of the key vendors.
The publisher presents a detailed picture of the market by the way of study, synthesis, and summation of data from multiple sources by an analysis of key parameters such as profit, pricing, competition, and promotions. It presents various market facets by identifying the key industry influencers. The data presented is comprehensive, reliable, and a result of extensive research - both primary and secondary. The market research reports provide a complete competitive landscape and an in-depth vendor selection methodology and analysis using qualitative and quantitative research to forecast the accurate market growth.
Table of Contents
1 Executive Summary
- 1.1 Market overview
- Executive Summary - Chart on Market Overview
- Executive Summary - Data Table on Market Overview
- Executive Summary - Chart on Global Market Characteristics
- Executive Summary - Chart on Market By Geographical Landscape
- Executive Summary - Chart on Market Segmentation by Application
- Executive Summary - Chart on Market Segmentation by End-user
- Executive Summary - Chart on Incremental Growth
- Executive Summary - Data Table on Incremental Growth
- Executive Summary - Chart on Company Market Positioning
2 Market Landscape
- 2.1 Market ecosystem
- Parent Market
- Data Table on - Parent Market
- 2.2 Market characteristics
- Market characteristics analysis
- 2.3 Value chain analysis
- Value Chain Analysis
3 Market Sizing
- 3.1 Market definition
- Offerings of companies included in the market definition
- 3.2 Market segment analysis
- Market segments
- 3.3 Market size 2023
- 3.4 Market outlook: Forecast for 2023-2028
- Chart on Global - Market size and forecast 2023-2028 ($ million)
- Data Table on Global - Market size and forecast 2023-2028 ($ million)
- Chart on Global Market: Year-over-year growth 2023-2028 (%)
- Data Table on Global Market: Year-over-year growth 2023-2028 (%)
4 Historic Market Size
- 4.1 Global Hyaluronic Acid Market 2018 - 2022
- Historic Market Size - Data Table on Global Hyaluronic Acid Market 2018 - 2022 ($ million)
- 4.2 Application segment analysis 2018 - 2022
- Historic Market Size - Application Segment 2018 - 2022 ($ million)
- 4.3 End-user segment analysis 2018 - 2022
- Historic Market Size - End-user Segment 2018 - 2022 ($ million)
- 4.4 Geography segment analysis 2018 - 2022
- Historic Market Size - Geography Segment 2018 - 2022 ($ million)
- 4.5 Country segment analysis 2018 - 2022
- Historic Market Size - Country Segment 2018 - 2022 ($ million)
5 Five Forces Analysis
- 5.1 Five forces summary
- Five forces analysis - Comparison between 2023 and 2028
- 5.2 Bargaining power of buyers
- Bargaining power of buyers - Impact of key factors 2023 and 2028
- 5.3 Bargaining power of suppliers
- Bargaining power of suppliers - Impact of key factors in 2023 and 2028
- 5.4 Threat of new entrants
- Threat of new entrants - Impact of key factors in 2023 and 2028
- 5.5 Threat of substitutes
- Threat of substitutes - Impact of key factors in 2023 and 2028
- 5.6 Threat of rivalry
- Threat of rivalry - Impact of key factors in 2023 and 2028
- 5.7 Market condition
- Chart on Market condition - Five forces 2023 and 2028
6 Market Segmentation by Application
- 6.1 Market segments
- Chart on Application - Market share 2023-2028 (%)
- Data Table on Application - Market share 2023-2028 (%)
- 6.2 Comparison by Application
- Chart on Comparison by Application
- Data Table on Comparison by Application
- 6.3 Dermal fillers - Market size and forecast 2023-2028
- Chart on Dermal fillers - Market size and forecast 2023-2028 ($ million)
- Data Table on Dermal fillers - Market size and forecast 2023-2028 ($ million)
- Chart on Dermal fillers - Year-over-year growth 2023-2028 (%)
- Data Table on Dermal fillers - Year-over-year growth 2023-2028 (%)
- 6.4 Osteoarthritis - Market size and forecast 2023-2028
- Chart on Osteoarthritis - Market size and forecast 2023-2028 ($ million)
- Data Table on Osteoarthritis - Market size and forecast 2023-2028 ($ million)
- Chart on Osteoarthritis - Year-over-year growth 2023-2028 (%)
- Data Table on Osteoarthritis - Year-over-year growth 2023-2028 (%)
- 6.5 Ophthalmic - Market size and forecast 2023-2028
- Chart on Ophthalmic - Market size and forecast 2023-2028 ($ million)
- Data Table on Ophthalmic - Market size and forecast 2023-2028 ($ million)
- Chart on Ophthalmic - Year-over-year growth 2023-2028 (%)
- Data Table on Ophthalmic - Year-over-year growth 2023-2028 (%)
- 6.6 Vesicoureteral reflux - Market size and forecast 2023-2028
- Chart on Vesicoureteral reflux - Market size and forecast 2023-2028 ($ million)
- Data Table on Vesicoureteral reflux - Market size and forecast 2023-2028 ($ million)
- Chart on Vesicoureteral reflux - Year-over-year growth 2023-2028 (%)
- Data Table on Vesicoureteral reflux - Year-over-year growth 2023-2028 (%)
- 6.7 Market opportunity by Application
- Market opportunity by Application ($ million)
- Data Table on Market opportunity by Application ($ million)
7 Market Segmentation by End-user
- 7.1 Market segments
- Chart on End-user - Market share 2023-2028 (%)
- Data Table on End-user - Market share 2023-2028 (%)
- 7.2 Comparison by End-user
- Chart on Comparison by End-user
- Data Table on Comparison by End-user
- 7.3 Pharmaceutical industry - Market size and forecast 2023-2028
- Chart on Pharmaceutical industry - Market size and forecast 2023-2028 ($ million)
- Data Table on Pharmaceutical industry - Market size and forecast 2023-2028 ($ million)
- Chart on Pharmaceutical industry - Year-over-year growth 2023-2028 (%)
- Data Table on Pharmaceutical industry - Year-over-year growth 2023-2028 (%)
- 7.4 Cosmetic industry - Market size and forecast 2023-2028
- Chart on Cosmetic industry - Market size and forecast 2023-2028 ($ million)
- Data Table on Cosmetic industry - Market size and forecast 2023-2028 ($ million)
- Chart on Cosmetic industry - Year-over-year growth 2023-2028 (%)
- Data Table on Cosmetic industry - Year-over-year growth 2023-2028 (%)
- 7.5 Market opportunity by End-user
- Market opportunity by End-user ($ million)
- Data Table on Market opportunity by End-user ($ million)
8 Customer Landscape
- 8.1 Customer landscape overview
- Analysis of price sensitivity, lifecycle, customer purchase basket, adoption rates, and purchase criteria
9 Geographic Landscape
- 9.1 Geographic segmentation
- Chart on Market share By Geographical Landscape 2023-2028 (%)
- Data Table on Market share By Geographical Landscape 2023-2028 (%)
- 9.2 Geographic comparison
- Chart on Geographic comparison
- Data Table on Geographic comparison
- 9.3 North America - Market size and forecast 2023-2028
- Chart on North America - Market size and forecast 2023-2028 ($ million)
- Data Table on North America - Market size and forecast 2023-2028 ($ million)
- Chart on North America - Year-over-year growth 2023-2028 (%)
- Data Table on North America - Year-over-year growth 2023-2028 (%)
- 9.4 APAC - Market size and forecast 2023-2028
- Chart on APAC - Market size and forecast 2023-2028 ($ million)
- Data Table on APAC - Market size and forecast 2023-2028 ($ million)
- Chart on APAC - Year-over-year growth 2023-2028 (%)
- Data Table on APAC - Year-over-year growth 2023-2028 (%)
- 9.5 Europe - Market size and forecast 2023-2028
- Chart on Europe - Market size and forecast 2023-2028 ($ million)
- Data Table on Europe - Market size and forecast 2023-2028 ($ million)
- Chart on Europe - Year-over-year growth 2023-2028 (%)
- Data Table on Europe - Year-over-year growth 2023-2028 (%)
- 9.6 Middle East and Africa - Market size and forecast 2023-2028
- Chart on Middle East and Africa - Market size and forecast 2023-2028 ($ million)
- Data Table on Middle East and Africa - Market size and forecast 2023-2028 ($ million)
- Chart on Middle East and Africa - Year-over-year growth 2023-2028 (%)
- Data Table on Middle East and Africa - Year-over-year growth 2023-2028 (%)
- 9.7 South America - Market size and forecast 2023-2028
- Chart on South America - Market size and forecast 2023-2028 ($ million)
- Data Table on South America - Market size and forecast 2023-2028 ($ million)
- Chart on South America - Year-over-year growth 2023-2028 (%)
- Data Table on South America - Year-over-year growth 2023-2028 (%)
- 9.8 US - Market size and forecast 2023-2028
- Chart on US - Market size and forecast 2023-2028 ($ million)
- Data Table on US - Market size and forecast 2023-2028 ($ million)
- Chart on US - Year-over-year growth 2023-2028 (%)
- Data Table on US - Year-over-year growth 2023-2028 (%)
- 9.9 Canada - Market size and forecast 2023-2028
- Chart on Canada - Market size and forecast 2023-2028 ($ million)
- Data Table on Canada - Market size and forecast 2023-2028 ($ million)
- Chart on Canada - Year-over-year growth 2023-2028 (%)
- Data Table on Canada - Year-over-year growth 2023-2028 (%)
- 9.10 China - Market size and forecast 2023-2028
- Chart on China - Market size and forecast 2023-2028 ($ million)
- Data Table on China - Market size and forecast 2023-2028 ($ million)
- Chart on China - Year-over-year growth 2023-2028 (%)
- Data Table on China - Year-over-year growth 2023-2028 (%)
- 9.11 South Korea - Market size and forecast 2023-2028
- Chart on South Korea - Market size and forecast 2023-2028 ($ million)
- Data Table on South Korea - Market size and forecast 2023-2028 ($ million)
- Chart on South Korea - Year-over-year growth 2023-2028 (%)
- Data Table on South Korea - Year-over-year growth 2023-2028 (%)
- 9.12 Germany - Market size and forecast 2023-2028
- Chart on Germany - Market size and forecast 2023-2028 ($ million)
- Data Table on Germany - Market size and forecast 2023-2028 ($ million)
- Chart on Germany - Year-over-year growth 2023-2028 (%)
- Data Table on Germany - Year-over-year growth 2023-2028 (%)
- 9.13 Market opportunity By Geographical Landscape
- Market opportunity By Geographical Landscape ($ million)
- Data Tables on Market opportunity By Geographical Landscape ($ million)
10 Drivers, Challenges, and Opportunity/Restraints
- 10.1 Market drivers
- 10.2 Market challenges
- 10.3 Impact of drivers and challenges
- Impact of drivers and challenges in 2023 and 2028
- 10.4 Market opportunities/restraints
11 Competitive Landscape
- 11.1 Overview
- 11.2 Competitive Landscape
- Overview on criticality of inputs and factors of differentiation
- 11.3 Landscape disruption
- Overview on factors of disruption
- 11.4 Industry risks
- Impact of key risks on business
12 Competitive Analysis
- 12.1 Companies profiled
- Companies covered
- 12.2 Market positioning of companies
- Matrix on companies position and classification
- 12.3 AbbVie Inc.
- AbbVie Inc. - Overview
- AbbVie Inc. - Product / Service
- AbbVie Inc. - Key news
- AbbVie Inc. - Key offerings
- 12.4 Abdi Ibrahim Ilac Sanayi ve Tic A.S.
- Abdi Ibrahim Ilac Sanayi ve Tic A.S. - Overview
- Abdi Ibrahim Ilac Sanayi ve Tic A.S. - Product / Service
- Abdi Ibrahim Ilac Sanayi ve Tic A.S. - Key offerings
- 12.5 Anika Therapeutics Inc.
- Anika Therapeutics Inc. - Overview
- Anika Therapeutics Inc. - Product / Service
- Anika Therapeutics Inc. - Key offerings
- 12.6 Bausch Health Companies Inc.
- Bausch Health Companies Inc. - Overview
- Bausch Health Companies Inc. - Business segments
- Bausch Health Companies Inc. - Key news
- Bausch Health Companies Inc. - Key offerings
- Bausch Health Companies Inc. - Segment focus
- 12.7 Bioxis Pharmaceutical
- Bioxis Pharmaceutical - Overview
- Bioxis Pharmaceutical - Product / Service
- Bioxis Pharmaceutical - Key offerings
- 12.8 Bloomage Biotech Co. Ltd.
- Bloomage Biotech Co. Ltd. - Overview
- Bloomage Biotech Co. Ltd. - Product / Service
- Bloomage Biotech Co. Ltd. - Key offerings
- 12.9 Ferring BV
- Ferring BV - Overview
- Ferring BV - Product / Service
- Ferring BV - Key offerings
- 12.10 Fidia Farmaceutici Spa
- Fidia Farmaceutici Spa - Overview
- Fidia Farmaceutici Spa - Product / Service
- Fidia Farmaceutici Spa - Key offerings
- 12.11 Galderma SA
- Galderma SA - Overview
- Galderma SA - Product / Service
- Galderma SA - Key offerings
- 12.12 LG Chem Ltd.
- LG Chem Ltd. - Overview
- LG Chem Ltd. - Business segments
- LG Chem Ltd. - Key news
- LG Chem Ltd. - Key offerings
- LG Chem Ltd. - Segment focus
- 12.13 Merz Pharma GmbH and Co KGaA
- Merz Pharma GmbH and Co KGaA - Overview
- Merz Pharma GmbH and Co KGaA - Product / Service
- Merz Pharma GmbH and Co KGaA - Key offerings
- 12.14 Sanofi SA
- Sanofi SA - Overview
- Sanofi SA - Business segments
- Sanofi SA - Key news
- Sanofi SA - Key offerings
- Sanofi SA - Segment focus
- 12.15 Smith and Nephew plc
- Smith and Nephew plc - Overview
- Smith and Nephew plc - Business segments
- Smith and Nephew plc - Key news
- Smith and Nephew plc - Key offerings
- Smith and Nephew plc - Segment focus
- 12.16 Teva Pharmaceutical Industries Ltd.
- Teva Pharmaceutical Industries Ltd. - Overview
- Teva Pharmaceutical Industries Ltd. - Business segments
- Teva Pharmaceutical Industries Ltd. - Key news
- Teva Pharmaceutical Industries Ltd. - Key offerings
- Teva Pharmaceutical Industries Ltd. - Segment focus
- 12.17 Zimmer Biomet Holdings Inc.
- Zimmer Biomet Holdings Inc. - Overview
- Zimmer Biomet Holdings Inc. - Business segments
- Zimmer Biomet Holdings Inc. - Key news
- Zimmer Biomet Holdings Inc. - Key offerings
- Zimmer Biomet Holdings Inc. - Segment focus
13 Appendix
- 13.1 Scope of the report
- 13.2 Inclusions and exclusions checklist
- Inclusions checklist
- Exclusions checklist
- 13.3 Currency conversion rates for US$
- Currency conversion rates for US$
- 13.4 Research methodology
- Research methodology
- 13.5 Data procurement
- Information sources
- 13.6 Data validation
- Data validation
- 13.7 Validation techniques employed for market sizing
- Validation techniques employed for market sizing
- 13.8 Data synthesis
- Data synthesis
- 13.9 360 degree market analysis
- 360 degree market analysis
- 13.10 List of abbreviations
- List of abbreviations

