|
|
市場調査レポート
商品コード
1557732
MaaS(Microgrid-as-a-Service)の世界市場、2024~2028年Global Microgrid as A Service Market 2024-2028 |
||||||

|
|||||||
カスタマイズ可能
|
|||||||

| MaaS(Microgrid-as-a-Service)の世界市場、2024~2028年 |
|
出版日: 2024年08月02日
発行: TechNavio
ページ情報: 英文 171 Pages
納期: 即納可能
|

全表示
- 概要
- 図表
- 目次
MaaS(Microgrid-as-a-Service)市場は2023~2028年に86億5,830万米ドル、予測期間中のCAGRは16.83%で成長すると予測されています。
当レポートでは、MaaS(Microgrid-as-a-Service)市場の全体的な分析、市場規模・予測、動向、成長促進要因、課題、約25のベンダーを網羅したベンダー分析などを掲載しています。
現在の市場シナリオ、最新動向と促進要因、市場環境全体に関する最新分析を提供しています。市場は、マイクログリッドに対する需要の高まり、政府支援の増加、より良い電力システムに対するニーズの高まり、MaaS(Microgrid-as-a-Service)のいくつかの利点によって牽引されています。
| 市場範囲 | |
|---|---|
| 基準年 | 2024年 |
| 終了年 | 2028年 |
| 予測期間 | 2024~2028年 |
| 成長モメンタム | 加速 |
| 前年比[2024年] | 14.01% |
| CAGR | 16.83% |
| 増分額 | 86億5,830万米ドル |
本調査では、技術の急速な進歩が今後数年間のMaaS(Microgrid-as-a-Service)市場成長を牽引する主要要因の1つであるとしています。また、サステイナブル電力網を開発するためのモニタリングや最適化サービスに対する需要の高まりや、軍事用途でのマイクログリッド利用の拡大も、市場の大きな需要につながります。
目次
第1章 エグゼクティブサマリー
- 市場概要
第2章 市場情勢
- 市場エコシステム
- 市場の特徴
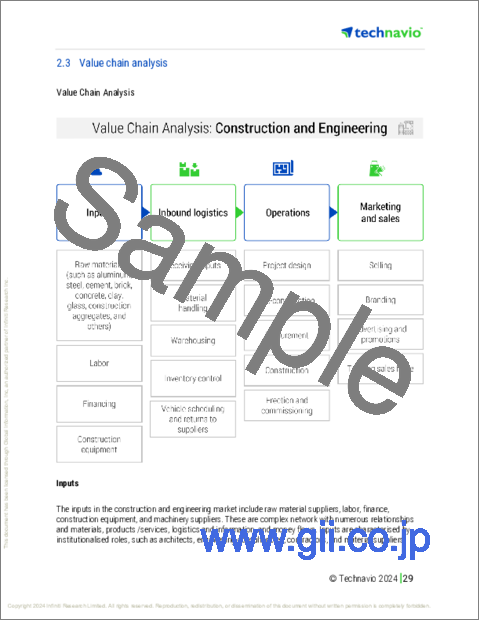
- バリューチェーン分析
第3章 市場規模の評価
- 市場の定義
- 市場セグメント分析
- 市場規模 2023年
- 市場の展望 2023~2028年
第4章 市場規模実績
- MaaS(Microgrid-as-a-Service)の世界市場 2018~2022年
- サービスタイプ別セグメント分析 2018~2022年
- タイプ別セグメント分析 2018~2022年
- 地域別セグメント分析 2018~2022年
- 国別セグメント分析 2018~2022年
第5章 ファイブフォース分析
- ファイブフォースの要約
- 買い手の交渉力
- 供給企業の交渉力
- 新規参入業者の脅威
- 代替品の脅威
- 競争の脅威
- 市況
第6章 市場セグメンテーション:サービスタイプ別
- 市場セグメンテーション
- 比較:サービスタイプ別
- SaaS(Software-as-a-Service):市場規模と予測 2023~2028年
- 監視と制御サービス:市場規模と予測 2023~2028年
- エンジニアリングと設計サービス:市場規模と予測 2023~2028年
- 市場機会:サービスタイプ別
第7章 市場セグメンテーション:タイプ別
- 市場セグメンテーション
- 比較:タイプ別
- リモート:市場規模と予測 2023~2028年
- グリッド接続:市場規模と予測 2023~2028年
- ネットワーク化:市場規模と予測 2023~2028年
- 市場機会:タイプ別
第8章 顧客情勢
- 顧客情勢概要
第9章 地域別情勢
- 地域別セグメンテーション
- 比較:地域別
- アジア太平洋:市場規模と予測 2023~2028年
- 北米:市場規模と予測 2023~2028年
- 欧州:市場規模と予測 2023~2028年
- 南米:市場規模と予測 2023~2028年
- 中東・アフリカ:市場規模と予測 2023~2028年
- 米国:市場規模と予測 2023~2028年
- 中国:市場規模と予測 2023~2028年
- 日本:市場規模と予測 2023~2028年
- インド:市場規模と予測 2023~2028年
- ドイツ:市場規模と予測 2023~2028年
- 市場機会:地域別
第10章 促進要因・課題・機会・抑制要因
- 市場促進要因
- 市場課題
- 促進要因と課題の影響
- 市場の機会・抑制要因
第11章 競合情勢
- 概要
- 競合情勢
- 混乱の状況
- 業界のリスク
第12章 競合分析
- 企業プロファイル
- 企業の市場ポジショニング
- ABB Ltd.
- Aggreko Plc
- AIO Systems Ltd.
- Anbaric Development Partners LLC
- Capstone Green Energy Corp.
- Eaton Corp. Plc
- ENGIE SA
- General Electric Co.
- NRG Energy Inc.
- Pareto Energy
- Schneider Electric SE
- Siemens AG
- Spirae LLC
- Tech Mahindra Ltd.
- Tesla Inc.
第13章 付録
Exhibits:
- Exhibits1: Executive Summary - Chart on Market Overview
- Exhibits2: Executive Summary - Data Table on Market Overview
- Exhibits3: Executive Summary - Chart on Global Market Characteristics
- Exhibits4: Executive Summary - Chart on Market by Geography
- Exhibits5: Executive Summary - Chart on Market Segmentation by Service Type
- Exhibits6: Executive Summary - Chart on Market Segmentation by Type
- Exhibits7: Executive Summary - Chart on Incremental Growth
- Exhibits8: Executive Summary - Data Table on Incremental Growth
- Exhibits9: Executive Summary - Chart on Company Market Positioning
- Exhibits10: Parent Market
- Exhibits11: Data Table on - Parent Market
- Exhibits12: Market characteristics analysis
- Exhibits13: Value Chain Analysis
- Exhibits14: Offerings of companies included in the market definition
- Exhibits15: Market segments
- Exhibits16: Chart on Global - Market size and forecast 2023-2028 ($ million)
- Exhibits17: Data Table on Global - Market size and forecast 2023-2028 ($ million)
- Exhibits18: Chart on Global Market: Year-over-year growth 2023-2028 (%)
- Exhibits19: Data Table on Global Market: Year-over-year growth 2023-2028 (%)
- Exhibits20: Historic Market Size - Data Table on Global Microgrid As A Service Market 2018 - 2022 ($ million)
- Exhibits21: Historic Market Size - Service Type Segment 2018 - 2022 ($ million)
- Exhibits22: Historic Market Size - Type Segment 2018 - 2022 ($ million)
- Exhibits23: Historic Market Size - Geography Segment 2018 - 2022 ($ million)
- Exhibits24: Historic Market Size - Country Segment 2018 - 2022 ($ million)
- Exhibits25: Five forces analysis - Comparison between 2023 and 2028
- Exhibits26: Bargaining power of buyers - Impact of key factors 2023 and 2028
- Exhibits27: Bargaining power of suppliers - Impact of key factors in 2023 and 2028
- Exhibits28: Threat of new entrants - Impact of key factors in 2023 and 2028
- Exhibits29: Threat of substitutes - Impact of key factors in 2023 and 2028
- Exhibits30: Threat of rivalry - Impact of key factors in 2023 and 2028
- Exhibits31: Chart on Market condition - Five forces 2023 and 2028
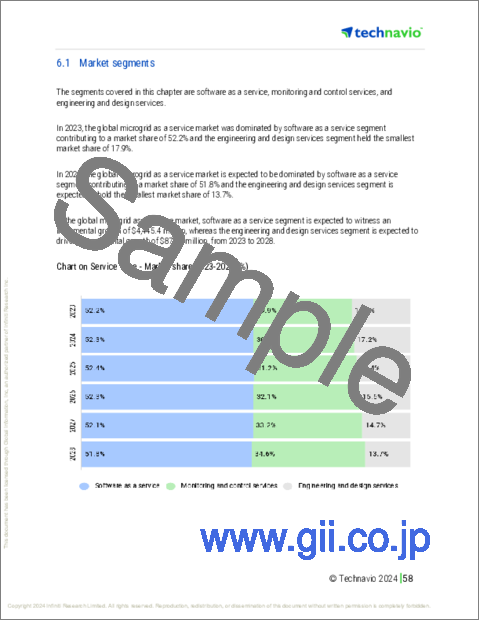
- Exhibits32: Chart on Service Type - Market share 2023-2028 (%)
- Exhibits33: Data Table on Service Type - Market share 2023-2028 (%)
- Exhibits34: Chart on Comparison by Service Type
- Exhibits35: Data Table on Comparison by Service Type
- Exhibits36: Chart on Software as a service - Market size and forecast 2023-2028 ($ million)
- Exhibits37: Data Table on Software as a service - Market size and forecast 2023-2028 ($ million)
- Exhibits38: Chart on Software as a service - Year-over-year growth 2023-2028 (%)
- Exhibits39: Data Table on Software as a service - Year-over-year growth 2023-2028 (%)
- Exhibits40: Chart on Monitoring and control services - Market size and forecast 2023-2028 ($ million)
- Exhibits41: Data Table on Monitoring and control services - Market size and forecast 2023-2028 ($ million)
- Exhibits42: Chart on Monitoring and control services - Year-over-year growth 2023-2028 (%)
- Exhibits43: Data Table on Monitoring and control services - Year-over-year growth 2023-2028 (%)
- Exhibits44: Chart on Engineering and design services - Market size and forecast 2023-2028 ($ million)
- Exhibits45: Data Table on Engineering and design services - Market size and forecast 2023-2028 ($ million)
- Exhibits46: Chart on Engineering and design services - Year-over-year growth 2023-2028 (%)
- Exhibits47: Data Table on Engineering and design services - Year-over-year growth 2023-2028 (%)
- Exhibits48: Market opportunity by Service Type ($ million)
- Exhibits49: Data Table on Market opportunity by Service Type ($ million)
- Exhibits50: Chart on Type - Market share 2023-2028 (%)
- Exhibits51: Data Table on Type - Market share 2023-2028 (%)
- Exhibits52: Chart on Comparison by Type
- Exhibits53: Data Table on Comparison by Type
- Exhibits54: Chart on Remote - Market size and forecast 2023-2028 ($ million)
- Exhibits55: Data Table on Remote - Market size and forecast 2023-2028 ($ million)
- Exhibits56: Chart on Remote - Year-over-year growth 2023-2028 (%)
- Exhibits57: Data Table on Remote - Year-over-year growth 2023-2028 (%)
- Exhibits58: Chart on Grid-connected - Market size and forecast 2023-2028 ($ million)
- Exhibits59: Data Table on Grid-connected - Market size and forecast 2023-2028 ($ million)
- Exhibits60: Chart on Grid-connected - Year-over-year growth 2023-2028 (%)
- Exhibits61: Data Table on Grid-connected - Year-over-year growth 2023-2028 (%)
- Exhibits62: Chart on Networked - Market size and forecast 2023-2028 ($ million)
- Exhibits63: Data Table on Networked - Market size and forecast 2023-2028 ($ million)
- Exhibits64: Chart on Networked - Year-over-year growth 2023-2028 (%)
- Exhibits65: Data Table on Networked - Year-over-year growth 2023-2028 (%)
- Exhibits66: Market opportunity by Type ($ million)
- Exhibits67: Data Table on Market opportunity by Type ($ million)
- Exhibits68: Analysis of price sensitivity, lifecycle, customer purchase basket, adoption rates, and purchase criteria
- Exhibits69: Chart on Market share by geography 2023-2028 (%)
- Exhibits70: Data Table on Market share by geography 2023-2028 (%)
- Exhibits71: Chart on Geographic comparison
- Exhibits72: Data Table on Geographic comparison
- Exhibits73: Chart on APAC - Market size and forecast 2023-2028 ($ million)
- Exhibits74: Data Table on APAC - Market size and forecast 2023-2028 ($ million)
- Exhibits75: Chart on APAC - Year-over-year growth 2023-2028 (%)
- Exhibits76: Data Table on APAC - Year-over-year growth 2023-2028 (%)
- Exhibits77: Chart on North America - Market size and forecast 2023-2028 ($ million)
- Exhibits78: Data Table on North America - Market size and forecast 2023-2028 ($ million)
- Exhibits79: Chart on North America - Year-over-year growth 2023-2028 (%)
- Exhibits80: Data Table on North America - Year-over-year growth 2023-2028 (%)
- Exhibits81: Chart on Europe - Market size and forecast 2023-2028 ($ million)
- Exhibits82: Data Table on Europe - Market size and forecast 2023-2028 ($ million)
- Exhibits83: Chart on Europe - Year-over-year growth 2023-2028 (%)
- Exhibits84: Data Table on Europe - Year-over-year growth 2023-2028 (%)
- Exhibits85: Chart on South America - Market size and forecast 2023-2028 ($ million)
- Exhibits86: Data Table on South America - Market size and forecast 2023-2028 ($ million)
- Exhibits87: Chart on South America - Year-over-year growth 2023-2028 (%)
- Exhibits88: Data Table on South America - Year-over-year growth 2023-2028 (%)
- Exhibits89: Chart on Middle East and Africa - Market size and forecast 2023-2028 ($ million)
- Exhibits90: Data Table on Middle East and Africa - Market size and forecast 2023-2028 ($ million)
- Exhibits91: Chart on Middle East and Africa - Year-over-year growth 2023-2028 (%)
- Exhibits92: Data Table on Middle East and Africa - Year-over-year growth 2023-2028 (%)
- Exhibits93: Chart on US - Market size and forecast 2023-2028 ($ million)
- Exhibits94: Data Table on US - Market size and forecast 2023-2028 ($ million)
- Exhibits95: Chart on US - Year-over-year growth 2023-2028 (%)
- Exhibits96: Data Table on US - Year-over-year growth 2023-2028 (%)
- Exhibits97: Chart on China - Market size and forecast 2023-2028 ($ million)
- Exhibits98: Data Table on China - Market size and forecast 2023-2028 ($ million)
- Exhibits99: Chart on China - Year-over-year growth 2023-2028 (%)
- Exhibits100: Data Table on China - Year-over-year growth 2023-2028 (%)
- Exhibits101: Chart on Japan - Market size and forecast 2023-2028 ($ million)
- Exhibits102: Data Table on Japan - Market size and forecast 2023-2028 ($ million)
- Exhibits103: Chart on Japan - Year-over-year growth 2023-2028 (%)
- Exhibits104: Data Table on Japan - Year-over-year growth 2023-2028 (%)
- Exhibits105: Chart on India - Market size and forecast 2023-2028 ($ million)
- Exhibits106: Data Table on India - Market size and forecast 2023-2028 ($ million)
- Exhibits107: Chart on India - Year-over-year growth 2023-2028 (%)
- Exhibits108: Data Table on India - Year-over-year growth 2023-2028 (%)
- Exhibits109: Chart on Germany - Market size and forecast 2023-2028 ($ million)
- Exhibits110: Data Table on Germany - Market size and forecast 2023-2028 ($ million)
- Exhibits111: Chart on Germany - Year-over-year growth 2023-2028 (%)
- Exhibits112: Data Table on Germany - Year-over-year growth 2023-2028 (%)
- Exhibits113: Market opportunity by geography ($ million)
- Exhibits114: Data Tables on Market opportunity by geography ($ million)
- Exhibits115: Impact of drivers and challenges in 2023 and 2028
- Exhibits116: Overview on criticality of inputs and factors of differentiation
- Exhibits117: Overview on factors of disruption
- Exhibits118: Impact of key risks on business
- Exhibits119: Companies covered
- Exhibits120: Matrix on companies position and classification
- Exhibits121: ABB Ltd. - Overview
- Exhibits122: ABB Ltd. - Business segments
- Exhibits123: ABB Ltd. - Key news
- Exhibits124: ABB Ltd. - Key offerings
- Exhibits125: ABB Ltd. - Segment focus
- Exhibits126: Aggreko Plc - Overview
- Exhibits127: Aggreko Plc - Product / Service
- Exhibits128: Aggreko Plc - Key offerings
- Exhibits129: AIO Systems Ltd. - Overview
- Exhibits130: AIO Systems Ltd. - Product / Service
- Exhibits131: AIO Systems Ltd. - Key offerings
- Exhibits132: Anbaric Development Partners LLC - Overview
- Exhibits133: Anbaric Development Partners LLC - Product / Service
- Exhibits134: Anbaric Development Partners LLC - Key offerings
- Exhibits135: Capstone Green Energy Corp. - Overview
- Exhibits136: Capstone Green Energy Corp. - Business segments
- Exhibits137: Capstone Green Energy Corp. - Key news
- Exhibits138: Capstone Green Energy Corp. - Key offerings
- Exhibits139: Capstone Green Energy Corp. - Segment focus
- Exhibits140: Eaton Corp. Plc - Overview
- Exhibits141: Eaton Corp. Plc - Business segments
- Exhibits142: Eaton Corp. Plc - Key news
- Exhibits143: Eaton Corp. Plc - Key offerings
- Exhibits144: Eaton Corp. Plc - Segment focus
- Exhibits145: ENGIE SA - Overview
- Exhibits146: ENGIE SA - Business segments
- Exhibits147: ENGIE SA - Key news
- Exhibits148: ENGIE SA - Key offerings
- Exhibits149: ENGIE SA - Segment focus
- Exhibits150: General Electric Co. - Overview
- Exhibits151: General Electric Co. - Business segments
- Exhibits152: General Electric Co. - Key news
- Exhibits153: General Electric Co. - Key offerings
- Exhibits154: General Electric Co. - Segment focus
- Exhibits155: NRG Energy Inc. - Overview
- Exhibits156: NRG Energy Inc. - Business segments
- Exhibits157: NRG Energy Inc. - Key offerings
- Exhibits158: NRG Energy Inc. - Segment focus
- Exhibits159: Pareto Energy - Overview
- Exhibits160: Pareto Energy - Product / Service
- Exhibits161: Pareto Energy - Key offerings
- Exhibits162: Schneider Electric SE - Overview
- Exhibits163: Schneider Electric SE - Business segments
- Exhibits164: Schneider Electric SE - Key news
- Exhibits165: Schneider Electric SE - Key offerings
- Exhibits166: Schneider Electric SE - Segment focus
- Exhibits167: Siemens AG - Overview
- Exhibits168: Siemens AG - Business segments
- Exhibits169: Siemens AG - Key news
- Exhibits170: Siemens AG - Key offerings
- Exhibits171: Siemens AG - Segment focus
- Exhibits172: Spirae LLC - Overview
- Exhibits173: Spirae LLC - Product / Service
- Exhibits174: Spirae LLC - Key offerings
- Exhibits175: Tech Mahindra Ltd. - Overview
- Exhibits176: Tech Mahindra Ltd. - Business segments
- Exhibits177: Tech Mahindra Ltd. - Key news
- Exhibits178: Tech Mahindra Ltd. - Key offerings
- Exhibits179: Tech Mahindra Ltd. - Segment focus
- Exhibits180: Tesla Inc. - Overview
- Exhibits181: Tesla Inc. - Business segments
- Exhibits182: Tesla Inc. - Key news
- Exhibits183: Tesla Inc. - Key offerings
- Exhibits184: Tesla Inc. - Segment focus
- Exhibits185: Inclusions checklist
- Exhibits186: Exclusions checklist
- Exhibits187: Currency conversion rates for US$
- Exhibits188: Research methodology
- Exhibits189: Information sources
- Exhibits190: Data validation
- Exhibits191: Validation techniques employed for market sizing
- Exhibits192: Data synthesis
- Exhibits193: 360 degree market analysis
- Exhibits194: List of abbreviations
The microgrid as a service market is forecasted to grow by USD 8658.3 mn during 2023-2028, accelerating at a CAGR of 16.83% during the forecast period. The report on the microgrid as a service market provides a holistic analysis, market size and forecast, trends, growth drivers, and challenges, as well as vendor analysis covering around 25 vendors.
The report offers an up-to-date analysis regarding the current market scenario, the latest trends and drivers, and the overall market environment. The market is driven by growing demand for microgrids, increasing government support and growing need for better power systems, and several benefits of microgrid as a service.
Technavio's microgrid as a service market is segmented as below:
| Market Scope | |
|---|---|
| Base Year | 2024 |
| End Year | 2028 |
| Series Year | 2024-2028 |
| Growth Momentum | Accelerate |
| YOY 2024 | 14.01% |
| CAGR | 16.83% |
| Incremental Value | $8658.3mn |
By Service Type
- Software as a service
- Monitoring and control services
- Engineering and design services
By Type
- Remote
- Grid-connected
- Networked
By Geography
- APAC
- North America
- Europe
- South America
- Middle East and Africa
This study identifies the rapid advances in technology as one of the prime reasons driving the microgrid as a service market growth during the next few years. Also, rise in demand for monitoring and optimization services to develop sustainable power grids and growing use of microgrids in military applications will lead to sizable demand in the market.
The report on the microgrid as a service market covers the following areas:
- Microgrid as a service market sizing
- Microgrid as a service market forecast
- Microgrid as a service market industry analysis
The robust vendor analysis is designed to help clients improve their market position, and in line with this, this report provides a detailed analysis of several leading microgrid as a service market vendors that include ABB Ltd., Aggreko Plc, AIO Systems Ltd., Anbaric Development Partners LLC, Canopy Power, Capstone Green Energy Corp., Duke Energy Corp., Eaton Corp. Plc, Emerson Electric Co., Enchanted Rock LLC, ENGIE SA, General Electric Co., General MicroGrids, Metco Engineering, NRG Energy Inc., Pareto Energy, Schneider Electric SE, Siemens AG, Spirae LLC, Tech Mahindra Ltd., and Tesla Inc.. Also, the microgrid as a service market analysis report includes information on upcoming trends and challenges that will influence market growth. This is to help companies strategize and leverage all forthcoming growth opportunities.
The study was conducted using an objective combination of primary and secondary information including inputs from key participants in the industry. The report contains a comprehensive market and vendor landscape in addition to an analysis of the key vendors.
The publisher presents a detailed picture of the market by the way of study, synthesis, and summation of data from multiple sources by an analysis of key parameters such as profit, pricing, competition, and promotions. It presents various market facets by identifying the key industry influencers. The data presented is comprehensive, reliable, and a result of extensive research - both primary and secondary. The market research reports provide a complete competitive landscape and an in-depth vendor selection methodology and analysis using qualitative and quantitative research to forecast the accurate market growth.
Table of Contents
1 Executive Summary
- 1.1 Market overview
- Executive Summary - Chart on Market Overview
- Executive Summary - Data Table on Market Overview
- Executive Summary - Chart on Global Market Characteristics
- Executive Summary - Chart on Market by Geography
- Executive Summary - Chart on Market Segmentation by Service Type
- Executive Summary - Chart on Market Segmentation by Type
- Executive Summary - Chart on Incremental Growth
- Executive Summary - Data Table on Incremental Growth
- Executive Summary - Chart on Company Market Positioning
2 Market Landscape
- 2.1 Market ecosystem
- Parent Market
- Data Table on - Parent Market
- 2.2 Market characteristics
- Market characteristics analysis
- 2.3 Value chain analysis
- Value Chain Analysis
3 Market Sizing
- 3.1 Market definition
- Offerings of companies included in the market definition
- 3.2 Market segment analysis
- Market segments
- 3.3 Market size 2023
- 3.4 Market outlook: Forecast for 2023-2028
- Chart on Global - Market size and forecast 2023-2028 ($ million)
- Data Table on Global - Market size and forecast 2023-2028 ($ million)
- Chart on Global Market: Year-over-year growth 2023-2028 (%)
- Data Table on Global Market: Year-over-year growth 2023-2028 (%)
4 Historic Market Size
- 4.1 Global Microgrid As A Service Market 2018 - 2022
- Historic Market Size - Data Table on Global Microgrid As A Service Market 2018 - 2022 ($ million)
- 4.2 Service Type segment analysis 2018 - 2022
- Historic Market Size - Service Type Segment 2018 - 2022 ($ million)
- 4.3 Type segment analysis 2018 - 2022
- Historic Market Size - Type Segment 2018 - 2022 ($ million)
- 4.4 Geography segment analysis 2018 - 2022
- Historic Market Size - Geography Segment 2018 - 2022 ($ million)
- 4.5 Country segment analysis 2018 - 2022
- Historic Market Size - Country Segment 2018 - 2022 ($ million)
5 Five Forces Analysis
- 5.1 Five forces summary
- Five forces analysis - Comparison between 2023 and 2028
- 5.2 Bargaining power of buyers
- Bargaining power of buyers - Impact of key factors 2023 and 2028
- 5.3 Bargaining power of suppliers
- Bargaining power of suppliers - Impact of key factors in 2023 and 2028
- 5.4 Threat of new entrants
- Threat of new entrants - Impact of key factors in 2023 and 2028
- 5.5 Threat of substitutes
- Threat of substitutes - Impact of key factors in 2023 and 2028
- 5.6 Threat of rivalry
- Threat of rivalry - Impact of key factors in 2023 and 2028
- 5.7 Market condition
- Chart on Market condition - Five forces 2023 and 2028
6 Market Segmentation by Service Type
- 6.1 Market segments
- Chart on Service Type - Market share 2023-2028 (%)
- Data Table on Service Type - Market share 2023-2028 (%)
- 6.2 Comparison by Service Type
- Chart on Comparison by Service Type
- Data Table on Comparison by Service Type
- 6.3 Software as a service - Market size and forecast 2023-2028
- Chart on Software as a service - Market size and forecast 2023-2028 ($ million)
- Data Table on Software as a service - Market size and forecast 2023-2028 ($ million)
- Chart on Software as a service - Year-over-year growth 2023-2028 (%)
- Data Table on Software as a service - Year-over-year growth 2023-2028 (%)
- 6.4 Monitoring and control services - Market size and forecast 2023-2028
- Chart on Monitoring and control services - Market size and forecast 2023-2028 ($ million)
- Data Table on Monitoring and control services - Market size and forecast 2023-2028 ($ million)
- Chart on Monitoring and control services - Year-over-year growth 2023-2028 (%)
- Data Table on Monitoring and control services - Year-over-year growth 2023-2028 (%)
- 6.5 Engineering and design services - Market size and forecast 2023-2028
- Chart on Engineering and design services - Market size and forecast 2023-2028 ($ million)
- Data Table on Engineering and design services - Market size and forecast 2023-2028 ($ million)
- Chart on Engineering and design services - Year-over-year growth 2023-2028 (%)
- Data Table on Engineering and design services - Year-over-year growth 2023-2028 (%)
- 6.6 Market opportunity by Service Type
- Market opportunity by Service Type ($ million)
- Data Table on Market opportunity by Service Type ($ million)
7 Market Segmentation by Type
- 7.1 Market segments
- Chart on Type - Market share 2023-2028 (%)
- Data Table on Type - Market share 2023-2028 (%)
- 7.2 Comparison by Type
- Chart on Comparison by Type
- Data Table on Comparison by Type
- 7.3 Remote - Market size and forecast 2023-2028
- Chart on Remote - Market size and forecast 2023-2028 ($ million)
- Data Table on Remote - Market size and forecast 2023-2028 ($ million)
- Chart on Remote - Year-over-year growth 2023-2028 (%)
- Data Table on Remote - Year-over-year growth 2023-2028 (%)
- 7.4 Grid-connected - Market size and forecast 2023-2028
- Chart on Grid-connected - Market size and forecast 2023-2028 ($ million)
- Data Table on Grid-connected - Market size and forecast 2023-2028 ($ million)
- Chart on Grid-connected - Year-over-year growth 2023-2028 (%)
- Data Table on Grid-connected - Year-over-year growth 2023-2028 (%)
- 7.5 Networked - Market size and forecast 2023-2028
- Chart on Networked - Market size and forecast 2023-2028 ($ million)
- Data Table on Networked - Market size and forecast 2023-2028 ($ million)
- Chart on Networked - Year-over-year growth 2023-2028 (%)
- Data Table on Networked - Year-over-year growth 2023-2028 (%)
- 7.6 Market opportunity by Type
- Market opportunity by Type ($ million)
- Data Table on Market opportunity by Type ($ million)
8 Customer Landscape
- 8.1 Customer landscape overview
- Analysis of price sensitivity, lifecycle, customer purchase basket, adoption rates, and purchase criteria
9 Geographic Landscape
- 9.1 Geographic segmentation
- Chart on Market share by geography 2023-2028 (%)
- Data Table on Market share by geography 2023-2028 (%)
- 9.2 Geographic comparison
- Chart on Geographic comparison
- Data Table on Geographic comparison
- 9.3 APAC - Market size and forecast 2023-2028
- Chart on APAC - Market size and forecast 2023-2028 ($ million)
- Data Table on APAC - Market size and forecast 2023-2028 ($ million)
- Chart on APAC - Year-over-year growth 2023-2028 (%)
- Data Table on APAC - Year-over-year growth 2023-2028 (%)
- 9.4 North America - Market size and forecast 2023-2028
- Chart on North America - Market size and forecast 2023-2028 ($ million)
- Data Table on North America - Market size and forecast 2023-2028 ($ million)
- Chart on North America - Year-over-year growth 2023-2028 (%)
- Data Table on North America - Year-over-year growth 2023-2028 (%)
- 9.5 Europe - Market size and forecast 2023-2028
- Chart on Europe - Market size and forecast 2023-2028 ($ million)
- Data Table on Europe - Market size and forecast 2023-2028 ($ million)
- Chart on Europe - Year-over-year growth 2023-2028 (%)
- Data Table on Europe - Year-over-year growth 2023-2028 (%)
- 9.6 South America - Market size and forecast 2023-2028
- Chart on South America - Market size and forecast 2023-2028 ($ million)
- Data Table on South America - Market size and forecast 2023-2028 ($ million)
- Chart on South America - Year-over-year growth 2023-2028 (%)
- Data Table on South America - Year-over-year growth 2023-2028 (%)
- 9.7 Middle East and Africa - Market size and forecast 2023-2028
- Chart on Middle East and Africa - Market size and forecast 2023-2028 ($ million)
- Data Table on Middle East and Africa - Market size and forecast 2023-2028 ($ million)
- Chart on Middle East and Africa - Year-over-year growth 2023-2028 (%)
- Data Table on Middle East and Africa - Year-over-year growth 2023-2028 (%)
- 9.8 US - Market size and forecast 2023-2028
- Chart on US - Market size and forecast 2023-2028 ($ million)
- Data Table on US - Market size and forecast 2023-2028 ($ million)
- Chart on US - Year-over-year growth 2023-2028 (%)
- Data Table on US - Year-over-year growth 2023-2028 (%)
- 9.9 China - Market size and forecast 2023-2028
- Chart on China - Market size and forecast 2023-2028 ($ million)
- Data Table on China - Market size and forecast 2023-2028 ($ million)
- Chart on China - Year-over-year growth 2023-2028 (%)
- Data Table on China - Year-over-year growth 2023-2028 (%)
- 9.10 Japan - Market size and forecast 2023-2028
- Chart on Japan - Market size and forecast 2023-2028 ($ million)
- Data Table on Japan - Market size and forecast 2023-2028 ($ million)
- Chart on Japan - Year-over-year growth 2023-2028 (%)
- Data Table on Japan - Year-over-year growth 2023-2028 (%)
- 9.11 India - Market size and forecast 2023-2028
- Chart on India - Market size and forecast 2023-2028 ($ million)
- Data Table on India - Market size and forecast 2023-2028 ($ million)
- Chart on India - Year-over-year growth 2023-2028 (%)
- Data Table on India - Year-over-year growth 2023-2028 (%)
- 9.12 Germany - Market size and forecast 2023-2028
- Chart on Germany - Market size and forecast 2023-2028 ($ million)
- Data Table on Germany - Market size and forecast 2023-2028 ($ million)
- Chart on Germany - Year-over-year growth 2023-2028 (%)
- Data Table on Germany - Year-over-year growth 2023-2028 (%)
- 9.13 Market opportunity by geography
- Market opportunity by geography ($ million)
- Data Tables on Market opportunity by geography ($ million)
10 Drivers, Challenges, and Opportunity/Restraints
- 10.1 Market drivers
- 10.2 Market challenges
- 10.3 Impact of drivers and challenges
- Impact of drivers and challenges in 2023 and 2028
- 10.4 Market opportunities/restraints
11 Competitive Landscape
- 11.1 Overview
- 11.2 Competitive Landscape
- Overview on criticality of inputs and factors of differentiation
- 11.3 Landscape disruption
- Overview on factors of disruption
- 11.4 Industry risks
- Impact of key risks on business
12 Competitive Analysis
- 12.1 Companies profiled
- Companies covered
- 12.2 Market positioning of companies
- Matrix on companies position and classification
- 12.3 ABB Ltd.
- ABB Ltd. - Overview
- ABB Ltd. - Business segments
- ABB Ltd. - Key news
- ABB Ltd. - Key offerings
- ABB Ltd. - Segment focus
- 12.4 Aggreko Plc
- Aggreko Plc - Overview
- Aggreko Plc - Product / Service
- Aggreko Plc - Key offerings
- 12.5 AIO Systems Ltd.
- AIO Systems Ltd. - Overview
- AIO Systems Ltd. - Product / Service
- AIO Systems Ltd. - Key offerings
- 12.6 Anbaric Development Partners LLC
- Anbaric Development Partners LLC - Overview
- Anbaric Development Partners LLC - Product / Service
- Anbaric Development Partners LLC - Key offerings
- 12.7 Capstone Green Energy Corp.
- Capstone Green Energy Corp. - Overview
- Capstone Green Energy Corp. - Business segments
- Capstone Green Energy Corp. - Key news
- Capstone Green Energy Corp. - Key offerings
- Capstone Green Energy Corp. - Segment focus
- 12.8 Eaton Corp. Plc
- Eaton Corp. Plc - Overview
- Eaton Corp. Plc - Business segments
- Eaton Corp. Plc - Key news
- Eaton Corp. Plc - Key offerings
- Eaton Corp. Plc - Segment focus
- 12.9 ENGIE SA
- ENGIE SA - Overview
- ENGIE SA - Business segments
- ENGIE SA - Key news
- ENGIE SA - Key offerings
- ENGIE SA - Segment focus
- 12.10 General Electric Co.
- General Electric Co. - Overview
- General Electric Co. - Business segments
- General Electric Co. - Key news
- General Electric Co. - Key offerings
- General Electric Co. - Segment focus
- 12.11 NRG Energy Inc.
- NRG Energy Inc. - Overview
- NRG Energy Inc. - Business segments
- NRG Energy Inc. - Key offerings
- NRG Energy Inc. - Segment focus
- 12.12 Pareto Energy
- Pareto Energy - Overview
- Pareto Energy - Product / Service
- Pareto Energy - Key offerings
- 12.13 Schneider Electric SE
- Schneider Electric SE - Overview
- Schneider Electric SE - Business segments
- Schneider Electric SE - Key news
- Schneider Electric SE - Key offerings
- Schneider Electric SE - Segment focus
- 12.14 Siemens AG
- Siemens AG - Overview
- Siemens AG - Business segments
- Siemens AG - Key news
- Siemens AG - Key offerings
- Siemens AG - Segment focus
- 12.15 Spirae LLC
- Spirae LLC - Overview
- Spirae LLC - Product / Service
- Spirae LLC - Key offerings
- 12.16 Tech Mahindra Ltd.
- Tech Mahindra Ltd. - Overview
- Tech Mahindra Ltd. - Business segments
- Tech Mahindra Ltd. - Key news
- Tech Mahindra Ltd. - Key offerings
- Tech Mahindra Ltd. - Segment focus
- 12.17 Tesla Inc.
- Tesla Inc. - Overview
- Tesla Inc. - Business segments
- Tesla Inc. - Key news
- Tesla Inc. - Key offerings
- Tesla Inc. - Segment focus
13 Appendix
- 13.1 Scope of the report
- 13.2 Inclusions and exclusions checklist
- Inclusions checklist
- Exclusions checklist
- 13.3 Currency conversion rates for US$
- Currency conversion rates for US$
- 13.4 Research methodology
- Research methodology
- 13.5 Data procurement
- Information sources
- 13.6 Data validation
- Data validation
- 13.7 Validation techniques employed for market sizing
- Validation techniques employed for market sizing
- 13.8 Data synthesis
- Data synthesis
- 13.9 360 degree market analysis
- 360 degree market analysis
- 13.10 List of abbreviations
- List of abbreviations

