|
|
市場調査レポート
商品コード
1544344
ポリ乳酸-グリコール酸(PLGA)の世界市場 2024-2028Global Poly(lactic-co-glycolic Acid) (PLGA) Market 2024-2028 |
||||||

|
|||||||
カスタマイズ可能
|
|||||||

| ポリ乳酸-グリコール酸(PLGA)の世界市場 2024-2028 |
|
出版日: 2024年07月23日
発行: TechNavio
ページ情報: 英文 179 Pages
納期: 即納可能
|

全表示
- 概要
- 図表
- 目次
ポリ乳酸-グリコール酸(PLGA)市場は2023-2028年に1億3,750万米ドル、予測期間中のCAGRは9.46%で成長すると予測されます。
当レポートでは、ポリ乳酸-グリコール酸(PLGA)市場の全体的な分析、市場規模・予測、動向、成長促進要因、課題、約25のベンダーを網羅したベンダー分析などを掲載しています。
現在の市場シナリオ、最新動向と促進要因、市場環境全体に関する最新分析を提供しています。ドラッグデリバリー用途の需要拡大、手術発明の増加、交通事故の増加による外傷の増加などが市場を牽引しています。
| 市場範囲 | |
|---|---|
| 基準年 | 2024 |
| 終了年 | 2028 |
| 予測期間 | 2024-2028 |
| 成長モメンタム | 加速 |
| 前年比2024年 | 8.43% |
| CAGR | 9.46% |
| 増分額 | 1億3,750万米ドル |
本調査では、今後数年間のポリ乳酸-グリコール酸(PLGA)市場成長を牽引する主な要因の1つとして、エレクトロスピニングと3dプリンティング技術に対する需要の高まりを挙げています。また、化粧品業界からの需要の増加や新興国への注目の高まりも、市場の大きな需要につながります。
目次
第1章 エグゼクティブサマリー
- 市場概要
第2章 市場情勢
- 市場エコシステム
- 市場の特徴
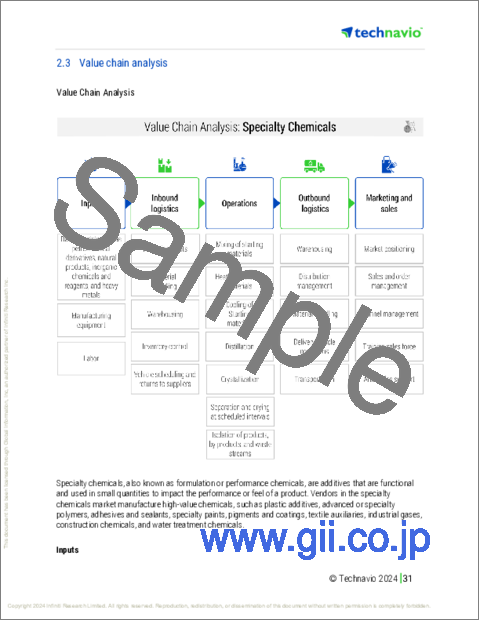
- バリューチェーン分析
第3章 市場規模の評価
- 市場の定義
- 市場セグメント分析
- 市場規模 2023
- 市場の見通し 2023-2028
第4章 市場規模実績
- ポリ乳酸-グリコール酸(PLGA)の世界市場 2018-2022
- 用途別セグメント分析 2018-2022
- タイプ別セグメント分析 2018-2022
- 地域別セグメント分析 2018-2022
- 国別セグメント分析 2018-2022
第5章 ファイブフォース分析
- ファイブフォースの要約
- 買い手の交渉力
- 供給企業の交渉力
- 新規参入業者の脅威
- 代替品の脅威
- 競争の脅威
- 市況
第6章 市場セグメンテーション:用途別
- 市場セグメンテーション
- 比較:用途別
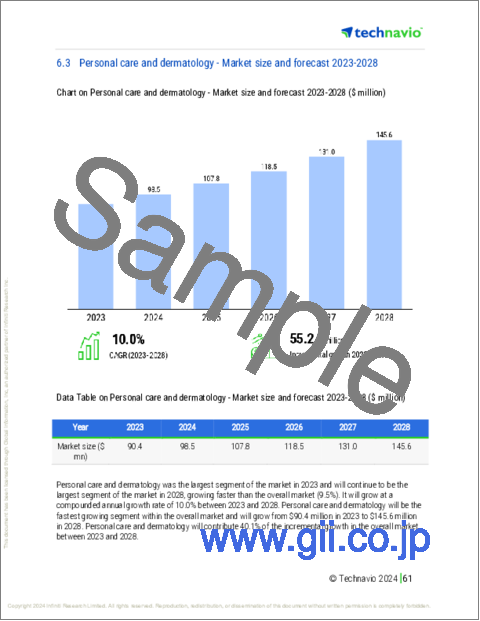
- パーソナルケアと皮膚科:市場規模と予測 2023-2028
- 縫合:市場規模と予測 2023-2028
- 骨折固定:市場規模と予測 2023-2028
- その他:市場規模と予測 2023-2028
- 市場機会:用途別
第7章 市場セグメンテーション:タイプ別
- 市場セグメンテーション
- 比較:タイプ別
- PLGA 50:50:市場規模と予測 2023-2028
- PLGA 75:25:市場規模と予測 2023-2028
- PLGA 85:15:市場規模と予測 2023-2028
- PLGA 65:35:市場規模と予測 2023-2028
- 市場機会:タイプ別
第8章 顧客情勢
- 顧客情勢の概要
第9章 地域別情勢
- 地域別セグメンテーション
- 比較:地域別
- 北米:市場規模と予測 2023-2028
- 欧州:市場規模と予測 2023-2028
- アジア太平洋:市場規模と予測 2023-2028
- 南米:市場規模と予測 2023-2028
- 中東・アフリカ:市場規模と予測 2023-2028
- 米国:市場規模と予測 2023-2028
- 英国:市場規模と予測 2023-2028
- 中国:市場規模と予測 2023-2028
- ドイツ:市場規模と予測 2023-2028
- フランス:市場規模と予測 2023-2028
- 市場機会:地域別
第10章 促進要因・課題・機会・抑制要因
- 市場促進要因
- 市場の課題
- 促進要因と課題の影響
- 市場の機会・抑制要因
第11章 競合情勢
- 概要
- 競合情勢
- 混乱の状況
- 業界のリスク
第12章 競合分析
- 企業プロファイル
- 企業の市場ポジショニング
- Ashland Inc.
- Bezwada Biomedical LLC
- CD Bioparticles
- Corbion nv
- Evonik Industries AG
- Foster Corp.
- Huizhou Foryou Medical Devices Co. Ltd.
- Koninklijke DSM NV
- Merck KGaA
- Mitsui Chemicals Inc.
- Nomisma Healthcare Pvt. Ltd.
- Poly Med Inc.
- Polysciences Inc.
- SEQENS GROUP
- Zeus Co. Inc.
第13章 付録
Exhibits:
- Exhibits1: Executive Summary - Chart on Market Overview
- Exhibits2: Executive Summary - Data Table on Market Overview
- Exhibits3: Executive Summary - Chart on Global Market Characteristics
- Exhibits4: Executive Summary - Chart on Market By Geographical Landscape
- Exhibits5: Executive Summary - Chart on Market Segmentation by Application
- Exhibits6: Executive Summary - Chart on Market Segmentation by Type
- Exhibits7: Executive Summary - Chart on Incremental Growth
- Exhibits8: Executive Summary - Data Table on Incremental Growth
- Exhibits9: Executive Summary - Chart on Company Market Positioning
- Exhibits10: Parent Market
- Exhibits11: Data Table on - Parent Market
- Exhibits12: Market characteristics analysis
- Exhibits13: Value Chain Analysis
- Exhibits14: Offerings of companies included in the market definition
- Exhibits15: Market segments
- Exhibits16: Chart on Global - Market size and forecast 2023-2028 ($ million)
- Exhibits17: Data Table on Global - Market size and forecast 2023-2028 ($ million)
- Exhibits18: Chart on Global Market: Year-over-year growth 2023-2028 (%)
- Exhibits19: Data Table on Global Market: Year-over-year growth 2023-2028 (%)
- Exhibits20: Historic Market Size - Data Table on Global Poly(Lactic-Co-Glycolic Acid) (PLGA) Market 2018 - 2022 ($ million)
- Exhibits21: Historic Market Size - Application Segment 2018 - 2022 ($ million)
- Exhibits22: Historic Market Size - Type Segment 2018 - 2022 ($ million)
- Exhibits23: Historic Market Size - Geography Segment 2018 - 2022 ($ million)
- Exhibits24: Historic Market Size - Country Segment 2018 - 2022 ($ million)
- Exhibits25: Five forces analysis - Comparison between 2023 and 2028
- Exhibits26: Bargaining power of buyers - Impact of key factors 2023 and 2028
- Exhibits27: Bargaining power of suppliers - Impact of key factors in 2023 and 2028
- Exhibits28: Threat of new entrants - Impact of key factors in 2023 and 2028
- Exhibits29: Threat of substitutes - Impact of key factors in 2023 and 2028
- Exhibits30: Threat of rivalry - Impact of key factors in 2023 and 2028
- Exhibits31: Chart on Market condition - Five forces 2023 and 2028
- Exhibits32: Chart on Application - Market share 2023-2028 (%)
- Exhibits33: Data Table on Application - Market share 2023-2028 (%)
- Exhibits34: Chart on Comparison by Application
- Exhibits35: Data Table on Comparison by Application
- Exhibits36: Chart on Personal care and dermatology - Market size and forecast 2023-2028 ($ million)
- Exhibits37: Data Table on Personal care and dermatology - Market size and forecast 2023-2028 ($ million)
- Exhibits38: Chart on Personal care and dermatology - Year-over-year growth 2023-2028 (%)
- Exhibits39: Data Table on Personal care and dermatology - Year-over-year growth 2023-2028 (%)
- Exhibits40: Chart on Suture - Market size and forecast 2023-2028 ($ million)
- Exhibits41: Data Table on Suture - Market size and forecast 2023-2028 ($ million)
- Exhibits42: Chart on Suture - Year-over-year growth 2023-2028 (%)
- Exhibits43: Data Table on Suture - Year-over-year growth 2023-2028 (%)
- Exhibits44: Chart on Fracture fixation - Market size and forecast 2023-2028 ($ million)
- Exhibits45: Data Table on Fracture fixation - Market size and forecast 2023-2028 ($ million)
- Exhibits46: Chart on Fracture fixation - Year-over-year growth 2023-2028 (%)
- Exhibits47: Data Table on Fracture fixation - Year-over-year growth 2023-2028 (%)
- Exhibits48: Chart on Others - Market size and forecast 2023-2028 ($ million)
- Exhibits49: Data Table on Others - Market size and forecast 2023-2028 ($ million)
- Exhibits50: Chart on Others - Year-over-year growth 2023-2028 (%)
- Exhibits51: Data Table on Others - Year-over-year growth 2023-2028 (%)
- Exhibits52: Market opportunity by Application ($ million)
- Exhibits53: Data Table on Market opportunity by Application ($ million)
- Exhibits54: Chart on Type - Market share 2023-2028 (%)
- Exhibits55: Data Table on Type - Market share 2023-2028 (%)
- Exhibits56: Chart on Comparison by Type
- Exhibits57: Data Table on Comparison by Type
- Exhibits58: Chart on PLGA 50:50 - Market size and forecast 2023-2028 ($ million)
- Exhibits59: Data Table on PLGA 50:50 - Market size and forecast 2023-2028 ($ million)
- Exhibits60: Chart on PLGA 50:50 - Year-over-year growth 2023-2028 (%)
- Exhibits61: Data Table on PLGA 50:50 - Year-over-year growth 2023-2028 (%)
- Exhibits62: Chart on PLGA 75:25 - Market size and forecast 2023-2028 ($ million)
- Exhibits63: Data Table on PLGA 75:25 - Market size and forecast 2023-2028 ($ million)
- Exhibits64: Chart on PLGA 75:25 - Year-over-year growth 2023-2028 (%)
- Exhibits65: Data Table on PLGA 75:25 - Year-over-year growth 2023-2028 (%)
- Exhibits66: Chart on PLGA 85:15 - Market size and forecast 2023-2028 ($ million)
- Exhibits67: Data Table on PLGA 85:15 - Market size and forecast 2023-2028 ($ million)
- Exhibits68: Chart on PLGA 85:15 - Year-over-year growth 2023-2028 (%)
- Exhibits69: Data Table on PLGA 85:15 - Year-over-year growth 2023-2028 (%)
- Exhibits70: Chart on PLGA 65:35 - Market size and forecast 2023-2028 ($ million)
- Exhibits71: Data Table on PLGA 65:35 - Market size and forecast 2023-2028 ($ million)
- Exhibits72: Chart on PLGA 65:35 - Year-over-year growth 2023-2028 (%)
- Exhibits73: Data Table on PLGA 65:35 - Year-over-year growth 2023-2028 (%)
- Exhibits74: Market opportunity by Type ($ million)
- Exhibits75: Data Table on Market opportunity by Type ($ million)
- Exhibits76: Analysis of price sensitivity, lifecycle, customer purchase basket, adoption rates, and purchase criteria
- Exhibits77: Chart on Market share By Geographical Landscape 2023-2028 (%)
- Exhibits78: Data Table on Market share By Geographical Landscape 2023-2028 (%)
- Exhibits79: Chart on Geographic comparison
- Exhibits80: Data Table on Geographic comparison
- Exhibits81: Chart on North America - Market size and forecast 2023-2028 ($ million)
- Exhibits82: Data Table on North America - Market size and forecast 2023-2028 ($ million)
- Exhibits83: Chart on North America - Year-over-year growth 2023-2028 (%)
- Exhibits84: Data Table on North America - Year-over-year growth 2023-2028 (%)
- Exhibits85: Chart on Europe - Market size and forecast 2023-2028 ($ million)
- Exhibits86: Data Table on Europe - Market size and forecast 2023-2028 ($ million)
- Exhibits87: Chart on Europe - Year-over-year growth 2023-2028 (%)
- Exhibits88: Data Table on Europe - Year-over-year growth 2023-2028 (%)
- Exhibits89: Chart on APAC - Market size and forecast 2023-2028 ($ million)
- Exhibits90: Data Table on APAC - Market size and forecast 2023-2028 ($ million)
- Exhibits91: Chart on APAC - Year-over-year growth 2023-2028 (%)
- Exhibits92: Data Table on APAC - Year-over-year growth 2023-2028 (%)
- Exhibits93: Chart on South America - Market size and forecast 2023-2028 ($ million)
- Exhibits94: Data Table on South America - Market size and forecast 2023-2028 ($ million)
- Exhibits95: Chart on South America - Year-over-year growth 2023-2028 (%)
- Exhibits96: Data Table on South America - Year-over-year growth 2023-2028 (%)
- Exhibits97: Chart on Middle East and Africa - Market size and forecast 2023-2028 ($ million)
- Exhibits98: Data Table on Middle East and Africa - Market size and forecast 2023-2028 ($ million)
- Exhibits99: Chart on Middle East and Africa - Year-over-year growth 2023-2028 (%)
- Exhibits100: Data Table on Middle East and Africa - Year-over-year growth 2023-2028 (%)
- Exhibits101: Chart on US - Market size and forecast 2023-2028 ($ million)
- Exhibits102: Data Table on US - Market size and forecast 2023-2028 ($ million)
- Exhibits103: Chart on US - Year-over-year growth 2023-2028 (%)
- Exhibits104: Data Table on US - Year-over-year growth 2023-2028 (%)
- Exhibits105: Chart on UK - Market size and forecast 2023-2028 ($ million)
- Exhibits106: Data Table on UK - Market size and forecast 2023-2028 ($ million)
- Exhibits107: Chart on UK - Year-over-year growth 2023-2028 (%)
- Exhibits108: Data Table on UK - Year-over-year growth 2023-2028 (%)
- Exhibits109: Chart on China - Market size and forecast 2023-2028 ($ million)
- Exhibits110: Data Table on China - Market size and forecast 2023-2028 ($ million)
- Exhibits111: Chart on China - Year-over-year growth 2023-2028 (%)
- Exhibits112: Data Table on China - Year-over-year growth 2023-2028 (%)
- Exhibits113: Chart on Germany - Market size and forecast 2023-2028 ($ million)
- Exhibits114: Data Table on Germany - Market size and forecast 2023-2028 ($ million)
- Exhibits115: Chart on Germany - Year-over-year growth 2023-2028 (%)
- Exhibits116: Data Table on Germany - Year-over-year growth 2023-2028 (%)
- Exhibits117: Chart on France - Market size and forecast 2023-2028 ($ million)
- Exhibits118: Data Table on France - Market size and forecast 2023-2028 ($ million)
- Exhibits119: Chart on France - Year-over-year growth 2023-2028 (%)
- Exhibits120: Data Table on France - Year-over-year growth 2023-2028 (%)
- Exhibits121: Market opportunity By Geographical Landscape ($ million)
- Exhibits122: Data Tables on Market opportunity By Geographical Landscape ($ million)
- Exhibits123: Impact of drivers and challenges in 2023 and 2028
- Exhibits124: Overview on criticality of inputs and factors of differentiation
- Exhibits125: Overview on factors of disruption
- Exhibits126: Impact of key risks on business
- Exhibits127: Companies covered
- Exhibits128: Matrix on companies position and classification
- Exhibits129: Ashland Inc. - Overview
- Exhibits130: Ashland Inc. - Business segments
- Exhibits131: Ashland Inc. - Key news
- Exhibits132: Ashland Inc. - Key offerings
- Exhibits133: Ashland Inc. - Segment focus
- Exhibits134: Bezwada Biomedical LLC - Overview
- Exhibits135: Bezwada Biomedical LLC - Product / Service
- Exhibits136: Bezwada Biomedical LLC - Key offerings
- Exhibits137: CD Bioparticles - Overview
- Exhibits138: CD Bioparticles - Product / Service
- Exhibits139: CD Bioparticles - Key offerings
- Exhibits140: Corbion nv - Overview
- Exhibits141: Corbion nv - Business segments
- Exhibits142: Corbion nv - Key news
- Exhibits143: Corbion nv - Key offerings
- Exhibits144: Corbion nv - Segment focus
- Exhibits145: Evonik Industries AG - Overview
- Exhibits146: Evonik Industries AG - Business segments
- Exhibits147: Evonik Industries AG - Key news
- Exhibits148: Evonik Industries AG - Key offerings
- Exhibits149: Evonik Industries AG - Segment focus
- Exhibits150: Foster Corp. - Overview
- Exhibits151: Foster Corp. - Product / Service
- Exhibits152: Foster Corp. - Key offerings
- Exhibits153: Huizhou Foryou Medical Devices Co. Ltd. - Overview
- Exhibits154: Huizhou Foryou Medical Devices Co. Ltd. - Product / Service
- Exhibits155: Huizhou Foryou Medical Devices Co. Ltd. - Key offerings
- Exhibits156: Koninklijke DSM NV - Overview
- Exhibits157: Koninklijke DSM NV - Business segments
- Exhibits158: Koninklijke DSM NV - Key news
- Exhibits159: Koninklijke DSM NV - Key offerings
- Exhibits160: Koninklijke DSM NV - Segment focus
- Exhibits161: Merck KGaA - Overview
- Exhibits162: Merck KGaA - Business segments
- Exhibits163: Merck KGaA - Key news
- Exhibits164: Merck KGaA - Key offerings
- Exhibits165: Merck KGaA - Segment focus
- Exhibits166: Mitsui Chemicals Inc. - Overview
- Exhibits167: Mitsui Chemicals Inc. - Business segments
- Exhibits168: Mitsui Chemicals Inc. - Key offerings
- Exhibits169: Mitsui Chemicals Inc. - Segment focus
- Exhibits170: Nomisma Healthcare Pvt. Ltd. - Overview
- Exhibits171: Nomisma Healthcare Pvt. Ltd. - Product / Service
- Exhibits172: Nomisma Healthcare Pvt. Ltd. - Key offerings
- Exhibits173: Poly Med Inc. - Overview
- Exhibits174: Poly Med Inc. - Product / Service
- Exhibits175: Poly Med Inc. - Key offerings
- Exhibits176: Polysciences Inc. - Overview
- Exhibits177: Polysciences Inc. - Product / Service
- Exhibits178: Polysciences Inc. - Key offerings
- Exhibits179: SEQENS GROUP - Overview
- Exhibits180: SEQENS GROUP - Product / Service
- Exhibits181: SEQENS GROUP - Key offerings
- Exhibits182: Zeus Co. Inc. - Overview
- Exhibits183: Zeus Co. Inc. - Product / Service
- Exhibits184: Zeus Co. Inc. - Key offerings
- Exhibits185: Inclusions checklist
- Exhibits186: Exclusions checklist
- Exhibits187: Currency conversion rates for US$
- Exhibits188: Research methodology
- Exhibits189: Information sources
- Exhibits190: Data validation
- Exhibits191: Validation techniques employed for market sizing
- Exhibits192: Data synthesis
- Exhibits193: 360 degree market analysis
- Exhibits194: List of abbreviations
The poly(Lactic-Co-Glycolic Acid) (PLGA) market is forecasted to grow by USD 137.5 mn during 2023-2028, accelerating at a CAGR of 9.46% during the forecast period. The report on the poly(Lactic-Co-Glycolic Acid) (PLGA) market provides a holistic analysis, market size and forecast, trends, growth drivers, and challenges, as well as vendor analysis covering around 25 vendors.
The report offers an up-to-date analysis regarding the current market scenario, the latest trends and drivers, and the overall market environment. The market is driven by growing demand for drug delivery applications, increasing number of surgical inventions, and growing number of traumatic injuries due to rise in road accidents.
Technavio's poly(Lactic-Co-Glycolic Acid) (PLGA) market is segmented as below:
| Market Scope | |
|---|---|
| Base Year | 2024 |
| End Year | 2028 |
| Series Year | 2024-2028 |
| Growth Momentum | Accelerate |
| YOY 2024 | 8.43% |
| CAGR | 9.46% |
| Incremental Value | $137.5 mn |
By Application
- Personal care and dermatology
- Suture
- Fracture fixation
- Others
By Type
- PLGA 50:50
- PLGA 75:25
- PLGA 85:15
- PLGA 65:35
By Geographical Landscape
- North America
- Europe
- APAC
- South America
- Middle East and Africa
This study identifies the rising demand for electrospinning and 3d printing technologies as one of the prime reasons driving the poly(Lactic-Co-Glycolic Acid) (PLGA) market growth during the next few years. Also, growing demand from cosmetics industry and growing focus on emerging economies will lead to sizable demand in the market.
The report on the poly(Lactic-Co-Glycolic Acid) (PLGA) market covers the following areas:
- Poly(Lactic-Co-Glycolic Acid) (PLGA) market sizing
- Poly(Lactic-Co-Glycolic Acid) (PLGA) market forecast
- Poly(Lactic-Co-Glycolic Acid) (PLGA) market industry analysis
The robust vendor analysis is designed to help clients improve their market position, and in line with this, this report provides a detailed analysis of several leading poly(Lactic-Co-Glycolic Acid) (PLGA) market vendors that include Akina Inc., Alfa Chemistry, Ashland Inc., Bezwada Biomedical LLC, CD Bioparticles, Corbion nv, Creative PEGWorks, Evonik Industries AG, Foster Corp., Huizhou Foryou Medical Devices Co. Ltd., Koninklijke DSM NV, Merck KGaA, Mitsui Chemicals Inc., Nanosoft Polymers, Nomisma Healthcare Pvt. Ltd., Poly Med Inc., Polysciences Inc., SEQENS GROUP, SPECIFIC POLYMERS, and Zeus Co. Inc.. Also, the poly(Lactic-Co-Glycolic Acid) (PLGA) market analysis report includes information on upcoming trends and challenges that will influence market growth. This is to help companies strategize and leverage all forthcoming growth opportunities.
The study was conducted using an objective combination of primary and secondary information including inputs from key participants in the industry. The report contains a comprehensive market and vendor landscape in addition to an analysis of the key vendors.
The publisher presents a detailed picture of the market by the way of study, synthesis, and summation of data from multiple sources by an analysis of key parameters such as profit, pricing, competition, and promotions. It presents various market facets by identifying the key industry influencers. The data presented is comprehensive, reliable, and a result of extensive research - both primary and secondary. The market research reports provide a complete competitive landscape and an in-depth vendor selection methodology and analysis using qualitative and quantitative research to forecast the accurate market growth.
Table of Contents
1 Executive Summary
- 1.1 Market overview
- Executive Summary - Chart on Market Overview
- Executive Summary - Data Table on Market Overview
- Executive Summary - Chart on Global Market Characteristics
- Executive Summary - Chart on Market By Geographical Landscape
- Executive Summary - Chart on Market Segmentation by Application
- Executive Summary - Chart on Market Segmentation by Type
- Executive Summary - Chart on Incremental Growth
- Executive Summary - Data Table on Incremental Growth
- Executive Summary - Chart on Company Market Positioning
2 Market Landscape
- 2.1 Market ecosystem
- Parent Market
- Data Table on - Parent Market
- 2.2 Market characteristics
- Market characteristics analysis
- 2.3 Value chain analysis
- Value Chain Analysis
3 Market Sizing
- 3.1 Market definition
- Offerings of companies included in the market definition
- 3.2 Market segment analysis
- Market segments
- 3.3 Market size 2023
- 3.4 Market outlook: Forecast for 2023-2028
- Chart on Global - Market size and forecast 2023-2028 ($ million)
- Data Table on Global - Market size and forecast 2023-2028 ($ million)
- Chart on Global Market: Year-over-year growth 2023-2028 (%)
- Data Table on Global Market: Year-over-year growth 2023-2028 (%)
4 Historic Market Size
- 4.1 Global Poly(Lactic-Co-Glycolic Acid) (PLGA) Market 2018 - 2022
- Historic Market Size - Data Table on Global Poly(Lactic-Co-Glycolic Acid) (PLGA) Market 2018 - 2022 ($ million)
- 4.2 Application segment analysis 2018 - 2022
- Historic Market Size - Application Segment 2018 - 2022 ($ million)
- 4.3 Type segment analysis 2018 - 2022
- Historic Market Size - Type Segment 2018 - 2022 ($ million)
- 4.4 Geography segment analysis 2018 - 2022
- Historic Market Size - Geography Segment 2018 - 2022 ($ million)
- 4.5 Country segment analysis 2018 - 2022
- Historic Market Size - Country Segment 2018 - 2022 ($ million)
5 Five Forces Analysis
- 5.1 Five forces summary
- Five forces analysis - Comparison between 2023 and 2028
- 5.2 Bargaining power of buyers
- Bargaining power of buyers - Impact of key factors 2023 and 2028
- 5.3 Bargaining power of suppliers
- Bargaining power of suppliers - Impact of key factors in 2023 and 2028
- 5.4 Threat of new entrants
- Threat of new entrants - Impact of key factors in 2023 and 2028
- 5.5 Threat of substitutes
- Threat of substitutes - Impact of key factors in 2023 and 2028
- 5.6 Threat of rivalry
- Threat of rivalry - Impact of key factors in 2023 and 2028
- 5.7 Market condition
- Chart on Market condition - Five forces 2023 and 2028
6 Market Segmentation by Application
- 6.1 Market segments
- Chart on Application - Market share 2023-2028 (%)
- Data Table on Application - Market share 2023-2028 (%)
- 6.2 Comparison by Application
- Chart on Comparison by Application
- Data Table on Comparison by Application
- 6.3 Personal care and dermatology - Market size and forecast 2023-2028
- Chart on Personal care and dermatology - Market size and forecast 2023-2028 ($ million)
- Data Table on Personal care and dermatology - Market size and forecast 2023-2028 ($ million)
- Chart on Personal care and dermatology - Year-over-year growth 2023-2028 (%)
- Data Table on Personal care and dermatology - Year-over-year growth 2023-2028 (%)
- 6.4 Suture - Market size and forecast 2023-2028
- Chart on Suture - Market size and forecast 2023-2028 ($ million)
- Data Table on Suture - Market size and forecast 2023-2028 ($ million)
- Chart on Suture - Year-over-year growth 2023-2028 (%)
- Data Table on Suture - Year-over-year growth 2023-2028 (%)
- 6.5 Fracture fixation - Market size and forecast 2023-2028
- Chart on Fracture fixation - Market size and forecast 2023-2028 ($ million)
- Data Table on Fracture fixation - Market size and forecast 2023-2028 ($ million)
- Chart on Fracture fixation - Year-over-year growth 2023-2028 (%)
- Data Table on Fracture fixation - Year-over-year growth 2023-2028 (%)
- 6.6 Others - Market size and forecast 2023-2028
- Chart on Others - Market size and forecast 2023-2028 ($ million)
- Data Table on Others - Market size and forecast 2023-2028 ($ million)
- Chart on Others - Year-over-year growth 2023-2028 (%)
- Data Table on Others - Year-over-year growth 2023-2028 (%)
- 6.7 Market opportunity by Application
- Market opportunity by Application ($ million)
- Data Table on Market opportunity by Application ($ million)
7 Market Segmentation by Type
- 7.1 Market segments
- Chart on Type - Market share 2023-2028 (%)
- Data Table on Type - Market share 2023-2028 (%)
- 7.2 Comparison by Type
- Chart on Comparison by Type
- Data Table on Comparison by Type
- 7.3 PLGA 50:50 - Market size and forecast 2023-2028
- Chart on PLGA 50:50 - Market size and forecast 2023-2028 ($ million)
- Data Table on PLGA 50:50 - Market size and forecast 2023-2028 ($ million)
- Chart on PLGA 50:50 - Year-over-year growth 2023-2028 (%)
- Data Table on PLGA 50:50 - Year-over-year growth 2023-2028 (%)
- 7.4 PLGA 75:25 - Market size and forecast 2023-2028
- Chart on PLGA 75:25 - Market size and forecast 2023-2028 ($ million)
- Data Table on PLGA 75:25 - Market size and forecast 2023-2028 ($ million)
- Chart on PLGA 75:25 - Year-over-year growth 2023-2028 (%)
- Data Table on PLGA 75:25 - Year-over-year growth 2023-2028 (%)
- 7.5 PLGA 85:15 - Market size and forecast 2023-2028
- Chart on PLGA 85:15 - Market size and forecast 2023-2028 ($ million)
- Data Table on PLGA 85:15 - Market size and forecast 2023-2028 ($ million)
- Chart on PLGA 85:15 - Year-over-year growth 2023-2028 (%)
- Data Table on PLGA 85:15 - Year-over-year growth 2023-2028 (%)
- 7.6 PLGA 65:35 - Market size and forecast 2023-2028
- Chart on PLGA 65:35 - Market size and forecast 2023-2028 ($ million)
- Data Table on PLGA 65:35 - Market size and forecast 2023-2028 ($ million)
- Chart on PLGA 65:35 - Year-over-year growth 2023-2028 (%)
- Data Table on PLGA 65:35 - Year-over-year growth 2023-2028 (%)
- 7.7 Market opportunity by Type
- Market opportunity by Type ($ million)
- Data Table on Market opportunity by Type ($ million)
8 Customer Landscape
- 8.1 Customer landscape overview
- Analysis of price sensitivity, lifecycle, customer purchase basket, adoption rates, and purchase criteria
9 Geographic Landscape
- 9.1 Geographic segmentation
- Chart on Market share By Geographical Landscape 2023-2028 (%)
- Data Table on Market share By Geographical Landscape 2023-2028 (%)
- 9.2 Geographic comparison
- Chart on Geographic comparison
- Data Table on Geographic comparison
- 9.3 North America - Market size and forecast 2023-2028
- Chart on North America - Market size and forecast 2023-2028 ($ million)
- Data Table on North America - Market size and forecast 2023-2028 ($ million)
- Chart on North America - Year-over-year growth 2023-2028 (%)
- Data Table on North America - Year-over-year growth 2023-2028 (%)
- 9.4 Europe - Market size and forecast 2023-2028
- Chart on Europe - Market size and forecast 2023-2028 ($ million)
- Data Table on Europe - Market size and forecast 2023-2028 ($ million)
- Chart on Europe - Year-over-year growth 2023-2028 (%)
- Data Table on Europe - Year-over-year growth 2023-2028 (%)
- 9.5 APAC - Market size and forecast 2023-2028
- Chart on APAC - Market size and forecast 2023-2028 ($ million)
- Data Table on APAC - Market size and forecast 2023-2028 ($ million)
- Chart on APAC - Year-over-year growth 2023-2028 (%)
- Data Table on APAC - Year-over-year growth 2023-2028 (%)
- 9.6 South America - Market size and forecast 2023-2028
- Chart on South America - Market size and forecast 2023-2028 ($ million)
- Data Table on South America - Market size and forecast 2023-2028 ($ million)
- Chart on South America - Year-over-year growth 2023-2028 (%)
- Data Table on South America - Year-over-year growth 2023-2028 (%)
- 9.7 Middle East and Africa - Market size and forecast 2023-2028
- Chart on Middle East and Africa - Market size and forecast 2023-2028 ($ million)
- Data Table on Middle East and Africa - Market size and forecast 2023-2028 ($ million)
- Chart on Middle East and Africa - Year-over-year growth 2023-2028 (%)
- Data Table on Middle East and Africa - Year-over-year growth 2023-2028 (%)
- 9.8 US - Market size and forecast 2023-2028
- Chart on US - Market size and forecast 2023-2028 ($ million)
- Data Table on US - Market size and forecast 2023-2028 ($ million)
- Chart on US - Year-over-year growth 2023-2028 (%)
- Data Table on US - Year-over-year growth 2023-2028 (%)
- 9.9 UK - Market size and forecast 2023-2028
- Chart on UK - Market size and forecast 2023-2028 ($ million)
- Data Table on UK - Market size and forecast 2023-2028 ($ million)
- Chart on UK - Year-over-year growth 2023-2028 (%)
- Data Table on UK - Year-over-year growth 2023-2028 (%)
- 9.10 China - Market size and forecast 2023-2028
- Chart on China - Market size and forecast 2023-2028 ($ million)
- Data Table on China - Market size and forecast 2023-2028 ($ million)
- Chart on China - Year-over-year growth 2023-2028 (%)
- Data Table on China - Year-over-year growth 2023-2028 (%)
- 9.11 Germany - Market size and forecast 2023-2028
- Chart on Germany - Market size and forecast 2023-2028 ($ million)
- Data Table on Germany - Market size and forecast 2023-2028 ($ million)
- Chart on Germany - Year-over-year growth 2023-2028 (%)
- Data Table on Germany - Year-over-year growth 2023-2028 (%)
- 9.12 France - Market size and forecast 2023-2028
- Chart on France - Market size and forecast 2023-2028 ($ million)
- Data Table on France - Market size and forecast 2023-2028 ($ million)
- Chart on France - Year-over-year growth 2023-2028 (%)
- Data Table on France - Year-over-year growth 2023-2028 (%)
- 9.13 Market opportunity By Geographical Landscape
- Market opportunity By Geographical Landscape ($ million)
- Data Tables on Market opportunity By Geographical Landscape ($ million)
10 Drivers, Challenges, and Opportunity/Restraints
- 10.1 Market drivers
- 10.2 Market challenges
- 10.3 Impact of drivers and challenges
- Impact of drivers and challenges in 2023 and 2028
- 10.4 Market opportunities/restraints
11 Competitive Landscape
- 11.1 Overview
- 11.2 Competitive Landscape
- Overview on criticality of inputs and factors of differentiation
- 11.3 Landscape disruption
- Overview on factors of disruption
- 11.4 Industry risks
- Impact of key risks on business
12 Competitive Analysis
- 12.1 Companies profiled
- Companies covered
- 12.2 Market positioning of companies
- Matrix on companies position and classification
- 12.3 Ashland Inc.
- Ashland Inc. - Overview
- Ashland Inc. - Business segments
- Ashland Inc. - Key news
- Ashland Inc. - Key offerings
- Ashland Inc. - Segment focus
- 12.4 Bezwada Biomedical LLC
- Bezwada Biomedical LLC - Overview
- Bezwada Biomedical LLC - Product / Service
- Bezwada Biomedical LLC - Key offerings
- 12.5 CD Bioparticles
- CD Bioparticles - Overview
- CD Bioparticles - Product / Service
- CD Bioparticles - Key offerings
- 12.6 Corbion nv
- Corbion nv - Overview
- Corbion nv - Business segments
- Corbion nv - Key news
- Corbion nv - Key offerings
- Corbion nv - Segment focus
- 12.7 Evonik Industries AG
- Evonik Industries AG - Overview
- Evonik Industries AG - Business segments
- Evonik Industries AG - Key news
- Evonik Industries AG - Key offerings
- Evonik Industries AG - Segment focus
- 12.8 Foster Corp.
- Foster Corp. - Overview
- Foster Corp. - Product / Service
- Foster Corp. - Key offerings
- 12.9 Huizhou Foryou Medical Devices Co. Ltd.
- Huizhou Foryou Medical Devices Co. Ltd. - Overview
- Huizhou Foryou Medical Devices Co. Ltd. - Product / Service
- Huizhou Foryou Medical Devices Co. Ltd. - Key offerings
- 12.10 Koninklijke DSM NV
- Koninklijke DSM NV - Overview
- Koninklijke DSM NV - Business segments
- Koninklijke DSM NV - Key news
- Koninklijke DSM NV - Key offerings
- Koninklijke DSM NV - Segment focus
- 12.11 Merck KGaA
- Merck KGaA - Overview
- Merck KGaA - Business segments
- Merck KGaA - Key news
- Merck KGaA - Key offerings
- Merck KGaA - Segment focus
- 12.12 Mitsui Chemicals Inc.
- Mitsui Chemicals Inc. - Overview
- Mitsui Chemicals Inc. - Business segments
- Mitsui Chemicals Inc. - Key offerings
- Mitsui Chemicals Inc. - Segment focus
- 12.13 Nomisma Healthcare Pvt. Ltd.
- Nomisma Healthcare Pvt. Ltd. - Overview
- Nomisma Healthcare Pvt. Ltd. - Product / Service
- Nomisma Healthcare Pvt. Ltd. - Key offerings
- 12.14 Poly Med Inc.
- Poly Med Inc. - Overview
- Poly Med Inc. - Product / Service
- Poly Med Inc. - Key offerings
- 12.15 Polysciences Inc.
- Polysciences Inc. - Overview
- Polysciences Inc. - Product / Service
- Polysciences Inc. - Key offerings
- 12.16 SEQENS GROUP
- SEQENS GROUP - Overview
- SEQENS GROUP - Product / Service
- SEQENS GROUP - Key offerings
- 12.17 Zeus Co. Inc.
- Zeus Co. Inc. - Overview
- Zeus Co. Inc. - Product / Service
- Zeus Co. Inc. - Key offerings
13 Appendix
- 13.1 Scope of the report
- 13.2 Inclusions and exclusions checklist
- Inclusions checklist
- Exclusions checklist
- 13.3 Currency conversion rates for US$
- Currency conversion rates for US$
- 13.4 Research methodology
- Research methodology
- 13.5 Data procurement
- Information sources
- 13.6 Data validation
- Data validation
- 13.7 Validation techniques employed for market sizing
- Validation techniques employed for market sizing
- 13.8 Data synthesis
- Data synthesis
- 13.9 360 degree market analysis
- 360 degree market analysis
- 13.10 List of abbreviations
- List of abbreviations

