|
|
市場調査レポート
商品コード
1544410
BCL-2(b細胞リンパ腫2)阻害剤の世界市場、2024~2028年Global BCL-2 (b-cell Lymphoma 2) Inhibitors Market 2024-2028 |
||||||

|
|||||||
カスタマイズ可能
|
|||||||


| BCL-2(b細胞リンパ腫2)阻害剤の世界市場、2024~2028年 |
|
出版日: 2024年07月23日
発行: TechNavio
ページ情報: 英文 175 Pages
納期: 即納可能
|

全表示
- 概要
- 図表
- 目次
BCL-2(b細胞リンパ腫2)阻害剤市場は2023~2028年に22億8,890万米ドル、予測期間中のCAGRは15.2%で成長すると予測されます。
当レポートでは、BCL-2(b細胞リンパ腫2)阻害剤市場の全体的な分析、市場規模・予測、動向、成長促進要因、課題、約25のベンダーを網羅したベンダー分析などを掲載しています。
現在の市場シナリオ、最新動向と促進要因、市場環境全体に関する最新分析を提供しています。市場は、世界の高齢者人口の増加、血液悪性腫瘍に対する意識の高まり、BCL-2阻害剤の高い標的親和性と特異性によって牽引されています。
| 市場範囲 | |
|---|---|
| 基準年 | 2024年 |
| 終了年 | 2028年 |
| 予測期間 | 2024~2028年 |
| 成長モメンタム | 加速 |
| 前年比[2024年] | 12.86% |
| CAGR | 15.2% |
| 増分額 | 22億8,890万米ドル |
本調査では、患者支援プログラムの増加が今後数年間のBCL-2(b細胞リンパ腫2)阻害剤市場成長を牽引する主要因の1つであるとしています。また、併用療法の承認拡大や新規製剤の市場開拓の増加は、市場の大きな需要につながります。
目次
第1章 エグゼクティブサマリー
- 市場概要
第2章 市場情勢
- 市場エコシステム
- 市場の特徴
- バリューチェーン分析
第3章 市場規模の評価
- 市場の定義
- 市場セグメント分析
- 市場規模 2023年
- 市場の展望 2023~2028年
第4章 市場規模実績
- BCL-2(b細胞リンパ腫2)阻害剤の世界市場 2018~2022年
- 製品別セグメント分析 2018~2022年
- タイプ別セグメント分析 2018~2022年
- 地域別セグメント分析 2018~2022年
- 国別セグメント分析 2018~2022年
第5章 ファイブフォース分析
- ファイブフォースの要約
- 買い手の交渉力
- 供給企業の交渉力
- 新規参入業者の脅威
- 代替品の脅威
- 競争の脅威
- 市況
第6章 市場セグメンテーション:製品別
- 市場セグメンテーション
- 比較:製品別
- 併用療法:市場規模と予測 2023~2028年
- 単独療法:市場規模と予測 2023~2028年
- 市場機会:製品別
第7章 市場セグメンテーション:タイプ別
- 市場セグメンテーション
- 比較:タイプ別
- びまん性大細胞型B細胞リンパ腫(DLBCL):市場規模と予測 2023~2028年
- 濾胞性リンパ腫:市場規模と予測 2023~2028年
- 慢性リンパ性白血病:市場規模と予測 2023~2028年
- マントル細胞リンパ腫(MCL):市場規模と予測 2023~2028年
- 市場機会:タイプ別
第8章 顧客情勢
- 顧客情勢概要
第9章 地域別情勢
- 地域別セグメンテーション
- 比較:地域別
- 北米:市場規模と予測 2023~2028年
- 欧州:市場規模と予測 2023~2028年
- アジア:市場規模と予測 2023~2028年
- その他:市場規模と予測 2023~2028年
- 米国:市場規模と予測 2023~2028年
- カナダ:市場規模と予測 2023~2028年
- ドイツ:市場規模と予測 2023~2028年
- 英国:市場規模と予測 2023~2028年
- フランス:市場規模と予測 2023~2028年
- 市場機会:地域情勢別
第10章 促進要因・課題・機会・抑制要因
- 市場促進要因
- 市場課題
- 促進要因と課題の影響
- 市場の機会・抑制要因
第11章 競合情勢
- 概要
- 競合情勢
- 混乱の状況
- 業界のリスク
第12章 競合分析
- 企業プロファイル
- 企業の市場ポジショニング
- AbbVie Inc.
- Danaher Corp.
- Amgen Inc.
- Ascentage Pharma Group International
- AstraZeneca Plc
- BeiGene Ltd.
- Bio Techne Corp.
- Biorbyt Ltd.
- Bristol Myers Squibb Co.
- F. Hoffmann La Roche Ltd.
- Merck and Co. Inc.
- Novartis AG
- Santa Cruz Biotechnology Inc.
- Seagen Inc.
- Les Laboratoires Servier
第13章 付録
Exhibits:
- Exhibits1: Executive Summary - Chart on Market Overview
- Exhibits2: Executive Summary - Data Table on Market Overview
- Exhibits3: Executive Summary - Chart on Global Market Characteristics
- Exhibits4: Executive Summary - Chart on Market By Geographical Landscape
- Exhibits5: Executive Summary - Chart on Market Segmentation by Product
- Exhibits6: Executive Summary - Chart on Market Segmentation by Type
- Exhibits7: Executive Summary - Chart on Incremental Growth
- Exhibits8: Executive Summary - Data Table on Incremental Growth
- Exhibits9: Executive Summary - Chart on Company Market Positioning
- Exhibits10: Parent Market
- Exhibits11: Data Table on - Parent Market
- Exhibits12: Market characteristics analysis
- Exhibits13: Value Chain Analysis
- Exhibits14: Offerings of companies included in the market definition
- Exhibits15: Market segments
- Exhibits16: Chart on Global - Market size and forecast 2023-2028 ($ million)
- Exhibits17: Data Table on Global - Market size and forecast 2023-2028 ($ million)
- Exhibits18: Chart on Global Market: Year-over-year growth 2023-2028 (%)
- Exhibits19: Data Table on Global Market: Year-over-year growth 2023-2028 (%)
- Exhibits20: Historic Market Size - Data Table on Global BCL-2 (B-Cell Lymphoma 2) Inhibitors Market 2018 - 2022 ($ million)
- Exhibits21: Historic Market Size - Product Segment 2018 - 2022 ($ million)
- Exhibits22: Historic Market Size - Type Segment 2018 - 2022 ($ million)
- Exhibits23: Historic Market Size - Geography Segment 2018 - 2022 ($ million)
- Exhibits24: Historic Market Size - Country Segment 2018 - 2022 ($ million)
- Exhibits25: Five forces analysis - Comparison between 2023 and 2028
- Exhibits26: Bargaining power of buyers - Impact of key factors 2023 and 2028
- Exhibits27: Bargaining power of suppliers - Impact of key factors in 2023 and 2028
- Exhibits28: Threat of new entrants - Impact of key factors in 2023 and 2028
- Exhibits29: Threat of substitutes - Impact of key factors in 2023 and 2028
- Exhibits30: Threat of rivalry - Impact of key factors in 2023 and 2028
- Exhibits31: Chart on Market condition - Five forces 2023 and 2028
- Exhibits32: Chart on Product - Market share 2023-2028 (%)
- Exhibits33: Data Table on Product - Market share 2023-2028 (%)
- Exhibits34: Chart on Comparison by Product
- Exhibits35: Data Table on Comparison by Product
- Exhibits36: Chart on Combination therapy - Market size and forecast 2023-2028 ($ million)
- Exhibits37: Data Table on Combination therapy - Market size and forecast 2023-2028 ($ million)
- Exhibits38: Chart on Combination therapy - Year-over-year growth 2023-2028 (%)
- Exhibits39: Data Table on Combination therapy - Year-over-year growth 2023-2028 (%)
- Exhibits40: Chart on Monotherapy - Market size and forecast 2023-2028 ($ million)
- Exhibits41: Data Table on Monotherapy - Market size and forecast 2023-2028 ($ million)
- Exhibits42: Chart on Monotherapy - Year-over-year growth 2023-2028 (%)
- Exhibits43: Data Table on Monotherapy - Year-over-year growth 2023-2028 (%)
- Exhibits44: Market opportunity by Product ($ million)
- Exhibits45: Data Table on Market opportunity by Product ($ million)
- Exhibits46: Chart on Type - Market share 2023-2028 (%)
- Exhibits47: Data Table on Type - Market share 2023-2028 (%)
- Exhibits48: Chart on Comparison by Type
- Exhibits49: Data Table on Comparison by Type
- Exhibits50: Chart on Diffuse large B-cell lymphoma (DLBCL) - Market size and forecast 2023-2028 ($ million)
- Exhibits51: Data Table on Diffuse large B-cell lymphoma (DLBCL) - Market size and forecast 2023-2028 ($ million)
- Exhibits52: Chart on Diffuse large B-cell lymphoma (DLBCL) - Year-over-year growth 2023-2028 (%)
- Exhibits53: Data Table on Diffuse large B-cell lymphoma (DLBCL) - Year-over-year growth 2023-2028 (%)
- Exhibits54: Chart on Follicular lymphoma - Market size and forecast 2023-2028 ($ million)
- Exhibits55: Data Table on Follicular lymphoma - Market size and forecast 2023-2028 ($ million)
- Exhibits56: Chart on Follicular lymphoma - Year-over-year growth 2023-2028 (%)
- Exhibits57: Data Table on Follicular lymphoma - Year-over-year growth 2023-2028 (%)
- Exhibits58: Chart on Chronic lymphocytic leukemia - Market size and forecast 2023-2028 ($ million)
- Exhibits59: Data Table on Chronic lymphocytic leukemia - Market size and forecast 2023-2028 ($ million)
- Exhibits60: Chart on Chronic lymphocytic leukemia - Year-over-year growth 2023-2028 (%)
- Exhibits61: Data Table on Chronic lymphocytic leukemia - Year-over-year growth 2023-2028 (%)
- Exhibits62: Chart on Mantle cell lymphoma (MCL) - Market size and forecast 2023-2028 ($ million)
- Exhibits63: Data Table on Mantle cell lymphoma (MCL) - Market size and forecast 2023-2028 ($ million)
- Exhibits64: Chart on Mantle cell lymphoma (MCL) - Year-over-year growth 2023-2028 (%)
- Exhibits65: Data Table on Mantle cell lymphoma (MCL) - Year-over-year growth 2023-2028 (%)
- Exhibits66: Market opportunity by Type ($ million)
- Exhibits67: Data Table on Market opportunity by Type ($ million)
- Exhibits68: Analysis of price sensitivity, lifecycle, customer purchase basket, adoption rates, and purchase criteria
- Exhibits69: Chart on Market share By Geographical Landscape 2023-2028 (%)
- Exhibits70: Data Table on Market share By Geographical Landscape 2023-2028 (%)
- Exhibits71: Chart on Geographic comparison
- Exhibits72: Data Table on Geographic comparison
- Exhibits73: Chart on North America - Market size and forecast 2023-2028 ($ million)
- Exhibits74: Data Table on North America - Market size and forecast 2023-2028 ($ million)
- Exhibits75: Chart on North America - Year-over-year growth 2023-2028 (%)
- Exhibits76: Data Table on North America - Year-over-year growth 2023-2028 (%)
- Exhibits77: Chart on Europe - Market size and forecast 2023-2028 ($ million)
- Exhibits78: Data Table on Europe - Market size and forecast 2023-2028 ($ million)
- Exhibits79: Chart on Europe - Year-over-year growth 2023-2028 (%)
- Exhibits80: Data Table on Europe - Year-over-year growth 2023-2028 (%)
- Exhibits81: Chart on Asia - Market size and forecast 2023-2028 ($ million)
- Exhibits82: Data Table on Asia - Market size and forecast 2023-2028 ($ million)
- Exhibits83: Chart on Asia - Year-over-year growth 2023-2028 (%)
- Exhibits84: Data Table on Asia - Year-over-year growth 2023-2028 (%)
- Exhibits85: Chart on Rest of World (ROW) - Market size and forecast 2023-2028 ($ million)
- Exhibits86: Data Table on Rest of World (ROW) - Market size and forecast 2023-2028 ($ million)
- Exhibits87: Chart on Rest of World (ROW) - Year-over-year growth 2023-2028 (%)
- Exhibits88: Data Table on Rest of World (ROW) - Year-over-year growth 2023-2028 (%)
- Exhibits89: Chart on US - Market size and forecast 2023-2028 ($ million)
- Exhibits90: Data Table on US - Market size and forecast 2023-2028 ($ million)
- Exhibits91: Chart on US - Year-over-year growth 2023-2028 (%)
- Exhibits92: Data Table on US - Year-over-year growth 2023-2028 (%)
- Exhibits93: Chart on Canada - Market size and forecast 2023-2028 ($ million)
- Exhibits94: Data Table on Canada - Market size and forecast 2023-2028 ($ million)
- Exhibits95: Chart on Canada - Year-over-year growth 2023-2028 (%)
- Exhibits96: Data Table on Canada - Year-over-year growth 2023-2028 (%)
- Exhibits97: Chart on Germany - Market size and forecast 2023-2028 ($ million)
- Exhibits98: Data Table on Germany - Market size and forecast 2023-2028 ($ million)
- Exhibits99: Chart on Germany - Year-over-year growth 2023-2028 (%)
- Exhibits100: Data Table on Germany - Year-over-year growth 2023-2028 (%)
- Exhibits101: Chart on UK - Market size and forecast 2023-2028 ($ million)
- Exhibits102: Data Table on UK - Market size and forecast 2023-2028 ($ million)
- Exhibits103: Chart on UK - Year-over-year growth 2023-2028 (%)
- Exhibits104: Data Table on UK - Year-over-year growth 2023-2028 (%)
- Exhibits105: Chart on France - Market size and forecast 2023-2028 ($ million)
- Exhibits106: Data Table on France - Market size and forecast 2023-2028 ($ million)
- Exhibits107: Chart on France - Year-over-year growth 2023-2028 (%)
- Exhibits108: Data Table on France - Year-over-year growth 2023-2028 (%)
- Exhibits109: Market opportunity By Geographical Landscape ($ million)
- Exhibits110: Data Tables on Market opportunity By Geographical Landscape ($ million)
- Exhibits111: Impact of drivers and challenges in 2023 and 2028
- Exhibits112: Overview on criticality of inputs and factors of differentiation
- Exhibits113: Overview on factors of disruption
- Exhibits114: Impact of key risks on business
- Exhibits115: Companies covered
- Exhibits116: Matrix on companies position and classification
- Exhibits117: AbbVie Inc. - Overview
- Exhibits118: AbbVie Inc. - Product / Service
- Exhibits119: AbbVie Inc. - Key news
- Exhibits120: AbbVie Inc. - Key offerings
- Exhibits121: Danaher Corp. - Overview
- Exhibits122: Danaher Corp. - Business segments
- Exhibits123: Danaher Corp. - Key news
- Exhibits124: Danaher Corp. - Key offerings
- Exhibits125: Danaher Corp. - Segment focus
- Exhibits126: Amgen Inc. - Overview
- Exhibits127: Amgen Inc. - Product / Service
- Exhibits128: Amgen Inc. - Key news
- Exhibits129: Amgen Inc. - Key offerings
- Exhibits130: Ascentage Pharma Group International - Overview
- Exhibits131: Ascentage Pharma Group International - Product / Service
- Exhibits132: Ascentage Pharma Group International - Key offerings
- Exhibits133: AstraZeneca Plc - Overview
- Exhibits134: AstraZeneca Plc - Product / Service
- Exhibits135: AstraZeneca Plc - Key news
- Exhibits136: AstraZeneca Plc - Key offerings
- Exhibits137: BeiGene Ltd. - Overview
- Exhibits138: BeiGene Ltd. - Business segments
- Exhibits139: BeiGene Ltd. - Key offerings
- Exhibits140: BeiGene Ltd. - Segment focus
- Exhibits141: Bio Techne Corp. - Overview
- Exhibits142: Bio Techne Corp. - Business segments
- Exhibits143: Bio Techne Corp. - Key news
- Exhibits144: Bio Techne Corp. - Key offerings
- Exhibits145: Bio Techne Corp. - Segment focus
- Exhibits146: Biorbyt Ltd. - Overview
- Exhibits147: Biorbyt Ltd. - Product / Service
- Exhibits148: Biorbyt Ltd. - Key offerings
- Exhibits149: Bristol Myers Squibb Co. - Overview
- Exhibits150: Bristol Myers Squibb Co. - Product / Service
- Exhibits151: Bristol Myers Squibb Co. - Key news
- Exhibits152: Bristol Myers Squibb Co. - Key offerings
- Exhibits153: F. Hoffmann La Roche Ltd. - Overview
- Exhibits154: F. Hoffmann La Roche Ltd. - Business segments
- Exhibits155: F. Hoffmann La Roche Ltd. - Key news
- Exhibits156: F. Hoffmann La Roche Ltd. - Key offerings
- Exhibits157: F. Hoffmann La Roche Ltd. - Segment focus
- Exhibits158: Merck and Co. Inc. - Overview
- Exhibits159: Merck and Co. Inc. - Business segments
- Exhibits160: Merck and Co. Inc. - Key news
- Exhibits161: Merck and Co. Inc. - Key offerings
- Exhibits162: Merck and Co. Inc. - Segment focus
- Exhibits163: Novartis AG - Overview
- Exhibits164: Novartis AG - Business segments
- Exhibits165: Novartis AG - Key news
- Exhibits166: Novartis AG - Key offerings
- Exhibits167: Novartis AG - Segment focus
- Exhibits168: Santa Cruz Biotechnology Inc. - Overview
- Exhibits169: Santa Cruz Biotechnology Inc. - Product / Service
- Exhibits170: Santa Cruz Biotechnology Inc. - Key offerings
- Exhibits171: Seagen Inc. - Overview
- Exhibits172: Seagen Inc. - Key offerings
- Exhibits173: Les Laboratoires Servier - Overview
- Exhibits174: Les Laboratoires Servier - Business segments
- Exhibits175: Les Laboratoires Servier - Key offerings
- Exhibits176: Les Laboratoires Servier - Segment focus
- Exhibits177: Inclusions checklist
- Exhibits178: Exclusions checklist
- Exhibits179: Currency conversion rates for US$
- Exhibits180: Research methodology
- Exhibits181: Information sources
- Exhibits182: Data validation
- Exhibits183: Validation techniques employed for market sizing
- Exhibits184: Data synthesis
- Exhibits185: 360 degree market analysis
- Exhibits186: List of abbreviations
The BCL-2 (B-Cell Lymphoma 2) inhibitors market is forecasted to grow by USD 2288.9 mn during 2023-2028, accelerating at a CAGR of 15.2% during the forecast period. The report on the BCL-2 (B-Cell Lymphoma 2) inhibitors market provides a holistic analysis, market size and forecast, trends, growth drivers, and challenges, as well as vendor analysis covering around 25 vendors.
The report offers an up-to-date analysis regarding the current market scenario, the latest trends and drivers, and the overall market environment. The market is driven by rising geriatric population globally, growing awareness about hematological malignancies, and high target affinity and specificity of BCL-2 inhibitors.
Technavio's BCL-2 (B-Cell Lymphoma 2) inhibitors market is segmented as below:
| Market Scope | |
|---|---|
| Base Year | 2024 |
| End Year | 2028 |
| Series Year | 2024-2028 |
| Growth Momentum | Accelerate |
| YOY 2024 | 12.86% |
| CAGR | 15.2% |
| Incremental Value | $2288.9 mn |
By Product
- Combination therapy
- Monotherapy
By Type
- Diffuse large B-cell lymphoma (DLBCL)
- Follicular lymphoma
- Chronic lymphocytic leukemia
- Mantle cell lymphoma (MCL)
By Geographical Landscape
- North America
- Europe
- Asia
- Rest of World (ROW)
This study identifies the increase in number of patient assistance programs as one of the prime reasons driving the BCL-2 (B-Cell Lymphoma 2) inhibitors market growth during the next few years. Also, growing approval of combination therapy and increase in development of novel formulations will lead to sizable demand in the market.
The report on the BCL-2 (B-Cell Lymphoma 2) inhibitors market covers the following areas:
- BCL-2 (B-Cell Lymphoma 2) inhibitors market sizing
- BCL-2 (B-Cell Lymphoma 2) inhibitors market forecast
- BCL-2 (B-Cell Lymphoma 2) inhibitors market industry analysis
The robust vendor analysis is designed to help clients improve their market position, and in line with this, this report provides a detailed analysis of several leading BCL-2 (B-Cell Lymphoma 2) inhibitors market vendors that include AbbVie Inc., Danaher Corp., Amgen Inc., Ascentage Pharma Group International, AstraZeneca PLC, BeiGene Ltd., Bio Techne Corp., Biorbyt Ltd., Bristol Myers Squibb Co., F. Hoffmann La Roche Ltd., Ipsen Pharma, Merck and Co. Inc., Novartis AG, Santa Cruz Biotechnology Inc., Seagen Inc., Les Laboratoires Servier, and Eli Lilly and Co.. Also, the BCL-2 (B-Cell Lymphoma 2) inhibitors market analysis report includes information on upcoming trends and challenges that will influence market growth. This is to help companies strategize and leverage all forthcoming growth opportunities.
The study was conducted using an objective combination of primary and secondary information including inputs from key participants in the industry. The report contains a comprehensive market and vendor landscape in addition to an analysis of the key vendors.
The publisher presents a detailed picture of the market by the way of study, synthesis, and summation of data from multiple sources by an analysis of key parameters such as profit, pricing, competition, and promotions. It presents various market facets by identifying the key industry influencers. The data presented is comprehensive, reliable, and a result of extensive research - both primary and secondary. The market research reports provide a complete competitive landscape and an in-depth vendor selection methodology and analysis using qualitative and quantitative research to forecast the accurate market growth.
Table of Contents
1 Executive Summary
- 1.1 Market overview
- Executive Summary - Chart on Market Overview
- Executive Summary - Data Table on Market Overview
- Executive Summary - Chart on Global Market Characteristics
- Executive Summary - Chart on Market By Geographical Landscape
- Executive Summary - Chart on Market Segmentation by Product
- Executive Summary - Chart on Market Segmentation by Type
- Executive Summary - Chart on Incremental Growth
- Executive Summary - Data Table on Incremental Growth
- Executive Summary - Chart on Company Market Positioning
2 Market Landscape
- 2.1 Market ecosystem
- Parent Market
- Data Table on - Parent Market
- 2.2 Market characteristics
- Market characteristics analysis
- 2.3 Value chain analysis
- Value Chain Analysis
3 Market Sizing
- 3.1 Market definition
- Offerings of companies included in the market definition
- 3.2 Market segment analysis
- Market segments
- 3.3 Market size 2023
- 3.4 Market outlook: Forecast for 2023-2028
- Chart on Global - Market size and forecast 2023-2028 ($ million)
- Data Table on Global - Market size and forecast 2023-2028 ($ million)
- Chart on Global Market: Year-over-year growth 2023-2028 (%)
- Data Table on Global Market: Year-over-year growth 2023-2028 (%)
4 Historic Market Size
- 4.1 Global BCL-2 (B-Cell Lymphoma 2) Inhibitors Market 2018 - 2022
- Historic Market Size - Data Table on Global BCL-2 (B-Cell Lymphoma 2) Inhibitors Market 2018 - 2022 ($ million)
- 4.2 Product segment analysis 2018 - 2022
- Historic Market Size - Product Segment 2018 - 2022 ($ million)
- 4.3 Type segment analysis 2018 - 2022
- Historic Market Size - Type Segment 2018 - 2022 ($ million)
- 4.4 Geography segment analysis 2018 - 2022
- Historic Market Size - Geography Segment 2018 - 2022 ($ million)
- 4.5 Country segment analysis 2018 - 2022
- Historic Market Size - Country Segment 2018 - 2022 ($ million)
5 Five Forces Analysis
- 5.1 Five forces summary
- Five forces analysis - Comparison between 2023 and 2028
- 5.2 Bargaining power of buyers
- Bargaining power of buyers - Impact of key factors 2023 and 2028
- 5.3 Bargaining power of suppliers
- Bargaining power of suppliers - Impact of key factors in 2023 and 2028
- 5.4 Threat of new entrants
- Threat of new entrants - Impact of key factors in 2023 and 2028
- 5.5 Threat of substitutes
- Threat of substitutes - Impact of key factors in 2023 and 2028
- 5.6 Threat of rivalry
- Threat of rivalry - Impact of key factors in 2023 and 2028
- 5.7 Market condition
- Chart on Market condition - Five forces 2023 and 2028
6 Market Segmentation by Product
- 6.1 Market segments
- Chart on Product - Market share 2023-2028 (%)
- Data Table on Product - Market share 2023-2028 (%)
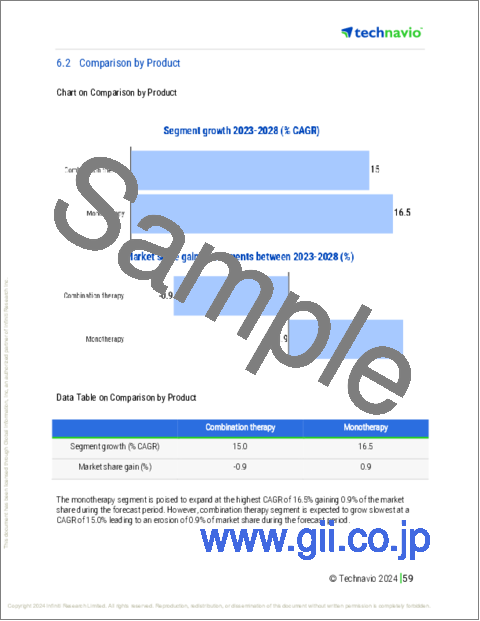
- 6.2 Comparison by Product
- Chart on Comparison by Product
- Data Table on Comparison by Product
- 6.3 Combination therapy - Market size and forecast 2023-2028
- Chart on Combination therapy - Market size and forecast 2023-2028 ($ million)
- Data Table on Combination therapy - Market size and forecast 2023-2028 ($ million)
- Chart on Combination therapy - Year-over-year growth 2023-2028 (%)
- Data Table on Combination therapy - Year-over-year growth 2023-2028 (%)
- 6.4 Monotherapy - Market size and forecast 2023-2028
- Chart on Monotherapy - Market size and forecast 2023-2028 ($ million)
- Data Table on Monotherapy - Market size and forecast 2023-2028 ($ million)
- Chart on Monotherapy - Year-over-year growth 2023-2028 (%)
- Data Table on Monotherapy - Year-over-year growth 2023-2028 (%)
- 6.5 Market opportunity by Product
- Market opportunity by Product ($ million)
- Data Table on Market opportunity by Product ($ million)
7 Market Segmentation by Type
- 7.1 Market segments
- Chart on Type - Market share 2023-2028 (%)
- Data Table on Type - Market share 2023-2028 (%)
- 7.2 Comparison by Type
- Chart on Comparison by Type
- Data Table on Comparison by Type
- 7.3 Diffuse large B-cell lymphoma (DLBCL) - Market size and forecast 2023-2028
- Chart on Diffuse large B-cell lymphoma (DLBCL) - Market size and forecast 2023-2028 ($ million)
- Data Table on Diffuse large B-cell lymphoma (DLBCL) - Market size and forecast 2023-2028 ($ million)
- Chart on Diffuse large B-cell lymphoma (DLBCL) - Year-over-year growth 2023-2028 (%)
- Data Table on Diffuse large B-cell lymphoma (DLBCL) - Year-over-year growth 2023-2028 (%)
- 7.4 Follicular lymphoma - Market size and forecast 2023-2028
- Chart on Follicular lymphoma - Market size and forecast 2023-2028 ($ million)
- Data Table on Follicular lymphoma - Market size and forecast 2023-2028 ($ million)
- Chart on Follicular lymphoma - Year-over-year growth 2023-2028 (%)
- Data Table on Follicular lymphoma - Year-over-year growth 2023-2028 (%)
- 7.5 Chronic lymphocytic leukemia - Market size and forecast 2023-2028
- Chart on Chronic lymphocytic leukemia - Market size and forecast 2023-2028 ($ million)
- Data Table on Chronic lymphocytic leukemia - Market size and forecast 2023-2028 ($ million)
- Chart on Chronic lymphocytic leukemia - Year-over-year growth 2023-2028 (%)
- Data Table on Chronic lymphocytic leukemia - Year-over-year growth 2023-2028 (%)
- 7.6 Mantle cell lymphoma (MCL) - Market size and forecast 2023-2028
- Chart on Mantle cell lymphoma (MCL) - Market size and forecast 2023-2028 ($ million)
- Data Table on Mantle cell lymphoma (MCL) - Market size and forecast 2023-2028 ($ million)
- Chart on Mantle cell lymphoma (MCL) - Year-over-year growth 2023-2028 (%)
- Data Table on Mantle cell lymphoma (MCL) - Year-over-year growth 2023-2028 (%)
- 7.7 Market opportunity by Type
- Market opportunity by Type ($ million)
- Data Table on Market opportunity by Type ($ million)
8 Customer Landscape
- 8.1 Customer landscape overview
- Analysis of price sensitivity, lifecycle, customer purchase basket, adoption rates, and purchase criteria
9 Geographic Landscape
- 9.1 Geographic segmentation
- Chart on Market share By Geographical Landscape 2023-2028 (%)
- Data Table on Market share By Geographical Landscape 2023-2028 (%)
- 9.2 Geographic comparison
- Chart on Geographic comparison
- Data Table on Geographic comparison
- 9.3 North America - Market size and forecast 2023-2028
- Chart on North America - Market size and forecast 2023-2028 ($ million)
- Data Table on North America - Market size and forecast 2023-2028 ($ million)
- Chart on North America - Year-over-year growth 2023-2028 (%)
- Data Table on North America - Year-over-year growth 2023-2028 (%)
- 9.4 Europe - Market size and forecast 2023-2028
- Chart on Europe - Market size and forecast 2023-2028 ($ million)
- Data Table on Europe - Market size and forecast 2023-2028 ($ million)
- Chart on Europe - Year-over-year growth 2023-2028 (%)
- Data Table on Europe - Year-over-year growth 2023-2028 (%)
- 9.5 Asia - Market size and forecast 2023-2028
- Chart on Asia - Market size and forecast 2023-2028 ($ million)
- Data Table on Asia - Market size and forecast 2023-2028 ($ million)
- Chart on Asia - Year-over-year growth 2023-2028 (%)
- Data Table on Asia - Year-over-year growth 2023-2028 (%)
- 9.6 Rest of World (ROW) - Market size and forecast 2023-2028
- Chart on Rest of World (ROW) - Market size and forecast 2023-2028 ($ million)
- Data Table on Rest of World (ROW) - Market size and forecast 2023-2028 ($ million)
- Chart on Rest of World (ROW) - Year-over-year growth 2023-2028 (%)
- Data Table on Rest of World (ROW) - Year-over-year growth 2023-2028 (%)
- 9.7 US - Market size and forecast 2023-2028
- Chart on US - Market size and forecast 2023-2028 ($ million)
- Data Table on US - Market size and forecast 2023-2028 ($ million)
- Chart on US - Year-over-year growth 2023-2028 (%)
- Data Table on US - Year-over-year growth 2023-2028 (%)
- 9.8 Canada - Market size and forecast 2023-2028
- Chart on Canada - Market size and forecast 2023-2028 ($ million)
- Data Table on Canada - Market size and forecast 2023-2028 ($ million)
- Chart on Canada - Year-over-year growth 2023-2028 (%)
- Data Table on Canada - Year-over-year growth 2023-2028 (%)
- 9.9 Germany - Market size and forecast 2023-2028
- Chart on Germany - Market size and forecast 2023-2028 ($ million)
- Data Table on Germany - Market size and forecast 2023-2028 ($ million)
- Chart on Germany - Year-over-year growth 2023-2028 (%)
- Data Table on Germany - Year-over-year growth 2023-2028 (%)
- 9.10 UK - Market size and forecast 2023-2028
- Chart on UK - Market size and forecast 2023-2028 ($ million)
- Data Table on UK - Market size and forecast 2023-2028 ($ million)
- Chart on UK - Year-over-year growth 2023-2028 (%)
- Data Table on UK - Year-over-year growth 2023-2028 (%)
- 9.11 France - Market size and forecast 2023-2028
- Chart on France - Market size and forecast 2023-2028 ($ million)
- Data Table on France - Market size and forecast 2023-2028 ($ million)
- Chart on France - Year-over-year growth 2023-2028 (%)
- Data Table on France - Year-over-year growth 2023-2028 (%)
- 9.12 Market opportunity By Geographical Landscape
- Market opportunity By Geographical Landscape ($ million)
- Data Tables on Market opportunity By Geographical Landscape ($ million)
10 Drivers, Challenges, and Opportunity/Restraints
- 10.1 Market drivers
- 10.2 Market challenges
- 10.3 Impact of drivers and challenges
- Impact of drivers and challenges in 2023 and 2028
- 10.4 Market opportunities/restraints
11 Competitive Landscape
- 11.1 Overview
- 11.2 Competitive Landscape
- Overview on criticality of inputs and factors of differentiation
- 11.3 Landscape disruption
- Overview on factors of disruption
- 11.4 Industry risks
- Impact of key risks on business
12 Competitive Analysis
- 12.1 Companies profiled
- Companies covered
- 12.2 Market positioning of companies
- Matrix on companies position and classification
- 12.3 AbbVie Inc.
- AbbVie Inc. - Overview
- AbbVie Inc. - Product / Service
- AbbVie Inc. - Key news
- AbbVie Inc. - Key offerings
- 12.4 Danaher Corp.
- Danaher Corp. - Overview
- Danaher Corp. - Business segments
- Danaher Corp. - Key news
- Danaher Corp. - Key offerings
- Danaher Corp. - Segment focus
- 12.5 Amgen Inc.
- Amgen Inc. - Overview
- Amgen Inc. - Product / Service
- Amgen Inc. - Key news
- Amgen Inc. - Key offerings
- 12.6 Ascentage Pharma Group International
- Ascentage Pharma Group International - Overview
- Ascentage Pharma Group International - Product / Service
- Ascentage Pharma Group International - Key offerings
- 12.7 AstraZeneca Plc
- AstraZeneca Plc - Overview
- AstraZeneca Plc - Product / Service
- AstraZeneca Plc - Key news
- AstraZeneca Plc - Key offerings
- 12.8 BeiGene Ltd.
- BeiGene Ltd. - Overview
- BeiGene Ltd. - Business segments
- BeiGene Ltd. - Key offerings
- BeiGene Ltd. - Segment focus
- 12.9 Bio Techne Corp.
- Bio Techne Corp. - Overview
- Bio Techne Corp. - Business segments
- Bio Techne Corp. - Key news
- Bio Techne Corp. - Key offerings
- Bio Techne Corp. - Segment focus
- 12.10 Biorbyt Ltd.
- Biorbyt Ltd. - Overview
- Biorbyt Ltd. - Product / Service
- Biorbyt Ltd. - Key offerings
- 12.11 Bristol Myers Squibb Co.
- Bristol Myers Squibb Co. - Overview
- Bristol Myers Squibb Co. - Product / Service
- Bristol Myers Squibb Co. - Key news
- Bristol Myers Squibb Co. - Key offerings
- 12.12 F. Hoffmann La Roche Ltd.
- F. Hoffmann La Roche Ltd. - Overview
- F. Hoffmann La Roche Ltd. - Business segments
- F. Hoffmann La Roche Ltd. - Key news
- F. Hoffmann La Roche Ltd. - Key offerings
- F. Hoffmann La Roche Ltd. - Segment focus
- 12.13 Merck and Co. Inc.
- Merck and Co. Inc. - Overview
- Merck and Co. Inc. - Business segments
- Merck and Co. Inc. - Key news
- Merck and Co. Inc. - Key offerings
- Merck and Co. Inc. - Segment focus
- 12.14 Novartis AG
- Novartis AG - Overview
- Novartis AG - Business segments
- Novartis AG - Key news
- Novartis AG - Key offerings
- Novartis AG - Segment focus
- 12.15 Santa Cruz Biotechnology Inc.
- Santa Cruz Biotechnology Inc. - Overview
- Santa Cruz Biotechnology Inc. - Product / Service
- Santa Cruz Biotechnology Inc. - Key offerings
- 12.16 Seagen Inc.
- Seagen Inc. - Overview
- Seagen Inc. - Key offerings
- 12.17 Les Laboratoires Servier
- Les Laboratoires Servier - Overview
- Les Laboratoires Servier - Business segments
- Les Laboratoires Servier - Key offerings
- Les Laboratoires Servier - Segment focus
13 Appendix
- 13.1 Scope of the report
- 13.2 Inclusions and exclusions checklist
- Inclusions checklist
- Exclusions checklist
- 13.3 Currency conversion rates for US$
- Currency conversion rates for US$
- 13.4 Research methodology
- Research methodology
- 13.5 Data procurement
- Information sources
- 13.6 Data validation
- Data validation
- 13.7 Validation techniques employed for market sizing
- Validation techniques employed for market sizing
- 13.8 Data synthesis
- Data synthesis
- 13.9 360 degree market analysis
- 360 degree market analysis
- 13.10 List of abbreviations
- List of abbreviations
