|
|
市場調査レポート
商品コード
1714109
オフィス・業務用コーヒー機器・用品の世界市場 2025-2029年Global Office and Commercial Coffee Equipment and Supplies Market 2025-2029 |
||||||
|
|||||||
カスタマイズ可能
|
|||||||


| オフィス・業務用コーヒー機器・用品の世界市場 2025-2029年 |
|
出版日: 2025年04月12日
発行: TechNavio
ページ情報: 英文 233 Pages
納期: 即納可能
|

全表示
- 概要
- 図表
- 目次
オフィス・業務用コーヒー機器・用品市場は2024-2029年に65億2,930万米ドル、予測期間中のCAGRは4%で成長すると予測されます。
当レポートでは、オフィス・業務用コーヒー機器・用品市場の全体的な分析、市場規模・予測、動向、成長促進要因、課題、約25のベンダーを網羅したベンダー分析などを掲載しています。
現在の市場シナリオ、最新動向と促進要因、市場環境全体に関する最新分析を提供しています。市場は、オフィススペースや商業施設の増加、フードサービスやカフェチェーンの成長、製品のプレミアム化につながる製品革新の増加によって牽引されています。
| 市場範囲 | |
|---|---|
| 基準年 | 2025年 |
| 終了年 | 2029年 |
| 予測期間 | 2025-2029年 |
| 成長モメンタム | 加速 |
| 前年比2025年 | 3.6% |
| CAGR | 4% |
| 増分額 | 65億2,930万米ドル |
本調査は、業界の主要参加者からのインプットを含め、一次情報と二次情報を客観的に組み合わせて実施しました。レポートには、主要企業の分析に加え、包括的な市場規模データ、地域別分析によるセグメント、ベンダー情勢が含まれています。レポートには過去データと予測データがあります。
本調査では、今後数年間のオフィス・業務用コーヒー機器・用品市場の成長を促進する主な理由の1つとして、全自動コーヒー抽出機に対する需要の高まりを挙げています。また、企業による持続可能な製造の採用の増加や多目的コーヒーマシンの導入は、市場の大きな需要につながります。
目次
第1章 エグゼクティブサマリー
- 市場概要
第2章 Technavio分析
- 価格・ライフサイクル・顧客購入バスケット・採用率・購入基準の分析
- インプットの重要性と差別化の要因
- 混乱の要因
- 促進要因と課題の影響
第3章 市場情勢
- 市場エコシステム
- 市場の特徴
- バリューチェーン分析
第4章 市場規模
- 市場の定義
- 市場セグメント分析
- 市場規模 2024年
- 市場の見通し 2024-2029年
第5章 市場規模実績
- オフィス・業務用コーヒー機器・用品の世界市場 2019-2023年
- 最終用途セグメント分析 2019-2023年
- 流通チャネルセグメント分析 2019-2023年
- 製品セグメント分析 2019-2023年
- 地域別セグメント分析 2019-2023年
- 国別セグメント分析 2019-2023年
第6章 定性分析
- AIの影響:オフィス・業務用コーヒー機器・用品の世界市場
第7章 ファイブフォース分析
- ファイブフォースの要約
- 買い手の交渉力
- 供給企業の交渉力
- 新規参入業者の脅威
- 代替品の脅威
- 競争の脅威
- 市況
第8章 市場セグメンテーション:最終用途別
- 市場セグメント
- 比較:最終用途別
- オフィス:市場規模と予測 2024-2029年
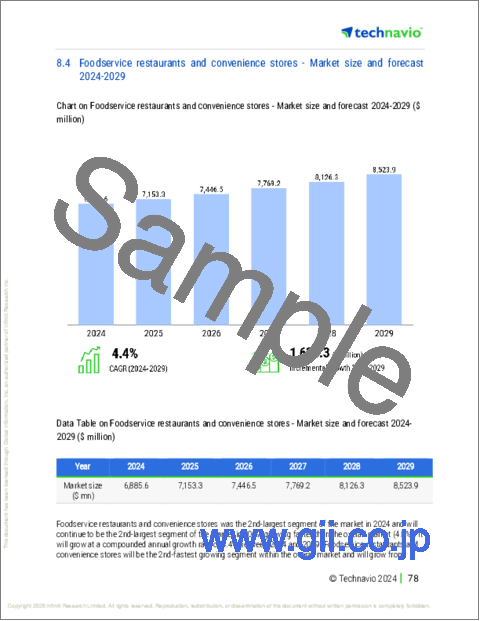
- 外食レストランとコンビニエンスストア:市場規模と予測 2024-2029年
- ヘルスケアとホスピタリティ:市場規模と予測 2024-2029年
- 教育:市場規模と予測 2024-2029年
- その他:市場規模と予測 2024-2029年
- 市場機会:最終用途別
第9章 市場セグメンテーション:流通チャネル別
- 市場セグメント
- 比較:流通チャネル別
- オフライン:市場規模と予測 2024-2029年
- オンライン:市場規模と予測 2024-2029年
- 市場機会:流通チャネル別
第10章 市場セグメンテーション:製品別
- 市場セグメント
- 比較:製品別
- 自動コーヒーマシン:市場規模と予測 2024-2029年
- 半自動コーヒーマシン:市場規模と予測 2024-2029年
- その他:市場規模と予測 2024-2029年
- 市場機会:製品別
第11章 顧客情勢
- 顧客情勢の概要
第12章 地域別情勢
- 地域別セグメンテーション
- 比較:地域別
- アジア太平洋:市場規模と予測 2024-2029年
- 欧州:市場規模と予測 2024-2029年
- 北米:市場規模と予測 2024-2029年
- 中東・アフリカ:市場規模と予測 2024-2029年
- 南米:市場規模と予測 2024-2029年
- 米国:市場規模と予測 2024-2029年
- 中国:市場規模と予測 2024-2029年
- ドイツ:市場規模と予測 2024-2029年
- フランス:市場規模と予測 2024-2029年
- 日本:市場規模と予測 2024-2029年
- イタリア:市場規模と予測 2024-2029年
- カナダ:市場規模と予測 2024-2029年
- オーストラリア:市場規模と予測 2024-2029年
- スペイン:市場規模と予測 2024-2029年
- 韓国:市場規模と予測 2024-2029年
- 市場機会:地域情勢別
第13章 促進要因・課題・機会・抑制要因
- 市場促進要因
- 市場の課題
- 促進要因と課題の影響
- 市場の機会・抑制要因
第14章 競合情勢
- 概要
- 競合情勢
- 混乱の状況
- 業界のリスク
第15章 競合分析
- 企業プロファイル
- 企業ランキング指数
- 企業の市場ポジショニング
- Animo B.V.
- Bunn O Matic Corp.
- Clive Coffee
- Coffee Day Enterprises Ltd.
- Danone SA
- DeLonghi Group
- Farmer Bros Co.
- Hamilton Beach Brands Inc.
- JURA Elektroapparate AG
- Keurig Green Mountain Inc.
- Koninklijke Philips NV
- Nestle SA
- Newell Brands Inc.
- Groupe SEB
- The Coca Cola Co.
第16章 付録
Exhibits:
- Exhibits1: Executive Summary - Chart on Market Overview
- Exhibits2: Executive Summary - Data Table on Market Overview
- Exhibits3: Executive Summary - Chart on Global Market Characteristics
- Exhibits4: Executive Summary - Chart on Market By Geographical Landscape
- Exhibits5: Executive Summary - Chart on Market Segmentation by End-user
- Exhibits6: Executive Summary - Chart on Market Segmentation by Distribution Channel
- Exhibits7: Executive Summary - Chart on Market Segmentation by Product
- Exhibits8: Executive Summary - Chart on Incremental Growth
- Exhibits9: Executive Summary - Data Table on Incremental Growth
- Exhibits10: Executive Summary - Chart on Company Market Positioning
- Exhibits11: Analysis of price sensitivity, lifecycle, customer purchase basket, adoption rates, and purchase criteria
- Exhibits12: Overview on criticality of inputs and factors of differentiation
- Exhibits13: Overview on factors of disruption
- Exhibits14: Impact of drivers and challenges in 2024 and 2029
- Exhibits15: Parent Market
- Exhibits16: Data Table on - Parent Market
- Exhibits17: Market characteristics analysis
- Exhibits18: Value chain analysis
- Exhibits19: Offerings of companies included in the market definition
- Exhibits20: Market segments
- Exhibits21: Chart on Global - Market size and forecast 2024-2029 ($ million)
- Exhibits22: Data Table on Global - Market size and forecast 2024-2029 ($ million)
- Exhibits23: Chart on Global Market: Year-over-year growth 2024-2029 (%)
- Exhibits24: Data Table on Global Market: Year-over-year growth 2024-2029 (%)
- Exhibits25: Historic Market Size - Data Table on Global Office And Commercial Coffee Equipment And Supplies Market 2019 - 2023 ($ million)
- Exhibits26: Historic Market Size - End-user Segment 2019 - 2023 ($ million)
- Exhibits27: Historic Market Size - Distribution Channel Segment 2019 - 2023 ($ million)
- Exhibits28: Historic Market Size - Product Segment 2019 - 2023 ($ million)
- Exhibits29: Historic Market Size - Geography Segment 2019 - 2023 ($ million)
- Exhibits30: Historic Market Size - Country Segment 2019 - 2023 ($ million)
- Exhibits31: Five forces analysis - Comparison between 2024 and 2029
- Exhibits32: Bargaining power of buyers - Impact of key factors 2024 and 2029
- Exhibits33: Bargaining power of suppliers - Impact of key factors in 2024 and 2029
- Exhibits34: Threat of new entrants - Impact of key factors in 2024 and 2029
- Exhibits35: Threat of substitutes - Impact of key factors in 2024 and 2029
- Exhibits36: Threat of rivalry - Impact of key factors in 2024 and 2029
- Exhibits37: Chart on Market condition - Five forces 2024 and 2029
- Exhibits38: Chart on End-user - Market share 2024-2029 (%)
- Exhibits39: Data Table on End-user - Market share 2024-2029 (%)
- Exhibits40: Chart on Comparison by End-user
- Exhibits41: Data Table on Comparison by End-user
- Exhibits42: Chart on Offices - Market size and forecast 2024-2029 ($ million)
- Exhibits43: Data Table on Offices - Market size and forecast 2024-2029 ($ million)
- Exhibits44: Chart on Offices - Year-over-year growth 2024-2029 (%)
- Exhibits45: Data Table on Offices - Year-over-year growth 2024-2029 (%)
- Exhibits46: Chart on Foodservice restaurants and convenience stores - Market size and forecast 2024-2029 ($ million)
- Exhibits47: Data Table on Foodservice restaurants and convenience stores - Market size and forecast 2024-2029 ($ million)
- Exhibits48: Chart on Foodservice restaurants and convenience stores - Year-over-year growth 2024-2029 (%)
- Exhibits49: Data Table on Foodservice restaurants and convenience stores - Year-over-year growth 2024-2029 (%)
- Exhibits50: Chart on Healthcare and hospitality - Market size and forecast 2024-2029 ($ million)
- Exhibits51: Data Table on Healthcare and hospitality - Market size and forecast 2024-2029 ($ million)
- Exhibits52: Chart on Healthcare and hospitality - Year-over-year growth 2024-2029 (%)
- Exhibits53: Data Table on Healthcare and hospitality - Year-over-year growth 2024-2029 (%)
- Exhibits54: Chart on Education - Market size and forecast 2024-2029 ($ million)
- Exhibits55: Data Table on Education - Market size and forecast 2024-2029 ($ million)
- Exhibits56: Chart on Education - Year-over-year growth 2024-2029 (%)
- Exhibits57: Data Table on Education - Year-over-year growth 2024-2029 (%)
- Exhibits58: Chart on Others - Market size and forecast 2024-2029 ($ million)
- Exhibits59: Data Table on Others - Market size and forecast 2024-2029 ($ million)
- Exhibits60: Chart on Others - Year-over-year growth 2024-2029 (%)
- Exhibits61: Data Table on Others - Year-over-year growth 2024-2029 (%)
- Exhibits62: Market opportunity by End-user ($ million)
- Exhibits63: Data Table on Market opportunity by End-user ($ million)
- Exhibits64: Chart on Distribution Channel - Market share 2024-2029 (%)
- Exhibits65: Data Table on Distribution Channel - Market share 2024-2029 (%)
- Exhibits66: Chart on Comparison by Distribution Channel
- Exhibits67: Data Table on Comparison by Distribution Channel
- Exhibits68: Chart on Offline - Market size and forecast 2024-2029 ($ million)
- Exhibits69: Data Table on Offline - Market size and forecast 2024-2029 ($ million)
- Exhibits70: Chart on Offline - Year-over-year growth 2024-2029 (%)
- Exhibits71: Data Table on Offline - Year-over-year growth 2024-2029 (%)
- Exhibits72: Chart on Online - Market size and forecast 2024-2029 ($ million)
- Exhibits73: Data Table on Online - Market size and forecast 2024-2029 ($ million)
- Exhibits74: Chart on Online - Year-over-year growth 2024-2029 (%)
- Exhibits75: Data Table on Online - Year-over-year growth 2024-2029 (%)
- Exhibits76: Market opportunity by Distribution Channel ($ million)
- Exhibits77: Data Table on Market opportunity by Distribution Channel ($ million)
- Exhibits78: Chart on Product - Market share 2024-2029 (%)
- Exhibits79: Data Table on Product - Market share 2024-2029 (%)
- Exhibits80: Chart on Comparison by Product
- Exhibits81: Data Table on Comparison by Product
- Exhibits82: Chart on Automatic coffee machines - Market size and forecast 2024-2029 ($ million)
- Exhibits83: Data Table on Automatic coffee machines - Market size and forecast 2024-2029 ($ million)
- Exhibits84: Chart on Automatic coffee machines - Year-over-year growth 2024-2029 (%)
- Exhibits85: Data Table on Automatic coffee machines - Year-over-year growth 2024-2029 (%)
- Exhibits86: Chart on Semi-automatic coffee machines - Market size and forecast 2024-2029 ($ million)
- Exhibits87: Data Table on Semi-automatic coffee machines - Market size and forecast 2024-2029 ($ million)
- Exhibits88: Chart on Semi-automatic coffee machines - Year-over-year growth 2024-2029 (%)
- Exhibits89: Data Table on Semi-automatic coffee machines - Year-over-year growth 2024-2029 (%)
- Exhibits90: Chart on Others - Market size and forecast 2024-2029 ($ million)
- Exhibits91: Data Table on Others - Market size and forecast 2024-2029 ($ million)
- Exhibits92: Chart on Others - Year-over-year growth 2024-2029 (%)
- Exhibits93: Data Table on Others - Year-over-year growth 2024-2029 (%)
- Exhibits94: Market opportunity by Product ($ million)
- Exhibits95: Data Table on Market opportunity by Product ($ million)
- Exhibits96: Analysis of price sensitivity, lifecycle, customer purchase basket, adoption rates, and purchase criteria
- Exhibits97: Chart on Market share By Geographical Landscape 2024-2029 (%)
- Exhibits98: Data Table on Market share By Geographical Landscape 2024-2029 (%)
- Exhibits99: Chart on Geographic comparison
- Exhibits100: Data Table on Geographic comparison
- Exhibits101: Chart on APAC - Market size and forecast 2024-2029 ($ million)
- Exhibits102: Data Table on APAC - Market size and forecast 2024-2029 ($ million)
- Exhibits103: Chart on APAC - Year-over-year growth 2024-2029 (%)
- Exhibits104: Data Table on APAC - Year-over-year growth 2024-2029 (%)
- Exhibits105: Chart on Europe - Market size and forecast 2024-2029 ($ million)
- Exhibits106: Data Table on Europe - Market size and forecast 2024-2029 ($ million)
- Exhibits107: Chart on Europe - Year-over-year growth 2024-2029 (%)
- Exhibits108: Data Table on Europe - Year-over-year growth 2024-2029 (%)
- Exhibits109: Chart on North America - Market size and forecast 2024-2029 ($ million)
- Exhibits110: Data Table on North America - Market size and forecast 2024-2029 ($ million)
- Exhibits111: Chart on North America - Year-over-year growth 2024-2029 (%)
- Exhibits112: Data Table on North America - Year-over-year growth 2024-2029 (%)
- Exhibits113: Chart on Middle East and Africa - Market size and forecast 2024-2029 ($ million)
- Exhibits114: Data Table on Middle East and Africa - Market size and forecast 2024-2029 ($ million)
- Exhibits115: Chart on Middle East and Africa - Year-over-year growth 2024-2029 (%)
- Exhibits116: Data Table on Middle East and Africa - Year-over-year growth 2024-2029 (%)
- Exhibits117: Chart on South America - Market size and forecast 2024-2029 ($ million)
- Exhibits118: Data Table on South America - Market size and forecast 2024-2029 ($ million)
- Exhibits119: Chart on South America - Year-over-year growth 2024-2029 (%)
- Exhibits120: Data Table on South America - Year-over-year growth 2024-2029 (%)
- Exhibits121: Chart on US - Market size and forecast 2024-2029 ($ million)
- Exhibits122: Data Table on US - Market size and forecast 2024-2029 ($ million)
- Exhibits123: Chart on US - Year-over-year growth 2024-2029 (%)
- Exhibits124: Data Table on US - Year-over-year growth 2024-2029 (%)
- Exhibits125: Chart on China - Market size and forecast 2024-2029 ($ million)
- Exhibits126: Data Table on China - Market size and forecast 2024-2029 ($ million)
- Exhibits127: Chart on China - Year-over-year growth 2024-2029 (%)
- Exhibits128: Data Table on China - Year-over-year growth 2024-2029 (%)
- Exhibits129: Chart on Germany - Market size and forecast 2024-2029 ($ million)
- Exhibits130: Data Table on Germany - Market size and forecast 2024-2029 ($ million)
- Exhibits131: Chart on Germany - Year-over-year growth 2024-2029 (%)
- Exhibits132: Data Table on Germany - Year-over-year growth 2024-2029 (%)
- Exhibits133: Chart on France - Market size and forecast 2024-2029 ($ million)
- Exhibits134: Data Table on France - Market size and forecast 2024-2029 ($ million)
- Exhibits135: Chart on France - Year-over-year growth 2024-2029 (%)
- Exhibits136: Data Table on France - Year-over-year growth 2024-2029 (%)
- Exhibits137: Chart on Japan - Market size and forecast 2024-2029 ($ million)
- Exhibits138: Data Table on Japan - Market size and forecast 2024-2029 ($ million)
- Exhibits139: Chart on Japan - Year-over-year growth 2024-2029 (%)
- Exhibits140: Data Table on Japan - Year-over-year growth 2024-2029 (%)
- Exhibits141: Chart on Italy - Market size and forecast 2024-2029 ($ million)
- Exhibits142: Data Table on Italy - Market size and forecast 2024-2029 ($ million)
- Exhibits143: Chart on Italy - Year-over-year growth 2024-2029 (%)
- Exhibits144: Data Table on Italy - Year-over-year growth 2024-2029 (%)
- Exhibits145: Chart on Canada - Market size and forecast 2024-2029 ($ million)
- Exhibits146: Data Table on Canada - Market size and forecast 2024-2029 ($ million)
- Exhibits147: Chart on Canada - Year-over-year growth 2024-2029 (%)
- Exhibits148: Data Table on Canada - Year-over-year growth 2024-2029 (%)
- Exhibits149: Chart on Australia - Market size and forecast 2024-2029 ($ million)
- Exhibits150: Data Table on Australia - Market size and forecast 2024-2029 ($ million)
- Exhibits151: Chart on Australia - Year-over-year growth 2024-2029 (%)
- Exhibits152: Data Table on Australia - Year-over-year growth 2024-2029 (%)
- Exhibits153: Chart on Spain - Market size and forecast 2024-2029 ($ million)
- Exhibits154: Data Table on Spain - Market size and forecast 2024-2029 ($ million)
- Exhibits155: Chart on Spain - Year-over-year growth 2024-2029 (%)
- Exhibits156: Data Table on Spain - Year-over-year growth 2024-2029 (%)
- Exhibits157: Chart on South Korea - Market size and forecast 2024-2029 ($ million)
- Exhibits158: Data Table on South Korea - Market size and forecast 2024-2029 ($ million)
- Exhibits159: Chart on South Korea - Year-over-year growth 2024-2029 (%)
- Exhibits160: Data Table on South Korea - Year-over-year growth 2024-2029 (%)
- Exhibits161: Market opportunity By Geographical Landscape ($ million)
- Exhibits162: Data Tables on Market opportunity By Geographical Landscape ($ million)
- Exhibits163: Impact of drivers and challenges in 2024 and 2029
- Exhibits164: Overview on criticality of inputs and factors of differentiation
- Exhibits165: Overview on factors of disruption
- Exhibits166: Impact of key risks on business
- Exhibits167: Companies covered
- Exhibits168: Company ranking index
- Exhibits169: Matrix on companies position and classification
- Exhibits170: Animo B.V. - Overview
- Exhibits171: Animo B.V. - Product / Service
- Exhibits172: Animo B.V. - Key offerings
- Exhibits173: SWOT
- Exhibits174: Bunn O Matic Corp. - Overview
- Exhibits175: Bunn O Matic Corp. - Product / Service
- Exhibits176: Bunn O Matic Corp. - Key offerings
- Exhibits177: SWOT
- Exhibits178: Clive Coffee - Overview
- Exhibits179: Clive Coffee - Product / Service
- Exhibits180: Clive Coffee - Key offerings
- Exhibits181: SWOT
- Exhibits182: Coffee Day Enterprises Ltd. - Overview
- Exhibits183: Coffee Day Enterprises Ltd. - Business segments
- Exhibits184: Coffee Day Enterprises Ltd. - Key offerings
- Exhibits185: Coffee Day Enterprises Ltd. - Segment focus
- Exhibits186: SWOT
- Exhibits187: Danone SA - Overview
- Exhibits188: Danone SA - Business segments
- Exhibits189: Danone SA - Key news
- Exhibits190: Danone SA - Key offerings
- Exhibits191: Danone SA - Segment focus
- Exhibits192: SWOT
- Exhibits193: DeLonghi Group - Overview
- Exhibits194: DeLonghi Group - Business segments
- Exhibits195: DeLonghi Group - Key offerings
- Exhibits196: DeLonghi Group - Segment focus
- Exhibits197: SWOT
- Exhibits198: Farmer Bros Co. - Overview
- Exhibits199: Farmer Bros Co. - Product / Service
- Exhibits200: Farmer Bros Co. - Key offerings
- Exhibits201: SWOT
- Exhibits202: Hamilton Beach Brands Inc. - Overview
- Exhibits203: Hamilton Beach Brands Inc. - Product / Service
- Exhibits204: Hamilton Beach Brands Inc. - Key offerings
- Exhibits205: SWOT
- Exhibits206: JURA Elektroapparate AG - Overview
- Exhibits207: JURA Elektroapparate AG - Business segments
- Exhibits208: JURA Elektroapparate AG - Key offerings
- Exhibits209: JURA Elektroapparate AG - Segment focus
- Exhibits210: SWOT
- Exhibits211: Keurig Green Mountain Inc. - Overview
- Exhibits212: Keurig Green Mountain Inc. - Product / Service
- Exhibits213: Keurig Green Mountain Inc. - Key offerings
- Exhibits214: SWOT
- Exhibits215: Koninklijke Philips NV - Overview
- Exhibits216: Koninklijke Philips NV - Business segments
- Exhibits217: Koninklijke Philips NV - Key news
- Exhibits218: Koninklijke Philips NV - Key offerings
- Exhibits219: Koninklijke Philips NV - Segment focus
- Exhibits220: SWOT
- Exhibits221: Nestle SA - Overview
- Exhibits222: Nestle SA - Business segments
- Exhibits223: Nestle SA - Key news
- Exhibits224: Nestle SA - Key offerings
- Exhibits225: Nestle SA - Segment focus
- Exhibits226: SWOT
- Exhibits227: Newell Brands Inc. - Overview
- Exhibits228: Newell Brands Inc. - Business segments
- Exhibits229: Newell Brands Inc. - Key offerings
- Exhibits230: Newell Brands Inc. - Segment focus
- Exhibits231: SWOT
- Exhibits232: Groupe SEB - Overview
- Exhibits233: Groupe SEB - Business segments
- Exhibits234: Groupe SEB - Key offerings
- Exhibits235: Groupe SEB - Segment focus
- Exhibits236: SWOT
- Exhibits237: The Coca Cola Co. - Overview
- Exhibits238: The Coca Cola Co. - Business segments
- Exhibits239: The Coca Cola Co. - Key news
- Exhibits240: The Coca Cola Co. - Key offerings
- Exhibits241: The Coca Cola Co. - Segment focus
- Exhibits242: SWOT
- Exhibits243: Inclusions checklist
- Exhibits244: Exclusions checklist
- Exhibits245: Currency conversion rates for US$
- Exhibits246: Research methodology
- Exhibits247: Information sources
- Exhibits248: Data validation
- Exhibits249: Validation techniques employed for market sizing
- Exhibits250: Data synthesis
- Exhibits251: 360 degree market analysis
- Exhibits252: List of abbreviations
The office and commercial coffee equipment and supplies market is forecasted to grow by USD 6529.3 mn during 2024-2029, accelerating at a CAGR of 4% during the forecast period. The report on the office and commercial coffee equipment and supplies market provides a holistic analysis, market size and forecast, trends, growth drivers, and challenges, as well as vendor analysis covering around 25 vendors.
The report offers an up-to-date analysis regarding the current market scenario, the latest trends and drivers, and the overall market environment. The market is driven by growing number of office spaces and commercial establishments, growing foodservice and cafe chains, and increased product innovation leading to product premiumization.
| Market Scope | |
|---|---|
| Base Year | 2025 |
| End Year | 2029 |
| Series Year | 2025-2029 |
| Growth Momentum | Accelerate |
| YOY 2025 | 3.6% |
| CAGR | 4% |
| Incremental Value | $6529.3 mn |
The study was conducted using an objective combination of primary and secondary information including inputs from key participants in the industry. The report contains a comprehensive market size data, segment with regional analysis and vendor landscape in addition to an analysis of the key companies. Reports have historic and forecast data.
Technavio's office and commercial coffee equipment and supplies market is segmented as below:
By End-user
- Offices
- Foodservice restaurants and convenience stores
- Healthcare and hospitality
- Education
- Others
By Distribution Channel
- Offline
- Online
By Product
- Automatic coffee machines
- Semi-automatic coffee machines
- Others
By Geographical Landscape
- APAC
- Europe
- North America
- Middle East and Africa
- South America
This study identifies the rising demand for fully automated coffee dispensing machines as one of the prime reasons driving the office and commercial coffee equipment and supplies market growth during the next few years. Also, increased adoption of sustainable manufacturing by companies and introduction of multi-purpose coffee machines will lead to sizable demand in the market.
The report on the office and commercial coffee equipment and supplies market covers the following areas:
- Office And Commercial Coffee Equipment And Supplies Market sizing
- Office And Commercial Coffee Equipment And Supplies Market forecast
- Office And Commercial Coffee Equipment And Supplies Market industry analysis
The robust vendor analysis is designed to help clients improve their market position, and in line with this, this report provides a detailed analysis of several leading office and commercial coffee equipment and supplies market vendors that include Animo B.V., Bunn O Matic Corp., Clive Coffee, Coffee Day Enterprises Ltd., Danone SA, DeLonghi Group, Farmer Bros Co., Hamilton Beach Brands Inc., JURA Elektroapparate AG, Kaapi Machines India Pvt. Ltd., Keurig Green Mountain Inc., Koninklijke Philips NV, LUIGI LAVAZZA SPA, Massimo Zanetti Beverage Group, Nestle SA, Newell Brands Inc., Rhea Vendors Group Spa, Groupe SEB, Simonelli Group Spa, and The Coca Cola Co.. Also, the office and commercial coffee equipment and supplies market analysis report includes information on upcoming trends and challenges that will influence market growth. This is to help companies strategize and leverage all forthcoming growth opportunities.
The publisher presents a detailed picture of the market by the way of study, synthesis, and summation of data from multiple sources by an analysis of key parameters such as profit, pricing, competition, and promotions. It presents various market facets by identifying the key industry influencers. The data presented is comprehensive, reliable, and a result of extensive primary and secondary research. The market research reports provide a complete competitive landscape and an in-depth vendor selection methodology and analysis using qualitative and quantitative research to forecast accurate market growth.
Table of Contents
1 Executive Summary
- 1.1 Market overview
- Executive Summary - Chart on Market Overview
- Executive Summary - Data Table on Market Overview
- Executive Summary - Chart on Global Market Characteristics
- Executive Summary - Chart on Market By Geographical Landscape
- Executive Summary - Chart on Market Segmentation by End-user
- Executive Summary - Chart on Market Segmentation by Distribution Channel
- Executive Summary - Chart on Market Segmentation by Product
- Executive Summary - Chart on Incremental Growth
- Executive Summary - Data Table on Incremental Growth
- Executive Summary - Chart on Company Market Positioning
2 Technavio Analysis
- 2.1 Analysis of price sensitivity, lifecycle, customer purchase basket, adoption rates, and purchase criteria
- Analysis of price sensitivity, lifecycle, customer purchase basket, adoption rates, and purchase criteria
- 2.2 Criticality of inputs and Factors of differentiation
- Overview on criticality of inputs and factors of differentiation
- 2.3 Factors of disruption
- Overview on factors of disruption
- 2.4 Impact of drivers and challenges
- Impact of drivers and challenges in 2024 and 2029
3 Market Landscape
- 3.1 Market ecosystem
- Parent Market
- Data Table on - Parent Market
- 3.2 Market characteristics
- Market characteristics analysis
- 3.3 Value chain analysis
- Value chain analysis
4 Market Sizing
- 4.1 Market definition
- Offerings of companies included in the market definition
- 4.2 Market segment analysis
- Market segments
- 4.3 Market size 2024
- 4.4 Market outlook: Forecast for 2024-2029
- Chart on Global - Market size and forecast 2024-2029 ($ million)
- Data Table on Global - Market size and forecast 2024-2029 ($ million)
- Chart on Global Market: Year-over-year growth 2024-2029 (%)
- Data Table on Global Market: Year-over-year growth 2024-2029 (%)
5 Historic Market Size
- 5.1 Global Office And Commercial Coffee Equipment And Supplies Market 2019 - 2023
- Historic Market Size - Data Table on Global Office And Commercial Coffee Equipment And Supplies Market 2019 - 2023 ($ million)
- 5.2 End-user segment analysis 2019 - 2023
- Historic Market Size - End-user Segment 2019 - 2023 ($ million)
- 5.3 Distribution Channel segment analysis 2019 - 2023
- Historic Market Size - Distribution Channel Segment 2019 - 2023 ($ million)
- 5.4 Product segment analysis 2019 - 2023
- Historic Market Size - Product Segment 2019 - 2023 ($ million)
- 5.5 Geography segment analysis 2019 - 2023
- Historic Market Size - Geography Segment 2019 - 2023 ($ million)
- 5.6 Country segment analysis 2019 - 2023
- Historic Market Size - Country Segment 2019 - 2023 ($ million)
6 Qualitative Analysis
- 6.1 Impact of AI on Global Office and Commercial Coffee Equipment and Supplies Market
7 Five Forces Analysis
- 7.1 Five forces summary
- Five forces analysis - Comparison between 2024 and 2029
- 7.2 Bargaining power of buyers
- Bargaining power of buyers - Impact of key factors 2024 and 2029
- 7.3 Bargaining power of suppliers
- Bargaining power of suppliers - Impact of key factors in 2024 and 2029
- 7.4 Threat of new entrants
- Threat of new entrants - Impact of key factors in 2024 and 2029
- 7.5 Threat of substitutes
- Threat of substitutes - Impact of key factors in 2024 and 2029
- 7.6 Threat of rivalry
- Threat of rivalry - Impact of key factors in 2024 and 2029
- 7.7 Market condition
- Chart on Market condition - Five forces 2024 and 2029
8 Market Segmentation by End-user
- 8.1 Market segments
- Chart on End-user - Market share 2024-2029 (%)
- Data Table on End-user - Market share 2024-2029 (%)
- 8.2 Comparison by End-user
- Chart on Comparison by End-user
- Data Table on Comparison by End-user
- 8.3 Offices - Market size and forecast 2024-2029
- Chart on Offices - Market size and forecast 2024-2029 ($ million)
- Data Table on Offices - Market size and forecast 2024-2029 ($ million)
- Chart on Offices - Year-over-year growth 2024-2029 (%)
- Data Table on Offices - Year-over-year growth 2024-2029 (%)
- 8.4 Foodservice restaurants and convenience stores - Market size and forecast 2024-2029
- Chart on Foodservice restaurants and convenience stores - Market size and forecast 2024-2029 ($ million)
- Data Table on Foodservice restaurants and convenience stores - Market size and forecast 2024-2029 ($ million)
- Chart on Foodservice restaurants and convenience stores - Year-over-year growth 2024-2029 (%)
- Data Table on Foodservice restaurants and convenience stores - Year-over-year growth 2024-2029 (%)
- 8.5 Healthcare and hospitality - Market size and forecast 2024-2029
- Chart on Healthcare and hospitality - Market size and forecast 2024-2029 ($ million)
- Data Table on Healthcare and hospitality - Market size and forecast 2024-2029 ($ million)
- Chart on Healthcare and hospitality - Year-over-year growth 2024-2029 (%)
- Data Table on Healthcare and hospitality - Year-over-year growth 2024-2029 (%)
- 8.6 Education - Market size and forecast 2024-2029
- Chart on Education - Market size and forecast 2024-2029 ($ million)
- Data Table on Education - Market size and forecast 2024-2029 ($ million)
- Chart on Education - Year-over-year growth 2024-2029 (%)
- Data Table on Education - Year-over-year growth 2024-2029 (%)
- 8.7 Others - Market size and forecast 2024-2029
- Chart on Others - Market size and forecast 2024-2029 ($ million)
- Data Table on Others - Market size and forecast 2024-2029 ($ million)
- Chart on Others - Year-over-year growth 2024-2029 (%)
- Data Table on Others - Year-over-year growth 2024-2029 (%)
- 8.8 Market opportunity by End-user
- Market opportunity by End-user ($ million)
- Data Table on Market opportunity by End-user ($ million)
9 Market Segmentation by Distribution Channel
- 9.1 Market segments
- Chart on Distribution Channel - Market share 2024-2029 (%)
- Data Table on Distribution Channel - Market share 2024-2029 (%)
- 9.2 Comparison by Distribution Channel
- Chart on Comparison by Distribution Channel
- Data Table on Comparison by Distribution Channel
- 9.3 Offline - Market size and forecast 2024-2029
- Chart on Offline - Market size and forecast 2024-2029 ($ million)
- Data Table on Offline - Market size and forecast 2024-2029 ($ million)
- Chart on Offline - Year-over-year growth 2024-2029 (%)
- Data Table on Offline - Year-over-year growth 2024-2029 (%)
- 9.4 Online - Market size and forecast 2024-2029
- Chart on Online - Market size and forecast 2024-2029 ($ million)
- Data Table on Online - Market size and forecast 2024-2029 ($ million)
- Chart on Online - Year-over-year growth 2024-2029 (%)
- Data Table on Online - Year-over-year growth 2024-2029 (%)
- 9.5 Market opportunity by Distribution Channel
- Market opportunity by Distribution Channel ($ million)
- Data Table on Market opportunity by Distribution Channel ($ million)
10 Market Segmentation by Product
- 10.1 Market segments
- Chart on Product - Market share 2024-2029 (%)
- Data Table on Product - Market share 2024-2029 (%)
- 10.2 Comparison by Product
- Chart on Comparison by Product
- Data Table on Comparison by Product
- 10.3 Automatic coffee machines - Market size and forecast 2024-2029
- Chart on Automatic coffee machines - Market size and forecast 2024-2029 ($ million)
- Data Table on Automatic coffee machines - Market size and forecast 2024-2029 ($ million)
- Chart on Automatic coffee machines - Year-over-year growth 2024-2029 (%)
- Data Table on Automatic coffee machines - Year-over-year growth 2024-2029 (%)
- 10.4 Semi-automatic coffee machines - Market size and forecast 2024-2029
- Chart on Semi-automatic coffee machines - Market size and forecast 2024-2029 ($ million)
- Data Table on Semi-automatic coffee machines - Market size and forecast 2024-2029 ($ million)
- Chart on Semi-automatic coffee machines - Year-over-year growth 2024-2029 (%)
- Data Table on Semi-automatic coffee machines - Year-over-year growth 2024-2029 (%)
- 10.5 Others - Market size and forecast 2024-2029
- Chart on Others - Market size and forecast 2024-2029 ($ million)
- Data Table on Others - Market size and forecast 2024-2029 ($ million)
- Chart on Others - Year-over-year growth 2024-2029 (%)
- Data Table on Others - Year-over-year growth 2024-2029 (%)
- 10.6 Market opportunity by Product
- Market opportunity by Product ($ million)
- Data Table on Market opportunity by Product ($ million)
11 Customer Landscape
- 11.1 Customer landscape overview
- Analysis of price sensitivity, lifecycle, customer purchase basket, adoption rates, and purchase criteria
12 Geographic Landscape
- 12.1 Geographic segmentation
- Chart on Market share By Geographical Landscape 2024-2029 (%)
- Data Table on Market share By Geographical Landscape 2024-2029 (%)
- 12.2 Geographic comparison
- Chart on Geographic comparison
- Data Table on Geographic comparison
- 12.3 APAC - Market size and forecast 2024-2029
- Chart on APAC - Market size and forecast 2024-2029 ($ million)
- Data Table on APAC - Market size and forecast 2024-2029 ($ million)
- Chart on APAC - Year-over-year growth 2024-2029 (%)
- Data Table on APAC - Year-over-year growth 2024-2029 (%)
- 12.4 Europe - Market size and forecast 2024-2029
- Chart on Europe - Market size and forecast 2024-2029 ($ million)
- Data Table on Europe - Market size and forecast 2024-2029 ($ million)
- Chart on Europe - Year-over-year growth 2024-2029 (%)
- Data Table on Europe - Year-over-year growth 2024-2029 (%)
- 12.5 North America - Market size and forecast 2024-2029
- Chart on North America - Market size and forecast 2024-2029 ($ million)
- Data Table on North America - Market size and forecast 2024-2029 ($ million)
- Chart on North America - Year-over-year growth 2024-2029 (%)
- Data Table on North America - Year-over-year growth 2024-2029 (%)
- 12.6 Middle East and Africa - Market size and forecast 2024-2029
- Chart on Middle East and Africa - Market size and forecast 2024-2029 ($ million)
- Data Table on Middle East and Africa - Market size and forecast 2024-2029 ($ million)
- Chart on Middle East and Africa - Year-over-year growth 2024-2029 (%)
- Data Table on Middle East and Africa - Year-over-year growth 2024-2029 (%)
- 12.7 South America - Market size and forecast 2024-2029
- Chart on South America - Market size and forecast 2024-2029 ($ million)
- Data Table on South America - Market size and forecast 2024-2029 ($ million)
- Chart on South America - Year-over-year growth 2024-2029 (%)
- Data Table on South America - Year-over-year growth 2024-2029 (%)
- 12.8 US - Market size and forecast 2024-2029
- Chart on US - Market size and forecast 2024-2029 ($ million)
- Data Table on US - Market size and forecast 2024-2029 ($ million)
- Chart on US - Year-over-year growth 2024-2029 (%)
- Data Table on US - Year-over-year growth 2024-2029 (%)
- 12.9 China - Market size and forecast 2024-2029
- Chart on China - Market size and forecast 2024-2029 ($ million)
- Data Table on China - Market size and forecast 2024-2029 ($ million)
- Chart on China - Year-over-year growth 2024-2029 (%)
- Data Table on China - Year-over-year growth 2024-2029 (%)
- 12.10 Germany - Market size and forecast 2024-2029
- Chart on Germany - Market size and forecast 2024-2029 ($ million)
- Data Table on Germany - Market size and forecast 2024-2029 ($ million)
- Chart on Germany - Year-over-year growth 2024-2029 (%)
- Data Table on Germany - Year-over-year growth 2024-2029 (%)
- 12.11 France - Market size and forecast 2024-2029
- Chart on France - Market size and forecast 2024-2029 ($ million)
- Data Table on France - Market size and forecast 2024-2029 ($ million)
- Chart on France - Year-over-year growth 2024-2029 (%)
- Data Table on France - Year-over-year growth 2024-2029 (%)
- 12.12 Japan - Market size and forecast 2024-2029
- Chart on Japan - Market size and forecast 2024-2029 ($ million)
- Data Table on Japan - Market size and forecast 2024-2029 ($ million)
- Chart on Japan - Year-over-year growth 2024-2029 (%)
- Data Table on Japan - Year-over-year growth 2024-2029 (%)
- 12.13 Italy - Market size and forecast 2024-2029
- Chart on Italy - Market size and forecast 2024-2029 ($ million)
- Data Table on Italy - Market size and forecast 2024-2029 ($ million)
- Chart on Italy - Year-over-year growth 2024-2029 (%)
- Data Table on Italy - Year-over-year growth 2024-2029 (%)
- 12.14 Canada - Market size and forecast 2024-2029
- Chart on Canada - Market size and forecast 2024-2029 ($ million)
- Data Table on Canada - Market size and forecast 2024-2029 ($ million)
- Chart on Canada - Year-over-year growth 2024-2029 (%)
- Data Table on Canada - Year-over-year growth 2024-2029 (%)
- 12.15 Australia - Market size and forecast 2024-2029
- Chart on Australia - Market size and forecast 2024-2029 ($ million)
- Data Table on Australia - Market size and forecast 2024-2029 ($ million)
- Chart on Australia - Year-over-year growth 2024-2029 (%)
- Data Table on Australia - Year-over-year growth 2024-2029 (%)
- 12.16 Spain - Market size and forecast 2024-2029
- Chart on Spain - Market size and forecast 2024-2029 ($ million)
- Data Table on Spain - Market size and forecast 2024-2029 ($ million)
- Chart on Spain - Year-over-year growth 2024-2029 (%)
- Data Table on Spain - Year-over-year growth 2024-2029 (%)
- 12.17 South Korea - Market size and forecast 2024-2029
- Chart on South Korea - Market size and forecast 2024-2029 ($ million)
- Data Table on South Korea - Market size and forecast 2024-2029 ($ million)
- Chart on South Korea - Year-over-year growth 2024-2029 (%)
- Data Table on South Korea - Year-over-year growth 2024-2029 (%)
- 12.18 Market opportunity By Geographical Landscape
- Market opportunity By Geographical Landscape ($ million)
- Data Tables on Market opportunity By Geographical Landscape ($ million)
13 Drivers, Challenges, and Opportunity/Restraints
- 13.1 Market drivers
- 13.2 Market challenges
- 13.3 Impact of drivers and challenges
- Impact of drivers and challenges in 2024 and 2029
- 13.4 Market opportunities/restraints
14 Competitive Landscape
- 14.1 Overview
- 14.2 Competitive Landscape
- Overview on criticality of inputs and factors of differentiation
- 14.3 Landscape disruption
- Overview on factors of disruption
- 14.4 Industry risks
- Impact of key risks on business
15 Competitive Analysis
- 15.1 Companies profiled
- Companies covered
- 15.2 Company ranking index
- Company ranking index
- 15.3 Market positioning of companies
- Matrix on companies position and classification
- 15.4 Animo B.V.
- Animo B.V. - Overview
- Animo B.V. - Product / Service
- Animo B.V. - Key offerings
- SWOT
- 15.5 Bunn O Matic Corp.
- Bunn O Matic Corp. - Overview
- Bunn O Matic Corp. - Product / Service
- Bunn O Matic Corp. - Key offerings
- SWOT
- 15.6 Clive Coffee
- Clive Coffee - Overview
- Clive Coffee - Product / Service
- Clive Coffee - Key offerings
- SWOT
- 15.7 Coffee Day Enterprises Ltd.
- Coffee Day Enterprises Ltd. - Overview
- Coffee Day Enterprises Ltd. - Business segments
- Coffee Day Enterprises Ltd. - Key offerings
- Coffee Day Enterprises Ltd. - Segment focus
- SWOT
- 15.8 Danone SA
- Danone SA - Overview
- Danone SA - Business segments
- Danone SA - Key news
- Danone SA - Key offerings
- Danone SA - Segment focus
- SWOT
- 15.9 DeLonghi Group
- DeLonghi Group - Overview
- DeLonghi Group - Business segments
- DeLonghi Group - Key offerings
- DeLonghi Group - Segment focus
- SWOT
- 15.10 Farmer Bros Co.
- Farmer Bros Co. - Overview
- Farmer Bros Co. - Product / Service
- Farmer Bros Co. - Key offerings
- SWOT
- 15.11 Hamilton Beach Brands Inc.
- Hamilton Beach Brands Inc. - Overview
- Hamilton Beach Brands Inc. - Product / Service
- Hamilton Beach Brands Inc. - Key offerings
- SWOT
- 15.12 JURA Elektroapparate AG
- JURA Elektroapparate AG - Overview
- JURA Elektroapparate AG - Business segments
- JURA Elektroapparate AG - Key offerings
- JURA Elektroapparate AG - Segment focus
- SWOT
- 15.13 Keurig Green Mountain Inc.
- Keurig Green Mountain Inc. - Overview
- Keurig Green Mountain Inc. - Product / Service
- Keurig Green Mountain Inc. - Key offerings
- SWOT
- 15.14 Koninklijke Philips NV
- Koninklijke Philips NV - Overview
- Koninklijke Philips NV - Business segments
- Koninklijke Philips NV - Key news
- Koninklijke Philips NV - Key offerings
- Koninklijke Philips NV - Segment focus
- SWOT
- 15.15 Nestle SA
- Nestle SA - Overview
- Nestle SA - Business segments
- Nestle SA - Key news
- Nestle SA - Key offerings
- Nestle SA - Segment focus
- SWOT
- 15.16 Newell Brands Inc.
- Newell Brands Inc. - Overview
- Newell Brands Inc. - Business segments
- Newell Brands Inc. - Key offerings
- Newell Brands Inc. - Segment focus
- SWOT
- 15.17 Groupe SEB
- Groupe SEB - Overview
- Groupe SEB - Business segments
- Groupe SEB - Key offerings
- Groupe SEB - Segment focus
- SWOT
- 15.18 The Coca Cola Co.
- The Coca Cola Co. - Overview
- The Coca Cola Co. - Business segments
- The Coca Cola Co. - Key news
- The Coca Cola Co. - Key offerings
- The Coca Cola Co. - Segment focus
- SWOT
16 Appendix
- 16.1 Scope of the report
- 16.2 Inclusions and exclusions checklist
- Inclusions checklist
- Exclusions checklist
- 16.3 Currency conversion rates for US$
- Currency conversion rates for US$
- 16.4 Research methodology
- Research methodology
- 16.5 Data procurement
- Information sources
- 16.6 Data validation
- Data validation
- 16.7 Validation techniques employed for market sizing
- Validation techniques employed for market sizing
- 16.8 Data synthesis
- Data synthesis
- 16.9 360 degree market analysis
- 360 degree market analysis
- 16.10 List of abbreviations
- List of abbreviations

