|
|
市場調査レポート
商品コード
1915337
世界のがん支持療法市場2025-2029年Global Cancer Supportive Care Market 2025-2029 |
||||||
|
|||||||
カスタマイズ可能
|
|||||||

| 世界のがん支持療法市場2025-2029年 |
|
出版日: 2026年01月19日
発行: TechNavio
ページ情報: 英文 314 Pages
納期: 即納可能
|

概要
世界のがん支持療法市場は、2024年から2029年の予測期間において、CAGR 4.4%で67億2,350万米ドル規模に成長すると予測されております。
本報告書では、世界のがん支持療法市場に関する包括的な分析、市場規模と予測、動向、成長要因、課題に加え、約25社のベンダー分析を提供しております。
本レポートは、現在の市場状況、最新の動向と促進要因、市場環境全般に関する最新の分析を提供します。市場は、がん症例の増加、がん治療に伴う多くの副作用、発展途上国における未開拓の可能性によって牽引されています。
本調査は、業界の主要関係者からの情報を含む一次情報と二次情報を客観的に組み合わせて実施されました。本レポートには、主要企業の分析に加え、包括的な市場規模データ、地域別分析を伴うセグメント、ベンダー情勢が含まれています。レポートには過去データと予測データが記載されています。
| 市場範囲 | |
|---|---|
| 基準年 | 2025年 |
| 終了年 | 2029年 |
| 予測期間 | 2025-2029 |
| 成長モメンタム | 加速 |
| 前年比 | 4.1% |
| CAGR | 4.4% |
| 増分額 | 67億2,350万米ドル |
本調査では、がん関連治療におけるバイオシミラーの登場が、今後数年間における世界のがん支持療法市場成長を牽引する主要な要因の一つであると特定しております。また、バイオシミラー製造活動の外部委託や様々な戦略の導入により、市場において相当な需要が生じると見込まれます。
目次
第1章 エグゼクティブサマリー
第2章 Technavio分析
- 価格・ライフサイクル・顧客購入バスケット・採用率・購入基準の分析
- インプットの重要性と差別化の要因
- 混乱の要因
- 促進要因と課題の影響
第3章 市場情勢
- 市場エコシステム
- 市場の特徴
- バリューチェーン分析
第4章 市場規模
- 市場の定義
- 市場セグメント分析
- 市場規模 2024
- 市場の見通し 2024-2029
第5章 市場規模実績
- 世界のがん支持療法市場 2019-2023
- 治療領域別セグメント分析 2019-2023
- 流通チャネルセグメント分析 2019-2023
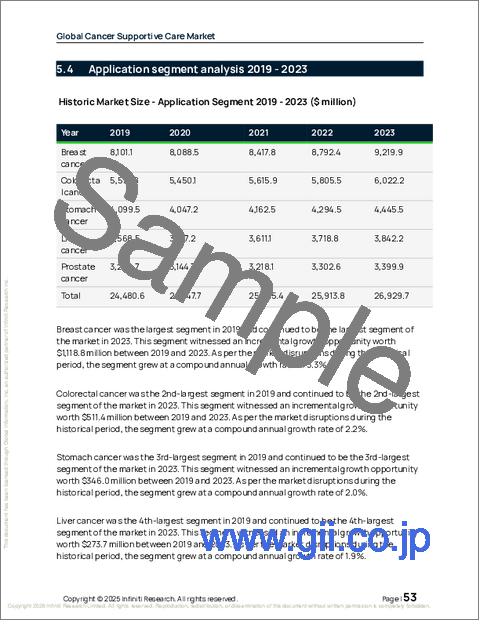
- 用途別セグメント分析 2019-2023
- 地域別セグメント分析 2019-2023
- 国別セグメント分析 2019-2023
第6章 定性分析
- AIの影響:世界のがん支持療法市場
第7章 ファイブフォース分析
- ファイブフォースの要約
- 買い手の交渉力
- 供給企業の交渉力
- 新規参入業者の脅威
- 代替品の脅威
- 競争の脅威
- 市況
第8章 市場セグメンテーション:治癒領域別
- 比較:治癒領域別
- 化学療法による貧血
- 化学療法による好中球減少症
- がん性疼痛
- 化学療法誘発性悪心・嘔吐(CINV)
- その他
- 市場機会:治癒領域別
第9章 市場セグメンテーション:流通チャネル別
- 比較:流通チャネル別
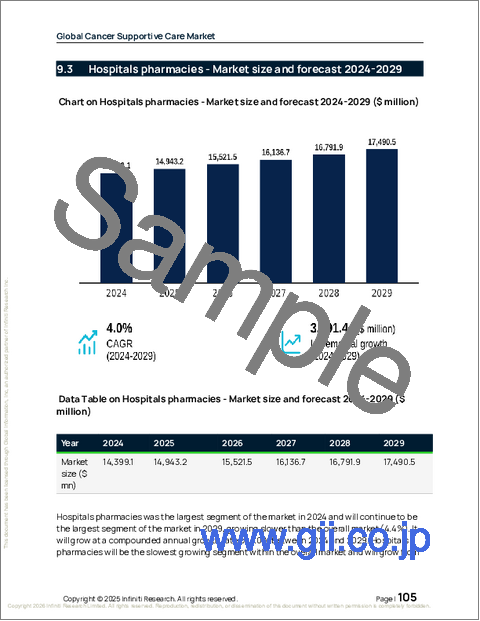
- 病院薬局
- ドラッグストアおよび小売薬局
- オンラインプロバイダー
- 市場機会:流通チャネル別
第10章 市場セグメンテーション:用途別
- 比較:用途別
- 乳がん
- 大腸がん
- 胃がん
- 肝臓がん
- 前立腺がん
- 市場機会:用途別
第11章 顧客情勢
第12章 地域別情勢
- 地域別セグメンテーション
- 地域別比較
- 北米
- 米国
- カナダ
- メキシコ
- 欧州
- 英国
- ドイツ
- フランス
- イタリア
- オランダ
- スペイン
- アジア
- 中国
- 日本
- インド
- 韓国
- インドネシア
- 世界のその他の地域
- ブラジル
- サウジアラビア
- アルゼンチン
- オーストラリア
- アラブ首長国連邦
- コロンビア
- 南アフリカ
- イスラエル
- トルコ
- 市場機会:地域別
第13章 促進要因・課題・機会
- 市場促進要因
- 市場の課題
- 促進要因と課題の影響
- 市場機会
第14章 競合情勢
- 概要
- 競合情勢
- 混乱の状況
- 業界のリスク
第15章 競合分析
- 企業プロファイル
- 企業ランキング指標
- 企業の市場ポジショニング
- Amgen Inc.
- Baxter International Inc.
- Bayer AG
- Daiichi Sankyo Co. Ltd.
- F. Hoffmann La Roche Ltd.
- GlaxoSmithKline Plc
- Helsinn Healthcare SA
- Heron Therapeutics Inc.
- Johnson and Johnson Services
- Kyowa Kirin Co. Ltd.
- Merck and Co. Inc.
- Novartis AG
- Sanofi SA
- Sun Pharmaceutical Industries Ltd.
- Teva Pharmaceutical Ltd.

