|
|
市場調査レポート
商品コード
1502138
プラスチック添加剤の世界市場 2024-2028Global plastic additives market 2024-2028 |
||||||
|
|||||||
カスタマイズ可能
|
|||||||


| プラスチック添加剤の世界市場 2024-2028 |
|
出版日: 2024年05月20日
発行: TechNavio
ページ情報: 英文 189 Pages
納期: 即納可能
|

全表示
- 概要
- 図表
- 目次
Technavio社は、プラスチック添加剤市場を調査し、2023年から2028年にかけて219億米ドル、予測期間中のCAGRは6.69%で成長すると予測しています。
当レポートでは、プラスチック添加剤市場の全体的な分析、市場規模・予測、動向、成長促進要因、課題、約25のベンダーを網羅したベンダー分析などを掲載しています。
現在の市場シナリオ、最新動向と促進要因、市場環境全体に関する最新分析を提供しています。市場を牽引しているのは、包装業界における再生プラスチック需要の増加、新興諸国におけるプラスチック添加剤の需要拡大、eコマース市場の需要拡大などです。
| 市場範囲 | |
|---|---|
| 基準年 | 2024 |
| 終了年 | 2028 |
| 予測期間 | 2024-2028 |
| 成長モメンタム | 加速 |
| 前年比2024年 | 6.11% |
| CAGR | 6.69% |
| 増分額 | 219億米ドル |
本調査では、今後数年間のプラスチック添加剤市場の成長を牽引する主な理由の一つとして、バイオベースの可塑剤に対する需要の増加を挙げています。また、プラスチック廃棄物のアスファルト代替への利用や、生分解性樹脂の需要拡大も市場の大きな需要につながります。
目次
第1章 エグゼクティブサマリー
- 市場概要
第2章 市場情勢
- 市場エコシステム
- 市場の特徴
- バリューチェーン分析
第3章 市場規模の評価
- 市場の定義
- 市場セグメント分析
- 市場規模 2023
- 市場の見通し 2023-2028
第4章 市場規模実績
- 世界プラスチック添加剤市場 2018-2022
- タイプ別セグメント分析 2018-2022
- 用途別セグメント分析 2018-2022
- 地域別セグメント分析 2018-2022
- 国別セグメント分析 2018-2022
第5章 ファイブフォース分析
- ファイブフォースの要約
- 買い手の交渉力
- 供給企業の交渉力
- 新規参入業者の脅威
- 代替品の脅威
- 競争の脅威
- 市況
第6章 市場セグメンテーション:タイプ別
- 市場セグメンテーション
- 比較:タイプ別
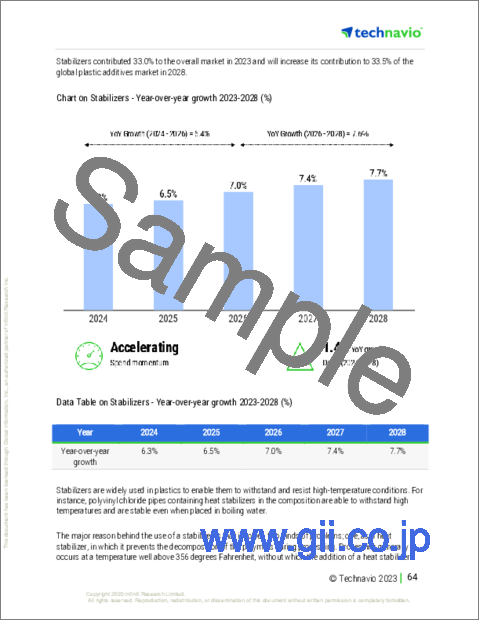
- 調整剤:市場規模と予測 2023-2028
- 安定剤:市場規模と予測 2023-2028
- 増量剤 :市場規模と予測 2023-2028
- 加工助剤:市場規模と予測 2023-2028
- 市場機会:タイプ別
第7章 市場セグメンテーション:用途別
- 市場セグメンテーション
- 比較:用途別
- 包装:市場規模と予測 2023-2028
- 消費財:市場規模と予測 2023-2028
- 自動車:市場規模と予測 2023-2028
- 電気・電子:市場規模と予測 2023-2028
- その他:市場規模と予測 2023-2028
- 市場機会:用途別
第8章 顧客情勢
- 顧客情勢の概要
第9章 地域別情勢
- 地域別セグメンテーション
- 地域別比較
- アジア太平洋:市場規模と予測 2023-2028
- 北米:市場規模と予測 2023-2028
- 欧州:市場規模と予測 2023-2028
- 南米:市場規模と予測 2023-2028
- 中東・アフリカ:市場規模と予測 2023-2028
- 中国:市場規模と予測 2023-2028
- 米国:市場規模と予測 2023-2028
- ドイツ:市場規模と予測 2023-2028
- フランス:市場規模と予測 2023-2028
- サウジアラビア:市場規模と予測 2023-2028
- 市場機会:地域別
第10章 促進要因・課題・機会・抑制要因
- 市場促進要因
- 市場の課題
- 促進要因と課題の影響
- 市場の機会・抑制要因
第11章 競合情勢
- 概要
- 競合情勢
- 混乱の状況
- 業界のリスク
第12章 競合分析
- 企業プロファイル
- 企業の市場ポジショニング
- ADEKA Corp.
- Avient Corp.
- Baerlocher GmbH
- BASF SE
- Clariant International Ltd.
- Dow Chemical Co.
- Evonik Industries AG
- Exxon Mobil Corp.
- Grafe Advanced Polymers GmbH
- Kaneka Corp.
- Lanxess AG
- Mitsui Chemicals Inc.
- Nouryon Chemicals Holding BV
- Sakai Chemical Industry Co. Ltd.
- Songwon Industrial Co. Ltd.
第13章 付録
Exhibits:
- Exhibits1: Executive Summary - Chart on Market Overview
- Exhibits2: Executive Summary - Data Table on Market Overview
- Exhibits3: Executive Summary - Chart on Global Market Characteristics
- Exhibits4: Executive Summary - Chart on Market by Geography
- Exhibits5: Executive Summary - Chart on Market Segmentation by Type
- Exhibits6: Executive Summary - Chart on Market Segmentation by Application
- Exhibits7: Executive Summary - Chart on Incremental Growth
- Exhibits8: Executive Summary - Data Table on Incremental Growth
- Exhibits9: Executive Summary - Chart on Company Market Positioning
- Exhibits10: Parent Market
- Exhibits11: Data Table on - Parent Market
- Exhibits12: Market characteristics analysis
- Exhibits13: Value Chain Analysis
- Exhibits14: Offerings of companies included in the market definition
- Exhibits15: Market segments
- Exhibits16: Chart on Global - Market size and forecast 2023-2028 ($ billion)
- Exhibits17: Data Table on Global - Market size and forecast 2023-2028 ($ billion)
- Exhibits18: Chart on Global Market: Year-over-year growth 2023-2028 (%)
- Exhibits19: Data Table on Global Market: Year-over-year growth 2023-2028 (%)
- Exhibits20: Historic Market Size - Data Table on Global Plastic Additives Market 2018 - 2022 ($ billion)
- Exhibits21: Historic Market Size - Type Segment 2018 - 2022 ($ billion)
- Exhibits22: Historic Market Size - Application Segment 2018 - 2022 ($ billion)
- Exhibits23: Historic Market Size - Geography Segment 2018 - 2022 ($ billion)
- Exhibits24: Historic Market Size - Country Segment 2018 - 2022 ($ billion)
- Exhibits25: Five forces analysis - Comparison between 2023 and 2028
- Exhibits26: Bargaining power of buyers - Impact of key factors 2023 and 2028
- Exhibits27: Bargaining power of suppliers - Impact of key factors in 2023 and 2028
- Exhibits28: Threat of new entrants - Impact of key factors in 2023 and 2028
- Exhibits29: Threat of substitutes - Impact of key factors in 2023 and 2028
- Exhibits30: Threat of rivalry - Impact of key factors in 2023 and 2028
- Exhibits31: Chart on Market condition - Five forces 2023 and 2028
- Exhibits32: Chart on Type - Market share 2023-2028 (%)
- Exhibits33: Data Table on Type - Market share 2023-2028 (%)
- Exhibits34: Chart on Comparison by Type
- Exhibits35: Data Table on Comparison by Type
- Exhibits36: Chart on Modifier - Market size and forecast 2023-2028 ($ billion)
- Exhibits37: Data Table on Modifier - Market size and forecast 2023-2028 ($ billion)
- Exhibits38: Chart on Modifier - Year-over-year growth 2023-2028 (%)
- Exhibits39: Data Table on Modifier - Year-over-year growth 2023-2028 (%)
- Exhibits40: Chart on Stabilizers - Market size and forecast 2023-2028 ($ billion)
- Exhibits41: Data Table on Stabilizers - Market size and forecast 2023-2028 ($ billion)
- Exhibits42: Chart on Stabilizers - Year-over-year growth 2023-2028 (%)
- Exhibits43: Data Table on Stabilizers - Year-over-year growth 2023-2028 (%)
- Exhibits44: Chart on Extenders - Market size and forecast 2023-2028 ($ billion)
- Exhibits45: Data Table on Extenders - Market size and forecast 2023-2028 ($ billion)
- Exhibits46: Chart on Extenders - Year-over-year growth 2023-2028 (%)
- Exhibits47: Data Table on Extenders - Year-over-year growth 2023-2028 (%)
- Exhibits48: Chart on Processing aids - Market size and forecast 2023-2028 ($ billion)
- Exhibits49: Data Table on Processing aids - Market size and forecast 2023-2028 ($ billion)
- Exhibits50: Chart on Processing aids - Year-over-year growth 2023-2028 (%)
- Exhibits51: Data Table on Processing aids - Year-over-year growth 2023-2028 (%)
- Exhibits52: Market opportunity by Type ($ billion)
- Exhibits53: Data Table on Market opportunity by Type ($ billion)
- Exhibits54: Chart on Application - Market share 2023-2028 (%)
- Exhibits55: Data Table on Application - Market share 2023-2028 (%)
- Exhibits56: Chart on Comparison by Application
- Exhibits57: Data Table on Comparison by Application
- Exhibits58: Chart on Packaging - Market size and forecast 2023-2028 ($ billion)
- Exhibits59: Data Table on Packaging - Market size and forecast 2023-2028 ($ billion)
- Exhibits60: Chart on Packaging - Year-over-year growth 2023-2028 (%)
- Exhibits61: Data Table on Packaging - Year-over-year growth 2023-2028 (%)
- Exhibits62: Chart on Consumer goods - Market size and forecast 2023-2028 ($ billion)
- Exhibits63: Data Table on Consumer goods - Market size and forecast 2023-2028 ($ billion)
- Exhibits64: Chart on Consumer goods - Year-over-year growth 2023-2028 (%)
- Exhibits65: Data Table on Consumer goods - Year-over-year growth 2023-2028 (%)
- Exhibits66: Chart on Automotive - Market size and forecast 2023-2028 ($ billion)
- Exhibits67: Data Table on Automotive - Market size and forecast 2023-2028 ($ billion)
- Exhibits68: Chart on Automotive - Year-over-year growth 2023-2028 (%)
- Exhibits69: Data Table on Automotive - Year-over-year growth 2023-2028 (%)
- Exhibits70: Chart on Electrical and electronics - Market size and forecast 2023-2028 ($ billion)
- Exhibits71: Data Table on Electrical and electronics - Market size and forecast 2023-2028 ($ billion)
- Exhibits72: Chart on Electrical and electronics - Year-over-year growth 2023-2028 (%)
- Exhibits73: Data Table on Electrical and electronics - Year-over-year growth 2023-2028 (%)
- Exhibits74: Chart on Others - Market size and forecast 2023-2028 ($ billion)
- Exhibits75: Data Table on Others - Market size and forecast 2023-2028 ($ billion)
- Exhibits76: Chart on Others - Year-over-year growth 2023-2028 (%)
- Exhibits77: Data Table on Others - Year-over-year growth 2023-2028 (%)
- Exhibits78: Market opportunity by Application ($ billion)
- Exhibits79: Data Table on Market opportunity by Application ($ billion)
- Exhibits80: Analysis of price sensitivity, lifecycle, customer purchase basket, adoption rates, and purchase criteria
- Exhibits81: Chart on Market share By Geographical Landscape2023-2028 (%)
- Exhibits82: Data Table on Market share By Geographical Landscape2023-2028 (%)
- Exhibits83: Chart on Geographic comparison
- Exhibits84: Data Table on Geographic comparison
- Exhibits85: Chart on APAC - Market size and forecast 2023-2028 ($ billion)
- Exhibits86: Data Table on APAC - Market size and forecast 2023-2028 ($ billion)
- Exhibits87: Chart on APAC - Year-over-year growth 2023-2028 (%)
- Exhibits88: Data Table on APAC - Year-over-year growth 2023-2028 (%)
- Exhibits89: Chart on North America - Market size and forecast 2023-2028 ($ billion)
- Exhibits90: Data Table on North America - Market size and forecast 2023-2028 ($ billion)
- Exhibits91: Chart on North America - Year-over-year growth 2023-2028 (%)
- Exhibits92: Data Table on North America - Year-over-year growth 2023-2028 (%)
- Exhibits93: Chart on Europe - Market size and forecast 2023-2028 ($ billion)
- Exhibits94: Data Table on Europe - Market size and forecast 2023-2028 ($ billion)
- Exhibits95: Chart on Europe - Year-over-year growth 2023-2028 (%)
- Exhibits96: Data Table on Europe - Year-over-year growth 2023-2028 (%)
- Exhibits97: Chart on South America - Market size and forecast 2023-2028 ($ billion)
- Exhibits98: Data Table on South America - Market size and forecast 2023-2028 ($ billion)
- Exhibits99: Chart on South America - Year-over-year growth 2023-2028 (%)
- Exhibits100: Data Table on South America - Year-over-year growth 2023-2028 (%)
- Exhibits101: Chart on Middle East and Africa - Market size and forecast 2023-2028 ($ billion)
- Exhibits102: Data Table on Middle East and Africa - Market size and forecast 2023-2028 ($ billion)
- Exhibits103: Chart on Middle East and Africa - Year-over-year growth 2023-2028 (%)
- Exhibits104: Data Table on Middle East and Africa - Year-over-year growth 2023-2028 (%)
- Exhibits105: Chart on China - Market size and forecast 2023-2028 ($ billion)
- Exhibits106: Data Table on China - Market size and forecast 2023-2028 ($ billion)
- Exhibits107: Chart on China - Year-over-year growth 2023-2028 (%)
- Exhibits108: Data Table on China - Year-over-year growth 2023-2028 (%)
- Exhibits109: Chart on US - Market size and forecast 2023-2028 ($ billion)
- Exhibits110: Data Table on US - Market size and forecast 2023-2028 ($ billion)
- Exhibits111: Chart on US - Year-over-year growth 2023-2028 (%)
- Exhibits112: Data Table on US - Year-over-year growth 2023-2028 (%)
- Exhibits113: Chart on Germany - Market size and forecast 2023-2028 ($ billion)
- Exhibits114: Data Table on Germany - Market size and forecast 2023-2028 ($ billion)
- Exhibits115: Chart on Germany - Year-over-year growth 2023-2028 (%)
- Exhibits116: Data Table on Germany - Year-over-year growth 2023-2028 (%)
- Exhibits117: Chart on France - Market size and forecast 2023-2028 ($ billion)
- Exhibits118: Data Table on France - Market size and forecast 2023-2028 ($ billion)
- Exhibits119: Chart on France - Year-over-year growth 2023-2028 (%)
- Exhibits120: Data Table on France - Year-over-year growth 2023-2028 (%)
- Exhibits121: Chart on Saudi Arabia - Market size and forecast 2023-2028 ($ billion)
- Exhibits122: Data Table on Saudi Arabia - Market size and forecast 2023-2028 ($ billion)
- Exhibits123: Chart on Saudi Arabia - Year-over-year growth 2023-2028 (%)
- Exhibits124: Data Table on Saudi Arabia - Year-over-year growth 2023-2028 (%)
- Exhibits125: Market opportunity By Geographical Landscape($ billion)
- Exhibits126: Data Tables on Market opportunity By Geographical Landscape($ billion)
- Exhibits127: Impact of drivers and challenges in 2023 and 2028
- Exhibits128: Overview on criticality of inputs and factors of differentiation
- Exhibits129: Overview on factors of disruption
- Exhibits130: Impact of key risks on business
- Exhibits131: Companies covered
- Exhibits132: Matrix on companies position and classification
- Exhibits133: ADEKA Corp. - Overview
- Exhibits134: ADEKA Corp. - Business segments
- Exhibits135: ADEKA Corp. - Key offerings
- Exhibits136: ADEKA Corp. - Segment focus
- Exhibits137: Avient Corp. - Overview
- Exhibits138: Avient Corp. - Business segments
- Exhibits139: Avient Corp. - Key offerings
- Exhibits140: Avient Corp. - Segment focus
- Exhibits141: Baerlocher GmbH - Overview
- Exhibits142: Baerlocher GmbH - Product / Service
- Exhibits143: Baerlocher GmbH - Key offerings
- Exhibits144: BASF SE - Overview
- Exhibits145: BASF SE - Business segments
- Exhibits146: BASF SE - Key news
- Exhibits147: BASF SE - Key offerings
- Exhibits148: BASF SE - Segment focus
- Exhibits149: Clariant International Ltd. - Overview
- Exhibits150: Clariant International Ltd. - Business segments
- Exhibits151: Clariant International Ltd. - Key news
- Exhibits152: Clariant International Ltd. - Key offerings
- Exhibits153: Clariant International Ltd. - Segment focus
- Exhibits154: Dow Chemical Co. - Overview
- Exhibits155: Dow Chemical Co. - Business segments
- Exhibits156: Dow Chemical Co. - Key news
- Exhibits157: Dow Chemical Co. - Key offerings
- Exhibits158: Dow Chemical Co. - Segment focus
- Exhibits159: Evonik Industries AG - Overview
- Exhibits160: Evonik Industries AG - Business segments
- Exhibits161: Evonik Industries AG - Key offerings
- Exhibits162: Evonik Industries AG - Segment focus
- Exhibits163: Exxon Mobil Corp. - Overview
- Exhibits164: Exxon Mobil Corp. - Business segments
- Exhibits165: Exxon Mobil Corp. - Key offerings
- Exhibits166: Exxon Mobil Corp. - Segment focus
- Exhibits167: Grafe Advanced Polymers GmbH - Overview
- Exhibits168: Grafe Advanced Polymers GmbH - Product / Service
- Exhibits169: Grafe Advanced Polymers GmbH - Key offerings
- Exhibits170: Kaneka Corp. - Overview
- Exhibits171: Kaneka Corp. - Business segments
- Exhibits172: Kaneka Corp. - Key offerings
- Exhibits173: Kaneka Corp. - Segment focus
- Exhibits174: Lanxess AG - Overview
- Exhibits175: Lanxess AG - Business segments
- Exhibits176: Lanxess AG - Key news
- Exhibits177: Lanxess AG - Key offerings
- Exhibits178: Lanxess AG - Segment focus
- Exhibits179: Mitsui Chemicals Inc. - Overview
- Exhibits180: Mitsui Chemicals Inc. - Business segments
- Exhibits181: Mitsui Chemicals Inc. - Key offerings
- Exhibits182: Mitsui Chemicals Inc. - Segment focus
- Exhibits183: Nouryon Chemicals Holding BV - Overview
- Exhibits184: Nouryon Chemicals Holding BV - Product / Service
- Exhibits185: Nouryon Chemicals Holding BV - Key offerings
- Exhibits186: Sakai Chemical Industry Co. Ltd. - Overview
- Exhibits187: Sakai Chemical Industry Co. Ltd. - Product / Service
- Exhibits188: Sakai Chemical Industry Co. Ltd. - Key offerings
- Exhibits189: Songwon Industrial Co. Ltd. - Overview
- Exhibits190: Songwon Industrial Co. Ltd. - Business segments
- Exhibits191: Songwon Industrial Co. Ltd. - Key offerings
- Exhibits192: Songwon Industrial Co. Ltd. - Segment focus
- Exhibits193: Inclusions checklist
- Exhibits194: Exclusions checklist
- Exhibits195: Currency conversion rates for US$
- Exhibits196: Research methodology
- Exhibits197: Information sources
- Exhibits198: Data validation
- Exhibits199: Validation techniques employed for market sizing
- Exhibits200: Data synthesis
- Exhibits201: 360 degree market analysis
- Exhibits202: List of abbreviations
Technavio has been monitoring the plastic additives market and is forecast to grow by USD 21.9 bn during 2023-2028, accelerating at a CAGR of 6.69% during the forecast period. Our report on the plastic additives market provides a holistic analysis, market size and forecast, trends, growth drivers, and challenges, as well as vendor analysis covering around 25 vendors.
The report offers an up-to-date analysis regarding the current market scenario, the latest trends and drivers, and the overall market environment. The market is driven by increasing demand for recycled plastics from packaging industry, developing countries to boost the demand for plastic additives, and increased demand from e-commerce market.
Technavio's plastic additives market is segmented as below:
| Market Scope | |
|---|---|
| Base Year | 2024 |
| End Year | 2028 |
| Series Year | 2024-2028 |
| Growth Momentum | Accelerate |
| YOY 2024 | 6.11% |
| CAGR | 6.69% |
| Incremental Value | $21.9bn |
By Type
- Modifier
- Stabilizers
- Extenders
- Processing aids
By Application
- Packaging
- Consumer goods
- Automotive
- Electrical and electronics
- Others
By Geography
- APAC
- North America
- Europe
- South America
- Middle East and Africa
This study identifies the increasing demand for bio-based plasticizers as one of the prime reasons driving the plastic additives market growth during the next few years. Also, use of plastic waste for bitumen replacement and growing demand for biodegradable resins will lead to sizable demand in the market.
Technavio presents a detailed picture of the market by the way of study, synthesis, and summation of data from multiple sources by an analysis of key parameters. Our report on the plastic additives market covers the following areas:
- Plastic additives market sizing
- Plastic additives market forecast
- Plastic additives market industry analysis
Technavio's robust vendor analysis is designed to help clients improve their market position, and in line with this, this report provides a detailed analysis of several leading plastic additives market vendors that include ADEKA Corp., Albemarle Corp., Avient Corp., Baerlocher GmbH, BASF SE, Clariant International Ltd., Covestro AG, Dow Chemical Co., Evonik Industries AG, Exxon Mobil Corp., Grafe Advanced Polymers GmbH, Kaneka Corp., Lanxess AG, Milliken and Co., Mitsui Chemicals Inc., Nouryon Chemicals Holding BV, PMC Group Inc., Sabo Spa, Sakai Chemical Industry Co. Ltd., and Songwon Industrial Co. Ltd.. Also, the plastic additives market analysis report includes information on upcoming trends and challenges that will influence market growth. This is to help companies strategize and leverage all forthcoming growth opportunities.
The study was conducted using an objective combination of primary and secondary information including inputs from key participants in the industry. The report contains a comprehensive market and vendor landscape in addition to an analysis of the key vendors.
Technavio presents a detailed picture of the market by the way of study, synthesis, and summation of data from multiple sources by an analysis of key parameters such as profit, pricing, competition, and promotions. It presents various market facets by identifying the key industry influencers. The data presented is comprehensive, reliable, and a result of extensive research - both primary and secondary. Technavio's market research reports provide a complete competitive landscape and an in-depth vendor selection methodology and analysis using qualitative and quantitative research to forecast accurate market growth.
Table of Contents
1 Executive Summary
- 1.1 Market overview
- Executive Summary - Chart on Market Overview
- Executive Summary - Data Table on Market Overview
- Executive Summary - Chart on Global Market Characteristics
- Executive Summary - Chart on Market by Geography
- Executive Summary - Chart on Market Segmentation by Type
- Executive Summary - Chart on Market Segmentation by Application
- Executive Summary - Chart on Incremental Growth
- Executive Summary - Data Table on Incremental Growth
- Executive Summary - Chart on Company Market Positioning
2 Market Landscape
- 2.1 Market ecosystem
- Parent Market
- Data Table on - Parent Market
- 2.2 Market characteristics
- Market characteristics analysis
- 2.3 Value chain analysis
- Value Chain Analysis
3 Market Sizing
- 3.1 Market definition
- Offerings of companies included in the market definition
- 3.2 Market segment analysis
- Market segments
- 3.3 Market size 2023
- 3.4 Market outlook: Forecast for 2023-2028
- Chart on Global - Market size and forecast 2023-2028 ($ billion)
- Data Table on Global - Market size and forecast 2023-2028 ($ billion)
- Chart on Global Market: Year-over-year growth 2023-2028 (%)
- Data Table on Global Market: Year-over-year growth 2023-2028 (%)
4 Historic Market Size
- 4.1 Global Plastic Additives Market 2018 - 2022
- Historic Market Size - Data Table on Global Plastic Additives Market 2018 - 2022 ($ billion)
- 4.2 Type segment analysis 2018 - 2022
- Historic Market Size - Type Segment 2018 - 2022 ($ billion)
- 4.3 Application segment analysis 2018 - 2022
- Historic Market Size - Application Segment 2018 - 2022 ($ billion)
- 4.4 Geography segment analysis 2018 - 2022
- Historic Market Size - Geography Segment 2018 - 2022 ($ billion)
- 4.5 Country segment analysis 2018 - 2022
- Historic Market Size - Country Segment 2018 - 2022 ($ billion)
5 Five Forces Analysis
- 5.1 Five forces summary
- Five forces analysis - Comparison between 2023 and 2028
- 5.2 Bargaining power of buyers
- Bargaining power of buyers - Impact of key factors 2023 and 2028
- 5.3 Bargaining power of suppliers
- Bargaining power of suppliers - Impact of key factors in 2023 and 2028
- 5.4 Threat of new entrants
- Threat of new entrants - Impact of key factors in 2023 and 2028
- 5.5 Threat of substitutes
- Threat of substitutes - Impact of key factors in 2023 and 2028
- 5.6 Threat of rivalry
- Threat of rivalry - Impact of key factors in 2023 and 2028
- 5.7 Market condition
- Chart on Market condition - Five forces 2023 and 2028
6 Market Segmentation by Type
- 6.1 Market segments
- Chart on Type - Market share 2023-2028 (%)
- Data Table on Type - Market share 2023-2028 (%)
- 6.2 Comparison by Type
- Chart on Comparison by Type
- Data Table on Comparison by Type
- 6.3 Modifier - Market size and forecast 2023-2028
- Chart on Modifier - Market size and forecast 2023-2028 ($ billion)
- Data Table on Modifier - Market size and forecast 2023-2028 ($ billion)
- Chart on Modifier - Year-over-year growth 2023-2028 (%)
- Data Table on Modifier - Year-over-year growth 2023-2028 (%)
- 6.4 Stabilizers - Market size and forecast 2023-2028
- Chart on Stabilizers - Market size and forecast 2023-2028 ($ billion)
- Data Table on Stabilizers - Market size and forecast 2023-2028 ($ billion)
- Chart on Stabilizers - Year-over-year growth 2023-2028 (%)
- Data Table on Stabilizers - Year-over-year growth 2023-2028 (%)
- 6.5 Extenders - Market size and forecast 2023-2028
- Chart on Extenders - Market size and forecast 2023-2028 ($ billion)
- Data Table on Extenders - Market size and forecast 2023-2028 ($ billion)
- Chart on Extenders - Year-over-year growth 2023-2028 (%)
- Data Table on Extenders - Year-over-year growth 2023-2028 (%)
- 6.6 Processing aids - Market size and forecast 2023-2028
- Chart on Processing aids - Market size and forecast 2023-2028 ($ billion)
- Data Table on Processing aids - Market size and forecast 2023-2028 ($ billion)
- Chart on Processing aids - Year-over-year growth 2023-2028 (%)
- Data Table on Processing aids - Year-over-year growth 2023-2028 (%)
- 6.7 Market opportunity by Type
- Market opportunity by Type ($ billion)
- Data Table on Market opportunity by Type ($ billion)
7 Market Segmentation by Application
- 7.1 Market segments
- Chart on Application - Market share 2023-2028 (%)
- Data Table on Application - Market share 2023-2028 (%)
- 7.2 Comparison by Application
- Chart on Comparison by Application
- Data Table on Comparison by Application
- 7.3 Packaging - Market size and forecast 2023-2028
- Chart on Packaging - Market size and forecast 2023-2028 ($ billion)
- Data Table on Packaging - Market size and forecast 2023-2028 ($ billion)
- Chart on Packaging - Year-over-year growth 2023-2028 (%)
- Data Table on Packaging - Year-over-year growth 2023-2028 (%)
- 7.4 Consumer goods - Market size and forecast 2023-2028
- Chart on Consumer goods - Market size and forecast 2023-2028 ($ billion)
- Data Table on Consumer goods - Market size and forecast 2023-2028 ($ billion)
- Chart on Consumer goods - Year-over-year growth 2023-2028 (%)
- Data Table on Consumer goods - Year-over-year growth 2023-2028 (%)
- 7.5 Automotive - Market size and forecast 2023-2028
- Chart on Automotive - Market size and forecast 2023-2028 ($ billion)
- Data Table on Automotive - Market size and forecast 2023-2028 ($ billion)
- Chart on Automotive - Year-over-year growth 2023-2028 (%)
- Data Table on Automotive - Year-over-year growth 2023-2028 (%)
- 7.6 Electrical and electronics - Market size and forecast 2023-2028
- Chart on Electrical and electronics - Market size and forecast 2023-2028 ($ billion)
- Data Table on Electrical and electronics - Market size and forecast 2023-2028 ($ billion)
- Chart on Electrical and electronics - Year-over-year growth 2023-2028 (%)
- Data Table on Electrical and electronics - Year-over-year growth 2023-2028 (%)
- 7.7 Others - Market size and forecast 2023-2028
- Chart on Others - Market size and forecast 2023-2028 ($ billion)
- Data Table on Others - Market size and forecast 2023-2028 ($ billion)
- Chart on Others - Year-over-year growth 2023-2028 (%)
- Data Table on Others - Year-over-year growth 2023-2028 (%)
- 7.8 Market opportunity by Application
- Market opportunity by Application ($ billion)
- Data Table on Market opportunity by Application ($ billion)
8 Customer Landscape
- 8.1 Customer landscape overview
- Analysis of price sensitivity, lifecycle, customer purchase basket, adoption rates, and purchase criteria
9 Geographic Landscape
- 9.1 Geographic segmentation
- Chart on Market share By Geographical Landscape2023-2028 (%)
- Data Table on Market share By Geographical Landscape2023-2028 (%)
- 9.2 Geographic comparison
- Chart on Geographic comparison
- Data Table on Geographic comparison
- 9.3 APAC - Market size and forecast 2023-2028
- Chart on APAC - Market size and forecast 2023-2028 ($ billion)
- Data Table on APAC - Market size and forecast 2023-2028 ($ billion)
- Chart on APAC - Year-over-year growth 2023-2028 (%)
- Data Table on APAC - Year-over-year growth 2023-2028 (%)
- 9.4 North America - Market size and forecast 2023-2028
- Chart on North America - Market size and forecast 2023-2028 ($ billion)
- Data Table on North America - Market size and forecast 2023-2028 ($ billion)
- Chart on North America - Year-over-year growth 2023-2028 (%)
- Data Table on North America - Year-over-year growth 2023-2028 (%)
- 9.5 Europe - Market size and forecast 2023-2028
- Chart on Europe - Market size and forecast 2023-2028 ($ billion)
- Data Table on Europe - Market size and forecast 2023-2028 ($ billion)
- Chart on Europe - Year-over-year growth 2023-2028 (%)
- Data Table on Europe - Year-over-year growth 2023-2028 (%)
- 9.6 South America - Market size and forecast 2023-2028
- Chart on South America - Market size and forecast 2023-2028 ($ billion)
- Data Table on South America - Market size and forecast 2023-2028 ($ billion)
- Chart on South America - Year-over-year growth 2023-2028 (%)
- Data Table on South America - Year-over-year growth 2023-2028 (%)
- 9.7 Middle East and Africa - Market size and forecast 2023-2028
- Chart on Middle East and Africa - Market size and forecast 2023-2028 ($ billion)
- Data Table on Middle East and Africa - Market size and forecast 2023-2028 ($ billion)
- Chart on Middle East and Africa - Year-over-year growth 2023-2028 (%)
- Data Table on Middle East and Africa - Year-over-year growth 2023-2028 (%)
- 9.8 China - Market size and forecast 2023-2028
- Chart on China - Market size and forecast 2023-2028 ($ billion)
- Data Table on China - Market size and forecast 2023-2028 ($ billion)
- Chart on China - Year-over-year growth 2023-2028 (%)
- Data Table on China - Year-over-year growth 2023-2028 (%)
- 9.9 US - Market size and forecast 2023-2028
- Chart on US - Market size and forecast 2023-2028 ($ billion)
- Data Table on US - Market size and forecast 2023-2028 ($ billion)
- Chart on US - Year-over-year growth 2023-2028 (%)
- Data Table on US - Year-over-year growth 2023-2028 (%)
- 9.10 Germany - Market size and forecast 2023-2028
- Chart on Germany - Market size and forecast 2023-2028 ($ billion)
- Data Table on Germany - Market size and forecast 2023-2028 ($ billion)
- Chart on Germany - Year-over-year growth 2023-2028 (%)
- Data Table on Germany - Year-over-year growth 2023-2028 (%)
- 9.11 France - Market size and forecast 2023-2028
- Chart on France - Market size and forecast 2023-2028 ($ billion)
- Data Table on France - Market size and forecast 2023-2028 ($ billion)
- Chart on France - Year-over-year growth 2023-2028 (%)
- Data Table on France - Year-over-year growth 2023-2028 (%)
- 9.12 Saudi Arabia - Market size and forecast 2023-2028
- Chart on Saudi Arabia - Market size and forecast 2023-2028 ($ billion)
- Data Table on Saudi Arabia - Market size and forecast 2023-2028 ($ billion)
- Chart on Saudi Arabia - Year-over-year growth 2023-2028 (%)
- Data Table on Saudi Arabia - Year-over-year growth 2023-2028 (%)
- 9.13 Market opportunity by geography
- Market opportunity By Geographical Landscape($ billion)
- Data Tables on Market opportunity By Geographical Landscape($ billion)
10 Drivers, Challenges, and Opportunity/Restraints
- 10.1 Market drivers
- 10.2 Market challenges
- 10.3 Impact of drivers and challenges
- Impact of drivers and challenges in 2023 and 2028
- 10.4 Market opportunities/restraints
11 Competitive Landscape
- 11.1 Overview
- 11.2 Competitive Landscape
- Overview on criticality of inputs and factors of differentiation
- 11.3 Landscape disruption
- Overview on factors of disruption
- 11.4 Industry risks
- Impact of key risks on business
12 Competitive Analysis
- 12.1 Companies profiled
- Companies covered
- 12.2 Market positioning of companies
- Matrix on companies position and classification
- 12.3 ADEKA Corp.
- ADEKA Corp. - Overview
- ADEKA Corp. - Business segments
- ADEKA Corp. - Key offerings
- ADEKA Corp. - Segment focus
- 12.4 Avient Corp.
- Avient Corp. - Overview
- Avient Corp. - Business segments
- Avient Corp. - Key offerings
- Avient Corp. - Segment focus
- 12.5 Baerlocher GmbH
- Baerlocher GmbH - Overview
- Baerlocher GmbH - Product / Service
- Baerlocher GmbH - Key offerings
- 12.6 BASF SE
- BASF SE - Overview
- BASF SE - Business segments
- BASF SE - Key news
- BASF SE - Key offerings
- BASF SE - Segment focus
- 12.7 Clariant International Ltd.
- Clariant International Ltd. - Overview
- Clariant International Ltd. - Business segments
- Clariant International Ltd. - Key news
- Clariant International Ltd. - Key offerings
- Clariant International Ltd. - Segment focus
- 12.8 Dow Chemical Co.
- Dow Chemical Co. - Overview
- Dow Chemical Co. - Business segments
- Dow Chemical Co. - Key news
- Dow Chemical Co. - Key offerings
- Dow Chemical Co. - Segment focus
- 12.9 Evonik Industries AG
- Evonik Industries AG - Overview
- Evonik Industries AG - Business segments
- Evonik Industries AG - Key offerings
- Evonik Industries AG - Segment focus
- 12.10 Exxon Mobil Corp.
- Exxon Mobil Corp. - Overview
- Exxon Mobil Corp. - Business segments
- Exxon Mobil Corp. - Key offerings
- Exxon Mobil Corp. - Segment focus
- 12.11 Grafe Advanced Polymers GmbH
- Grafe Advanced Polymers GmbH - Overview
- Grafe Advanced Polymers GmbH - Product / Service
- Grafe Advanced Polymers GmbH - Key offerings
- 12.12 Kaneka Corp.
- Kaneka Corp. - Overview
- Kaneka Corp. - Business segments
- Kaneka Corp. - Key offerings
- Kaneka Corp. - Segment focus
- 12.13 Lanxess AG
- Lanxess AG - Overview
- Lanxess AG - Business segments
- Lanxess AG - Key news
- Lanxess AG - Key offerings
- Lanxess AG - Segment focus
- 12.14 Mitsui Chemicals Inc.
- Mitsui Chemicals Inc. - Overview
- Mitsui Chemicals Inc. - Business segments
- Mitsui Chemicals Inc. - Key offerings
- Mitsui Chemicals Inc. - Segment focus
- 12.15 Nouryon Chemicals Holding BV
- Nouryon Chemicals Holding BV - Overview
- Nouryon Chemicals Holding BV - Product / Service
- Nouryon Chemicals Holding BV - Key offerings
- 12.16 Sakai Chemical Industry Co. Ltd.
- Sakai Chemical Industry Co. Ltd. - Overview
- Sakai Chemical Industry Co. Ltd. - Product / Service
- Sakai Chemical Industry Co. Ltd. - Key offerings
- 12.17 Songwon Industrial Co. Ltd.
- Songwon Industrial Co. Ltd. - Overview
- Songwon Industrial Co. Ltd. - Business segments
- Songwon Industrial Co. Ltd. - Key offerings
- Songwon Industrial Co. Ltd. - Segment focus
13 Appendix
- 13.1 Scope of the report
- 13.2 Inclusions and exclusions checklist
- Inclusions checklist
- Exclusions checklist
- 13.3 Currency conversion rates for US$
- Currency conversion rates for US$
- 13.4 Research methodology
- Research methodology
- 13.5 Data procurement
- Information sources
- 13.6 Data validation
- Data validation
- 13.7 Validation techniques employed for market sizing
- Validation techniques employed for market sizing
- 13.8 Data synthesis
- Data synthesis
- 13.9 360 degree market analysis
- 360 degree market analysis
- 13.10 List of abbreviations
- List of abbreviations

