|
|
市場調査レポート
商品コード
1502133
仮想デスクトップインフラ(VDI)の世界市場 2024-2028Global virtual desktop infrastructure market 2024-2028 |
||||||

|
|||||||
カスタマイズ可能
|
|||||||


| 仮想デスクトップインフラ(VDI)の世界市場 2024-2028 |
|
出版日: 2024年05月20日
発行: TechNavio
ページ情報: 英文 190 Pages
納期: 即納可能
|

全表示
- 概要
- 図表
- 目次
Technavio社は、仮想デスクトップインフラ市場を調査し、2023年から2028年にかけて75億5,240万米ドル、予測期間中のCAGRは12.6%で成長すると予測しています。
当レポートでは、仮想デスクトップインフラ市場の全体的な分析、市場規模・予測、動向、成長促進要因、課題、約25のベンダーを網羅したベンダー分析などを掲載しています。
現在の市場シナリオ、最新動向と促進要因、市場環境全体に関する最新分析を提供しています。仮想インフラストラクチャの運用と管理の容易さ、設備投資と運用経費の削減、職場の柔軟性とビジネスの俊敏性が市場を牽引しています。
| 市場範囲 | |
|---|---|
| 基準年 | 2024 |
| 終了年 | 2028 |
| 予測期間 | 2024-2028 |
| 成長モメンタム | 加速 |
| 前年比2024年 | 10.95% |
| CAGR | 12.6% |
| 増分額 | 75億5,240万米ドル |
本調査では、今後数年間の仮想デスクトップインフラ市場成長を牽引する主要因の1つとして、中小企業向けクラウドベースVDIを挙げています。また、LinuxベースのVDIの採用やVDI用ハイパーコンバージドインフラストラクチャの使用は、市場の大きな需要につながります。
目次
第1章 エグゼクティブサマリー
- 市場概要
第2章 市場情勢
- 市場エコシステム
- 市場の特徴
- バリューチェーン分析
第3章 市場規模の評価
- 市場の定義
- 市場セグメント分析
- 市場規模 2023
- 市場の見通し 2023-2028
第4章 市場規模実績
- 世界仮想デスクトップインフラ市場 2018-2022
- 用途別セグメント分析 2018-2022
- エンドユーザー別セグメント分析 2018-2022
- タイプ別セグメント分析 2018-2022
- 地域別セグメント分析 2018-2022
- 国別セグメント分析 2018-2022
第5章 ファイブフォース分析
- ファイブフォースの要約
- 買い手の交渉力
- 供給企業の交渉力
- 新規参入業者の脅威
- 代替品の脅威
- 競争の脅威
- 市況
第6章 市場セグメンテーション:用途別
- 市場セグメンテーション
- 比較:用途別
- オンプレミスVDI:市場規模と予測 2023-2028
- クラウドベースのVDI:市場規模と予測 2023-2028
- 市場機会:用途別
第7章 市場セグメンテーション:エンドユーザー別
- 市場セグメンテーション
- 比較:エンドユーザー別
- BFSI:市場規模と予測 2023-2028
- 教育:市場規模と予測 2023-2028
- ヘルスケア:市場規模と予測 2023-2028
- その他:市場規模と予測 2023-2028
- 市場機会:エンドユーザー別
第8章 市場セグメンテーション:タイプ別
- 市場セグメンテーション
- 比較:タイプ別
- サービス:市場規模と予測 2023-2028
- 新しいソフトウェアライセンス:市場規模と予測 2023-2028
- 市場機会:タイプ別
第9章 顧客情勢
- 顧客情勢の概要
第10章 地域別情勢
- 地域別セグメンテーション
- 地域別比較
- 北米:市場規模と予測 2023-2028
- 欧州:市場規模と予測 2023-2028
- アジア太平洋:市場規模と予測 2023-2028
- 南米:市場規模と予測 2023-2028
- 中東・アフリカ:市場規模と予測 2023-2028
- 米国:市場規模と予測 2023-2028
- ドイツ:市場規模と予測 2023-2028
- 英国:市場規模と予測 2023-2028
- カナダ:市場規模と予測 2023-2028
- オーストラリア:市場規模と予測 2023-2028
- 市場機会:地域別
第11章 促進要因・課題・機会・抑制要因
- 市場促進要因
- 市場の課題
- 促進要因と課題の影響
- 市場の機会・抑制要因
第12章 競合情勢
- 概要
- 競合情勢
- 混乱の状況
- 業界のリスク
第13章 競合分析
- 企業プロファイル
- 企業の市場ポジショニング
- Amazon.com Inc.
- Centerm Information Co. Ltd.
- Cisco Systems Inc.
- Citrix Systems Inc.
- Dell Technologies Inc.
- dinCloud Inc.
- Fujitsu Ltd.
- Hewlett Packard Enterprise Co.
- HiveIO Inc.
- Huawei Technologies Co. Ltd.
- Intel Corp.
- International Business Machines Corp.
- Microsoft Corp.
- Oracle Corp.
- Red Hat Inc.
第14章 付録
Exhibits:
- Exhibits1: Executive Summary - Chart on Market Overview
- Exhibits2: Executive Summary - Data Table on Market Overview
- Exhibits3: Executive Summary - Chart on Global Market Characteristics
- Exhibits4: Executive Summary - Chart on Market by Geography
- Exhibits5: Executive Summary - Chart on Market Segmentation by Application
- Exhibits6: Executive Summary - Chart on Market Segmentation by End-user
- Exhibits7: Executive Summary - Chart on Market Segmentation by Type
- Exhibits8: Executive Summary - Chart on Incremental Growth
- Exhibits9: Executive Summary - Data Table on Incremental Growth
- Exhibits10: Executive Summary - Chart on Company Market Positioning
- Exhibits11: Parent Market
- Exhibits12: Data Table on - Parent Market
- Exhibits13: Market characteristics analysis
- Exhibits14: Value Chain Analysis
- Exhibits15: Offerings of companies included in the market definition
- Exhibits16: Market segments
- Exhibits17: Chart on Global - Market size and forecast 2023-2028 ($ million)
- Exhibits18: Data Table on Global - Market size and forecast 2023-2028 ($ million)
- Exhibits19: Chart on Global Market: Year-over-year growth 2023-2028 (%)
- Exhibits20: Data Table on Global Market: Year-over-year growth 2023-2028 (%)
- Exhibits21: Historic Market Size - Data Table on Global Virtual Desktop Infrastructure Market 2018 - 2022 ($ million)
- Exhibits22: Historic Market Size - Application Segment 2018 - 2022 ($ million)
- Exhibits23: Historic Market Size - End-user Segment 2018 - 2022 ($ million)
- Exhibits24: Historic Market Size - Type Segment 2018 - 2022 ($ million)
- Exhibits25: Historic Market Size - Geography Segment 2018 - 2022 ($ million)
- Exhibits26: Historic Market Size - Country Segment 2018 - 2022 ($ million)
- Exhibits27: Five forces analysis - Comparison between 2023 and 2028
- Exhibits28: Bargaining power of buyers - Impact of key factors 2023 and 2028
- Exhibits29: Bargaining power of suppliers - Impact of key factors in 2023 and 2028
- Exhibits30: Threat of new entrants - Impact of key factors in 2023 and 2028
- Exhibits31: Threat of substitutes - Impact of key factors in 2023 and 2028
- Exhibits32: Threat of rivalry - Impact of key factors in 2023 and 2028
- Exhibits33: Chart on Market condition - Five forces 2023 and 2028
- Exhibits34: Chart on Application - Market share 2023-2028 (%)
- Exhibits35: Data Table on Application - Market share 2023-2028 (%)
- Exhibits36: Chart on Comparison by Application
- Exhibits37: Data Table on Comparison by Application
- Exhibits38: Chart on On-premise VDI - Market size and forecast 2023-2028 ($ million)
- Exhibits39: Data Table on On-premise VDI - Market size and forecast 2023-2028 ($ million)
- Exhibits40: Chart on On-premise VDI - Year-over-year growth 2023-2028 (%)
- Exhibits41: Data Table on On-premise VDI - Year-over-year growth 2023-2028 (%)
- Exhibits42: Chart on Cloud-based VDI - Market size and forecast 2023-2028 ($ million)
- Exhibits43: Data Table on Cloud-based VDI - Market size and forecast 2023-2028 ($ million)
- Exhibits44: Chart on Cloud-based VDI - Year-over-year growth 2023-2028 (%)
- Exhibits45: Data Table on Cloud-based VDI - Year-over-year growth 2023-2028 (%)
- Exhibits46: Market opportunity by Application ($ million)
- Exhibits47: Data Table on Market opportunity by Application ($ million)
- Exhibits48: Chart on End-user - Market share 2023-2028 (%)
- Exhibits49: Data Table on End-user - Market share 2023-2028 (%)
- Exhibits50: Chart on Comparison by End-user
- Exhibits51: Data Table on Comparison by End-user
- Exhibits52: Chart on BFSI - Market size and forecast 2023-2028 ($ million)
- Exhibits53: Data Table on BFSI - Market size and forecast 2023-2028 ($ million)
- Exhibits54: Chart on BFSI - Year-over-year growth 2023-2028 (%)
- Exhibits55: Data Table on BFSI - Year-over-year growth 2023-2028 (%)
- Exhibits56: Chart on Education - Market size and forecast 2023-2028 ($ million)
- Exhibits57: Data Table on Education - Market size and forecast 2023-2028 ($ million)
- Exhibits58: Chart on Education - Year-over-year growth 2023-2028 (%)
- Exhibits59: Data Table on Education - Year-over-year growth 2023-2028 (%)
- Exhibits60: Chart on Healthcare - Market size and forecast 2023-2028 ($ million)
- Exhibits61: Data Table on Healthcare - Market size and forecast 2023-2028 ($ million)
- Exhibits62: Chart on Healthcare - Year-over-year growth 2023-2028 (%)
- Exhibits63: Data Table on Healthcare - Year-over-year growth 2023-2028 (%)
- Exhibits64: Chart on Others - Market size and forecast 2023-2028 ($ million)
- Exhibits65: Data Table on Others - Market size and forecast 2023-2028 ($ million)
- Exhibits66: Chart on Others - Year-over-year growth 2023-2028 (%)
- Exhibits67: Data Table on Others - Year-over-year growth 2023-2028 (%)
- Exhibits68: Market opportunity by End-user ($ million)
- Exhibits69: Data Table on Market opportunity by End-user ($ million)
- Exhibits70: Chart on Type - Market share 2023-2028 (%)
- Exhibits71: Data Table on Type - Market share 2023-2028 (%)
- Exhibits72: Chart on Comparison by Type
- Exhibits73: Data Table on Comparison by Type
- Exhibits74: Chart on Services - Market size and forecast 2023-2028 ($ million)
- Exhibits75: Data Table on Services - Market size and forecast 2023-2028 ($ million)
- Exhibits76: Chart on Services - Year-over-year growth 2023-2028 (%)
- Exhibits77: Data Table on Services - Year-over-year growth 2023-2028 (%)
- Exhibits78: Chart on New software licenses - Market size and forecast 2023-2028 ($ million)
- Exhibits79: Data Table on New software licenses - Market size and forecast 2023-2028 ($ million)
- Exhibits80: Chart on New software licenses - Year-over-year growth 2023-2028 (%)
- Exhibits81: Data Table on New software licenses - Year-over-year growth 2023-2028 (%)
- Exhibits82: Market opportunity by Type ($ million)
- Exhibits83: Data Table on Market opportunity by Type ($ million)
- Exhibits84: Analysis of price sensitivity, lifecycle, customer purchase basket, adoption rates, and purchase criteria
- Exhibits85: Chart on Market share By Geographical Landscape2023-2028 (%)
- Exhibits86: Data Table on Market share By Geographical Landscape2023-2028 (%)
- Exhibits87: Chart on Geographic comparison
- Exhibits88: Data Table on Geographic comparison
- Exhibits89: Chart on North America - Market size and forecast 2023-2028 ($ million)
- Exhibits90: Data Table on North America - Market size and forecast 2023-2028 ($ million)
- Exhibits91: Chart on North America - Year-over-year growth 2023-2028 (%)
- Exhibits92: Data Table on North America - Year-over-year growth 2023-2028 (%)
- Exhibits93: Chart on Europe - Market size and forecast 2023-2028 ($ million)
- Exhibits94: Data Table on Europe - Market size and forecast 2023-2028 ($ million)
- Exhibits95: Chart on Europe - Year-over-year growth 2023-2028 (%)
- Exhibits96: Data Table on Europe - Year-over-year growth 2023-2028 (%)
- Exhibits97: Chart on APAC - Market size and forecast 2023-2028 ($ million)
- Exhibits98: Data Table on APAC - Market size and forecast 2023-2028 ($ million)
- Exhibits99: Chart on APAC - Year-over-year growth 2023-2028 (%)
- Exhibits100: Data Table on APAC - Year-over-year growth 2023-2028 (%)
- Exhibits101: Chart on South America - Market size and forecast 2023-2028 ($ million)
- Exhibits102: Data Table on South America - Market size and forecast 2023-2028 ($ million)
- Exhibits103: Chart on South America - Year-over-year growth 2023-2028 (%)
- Exhibits104: Data Table on South America - Year-over-year growth 2023-2028 (%)
- Exhibits105: Chart on Middle East and Africa - Market size and forecast 2023-2028 ($ million)
- Exhibits106: Data Table on Middle East and Africa - Market size and forecast 2023-2028 ($ million)
- Exhibits107: Chart on Middle East and Africa - Year-over-year growth 2023-2028 (%)
- Exhibits108: Data Table on Middle East and Africa - Year-over-year growth 2023-2028 (%)
- Exhibits109: Chart on US - Market size and forecast 2023-2028 ($ million)
- Exhibits110: Data Table on US - Market size and forecast 2023-2028 ($ million)
- Exhibits111: Chart on US - Year-over-year growth 2023-2028 (%)
- Exhibits112: Data Table on US - Year-over-year growth 2023-2028 (%)
- Exhibits113: Chart on Germany - Market size and forecast 2023-2028 ($ million)
- Exhibits114: Data Table on Germany - Market size and forecast 2023-2028 ($ million)
- Exhibits115: Chart on Germany - Year-over-year growth 2023-2028 (%)
- Exhibits116: Data Table on Germany - Year-over-year growth 2023-2028 (%)
- Exhibits117: Chart on UK - Market size and forecast 2023-2028 ($ million)
- Exhibits118: Data Table on UK - Market size and forecast 2023-2028 ($ million)
- Exhibits119: Chart on UK - Year-over-year growth 2023-2028 (%)
- Exhibits120: Data Table on UK - Year-over-year growth 2023-2028 (%)
- Exhibits121: Chart on Canada - Market size and forecast 2023-2028 ($ million)
- Exhibits122: Data Table on Canada - Market size and forecast 2023-2028 ($ million)
- Exhibits123: Chart on Canada - Year-over-year growth 2023-2028 (%)
- Exhibits124: Data Table on Canada - Year-over-year growth 2023-2028 (%)
- Exhibits125: Chart on Australia - Market size and forecast 2023-2028 ($ million)
- Exhibits126: Data Table on Australia - Market size and forecast 2023-2028 ($ million)
- Exhibits127: Chart on Australia - Year-over-year growth 2023-2028 (%)
- Exhibits128: Data Table on Australia - Year-over-year growth 2023-2028 (%)
- Exhibits129: Market opportunity By Geographical Landscape($ million)
- Exhibits130: Data Tables on Market opportunity By Geographical Landscape($ million)
- Exhibits131: Impact of drivers and challenges in 2023 and 2028
- Exhibits132: Overview on criticality of inputs and factors of differentiation
- Exhibits133: Overview on factors of disruption
- Exhibits134: Impact of key risks on business
- Exhibits135: Companies covered
- Exhibits136: Matrix on companies position and classification
- Exhibits137: Amazon.com Inc. - Overview
- Exhibits138: Amazon.com Inc. - Business segments
- Exhibits139: Amazon.com Inc. - Key news
- Exhibits140: Amazon.com Inc. - Key offerings
- Exhibits141: Amazon.com Inc. - Segment focus
- Exhibits142: Centerm Information Co. Ltd. - Overview
- Exhibits143: Centerm Information Co. Ltd. - Product / Service
- Exhibits144: Centerm Information Co. Ltd. - Key offerings
- Exhibits145: Cisco Systems Inc. - Overview
- Exhibits146: Cisco Systems Inc. - Business segments
- Exhibits147: Cisco Systems Inc. - Key news
- Exhibits148: Cisco Systems Inc. - Key offerings
- Exhibits149: Cisco Systems Inc. - Segment focus
- Exhibits150: Citrix Systems Inc. - Overview
- Exhibits151: Citrix Systems Inc. - Product / Service
- Exhibits152: Citrix Systems Inc. - Key offerings
- Exhibits153: Dell Technologies Inc. - Overview
- Exhibits154: Dell Technologies Inc. - Business segments
- Exhibits155: Dell Technologies Inc. - Key offerings
- Exhibits156: Dell Technologies Inc. - Segment focus
- Exhibits157: dinCloud Inc. - Overview
- Exhibits158: dinCloud Inc. - Product / Service
- Exhibits159: dinCloud Inc. - Key offerings
- Exhibits160: Fujitsu Ltd. - Overview
- Exhibits161: Fujitsu Ltd. - Business segments
- Exhibits162: Fujitsu Ltd. - Key news
- Exhibits163: Fujitsu Ltd. - Key offerings
- Exhibits164: Fujitsu Ltd. - Segment focus
- Exhibits165: Hewlett Packard Enterprise Co. - Overview
- Exhibits166: Hewlett Packard Enterprise Co. - Business segments
- Exhibits167: Hewlett Packard Enterprise Co. - Key news
- Exhibits168: Hewlett Packard Enterprise Co. - Key offerings
- Exhibits169: Hewlett Packard Enterprise Co. - Segment focus
- Exhibits170: HiveIO Inc. - Overview
- Exhibits171: HiveIO Inc. - Product / Service
- Exhibits172: HiveIO Inc. - Key offerings
- Exhibits173: Huawei Technologies Co. Ltd. - Overview
- Exhibits174: Huawei Technologies Co. Ltd. - Product / Service
- Exhibits175: Huawei Technologies Co. Ltd. - Key news
- Exhibits176: Huawei Technologies Co. Ltd. - Key offerings
- Exhibits177: Intel Corp. - Overview
- Exhibits178: Intel Corp. - Business segments
- Exhibits179: Intel Corp. - Key news
- Exhibits180: Intel Corp. - Key offerings
- Exhibits181: Intel Corp. - Segment focus
- Exhibits182: International Business Machines Corp. - Overview
- Exhibits183: International Business Machines Corp. - Business segments
- Exhibits184: International Business Machines Corp. - Key news
- Exhibits185: International Business Machines Corp. - Key offerings
- Exhibits186: International Business Machines Corp. - Segment focus
- Exhibits187: Microsoft Corp. - Overview
- Exhibits188: Microsoft Corp. - Business segments
- Exhibits189: Microsoft Corp. - Key news
- Exhibits190: Microsoft Corp. - Key offerings
- Exhibits191: Microsoft Corp. - Segment focus
- Exhibits192: Oracle Corp. - Overview
- Exhibits193: Oracle Corp. - Business segments
- Exhibits194: Oracle Corp. - Key news
- Exhibits195: Oracle Corp. - Key offerings
- Exhibits196: Oracle Corp. - Segment focus
- Exhibits197: Red Hat Inc. - Overview
- Exhibits198: Red Hat Inc. - Product / Service
- Exhibits199: Red Hat Inc. - Key offerings
- Exhibits200: Inclusions checklist
- Exhibits201: Exclusions checklist
- Exhibits202: Currency conversion rates for US$
- Exhibits203: Research methodology
- Exhibits204: Information sources
- Exhibits205: Data validation
- Exhibits206: Validation techniques employed for market sizing
- Exhibits207: Data synthesis
- Exhibits208: 360 degree market analysis
- Exhibits209: List of abbreviations
Technavio has been monitoring the virtual desktop infrastructure market and is forecast to grow by USD 7552.4 mn during 2023-2028, accelerating at a CAGR of 12.6% during the forecast period. Our report on the virtual desktop infrastructure market provides a holistic analysis, market size and forecast, trends, growth drivers, and challenges, as well as vendor analysis covering around 25 vendors.
The report offers an up-to-date analysis regarding the current market scenario, the latest trends and drivers, and the overall market environment. The market is driven by ease of operating and managing virtual infrastructure, reduced capex and opex, and workplace flexibility and business agility.
Technavio's virtual desktop infrastructure market is segmented as below:
| Market Scope | |
|---|---|
| Base Year | 2024 |
| End Year | 2028 |
| Series Year | 2024-2028 |
| Growth Momentum | Accelerate |
| YOY 2024 | 10.95% |
| CAGR | 12.6% |
| Incremental Value | $7552.4mn |
By Application
- On-premise VDI
- Cloud-based VDI
By End-user
- BFSI
- Education
- Healthcare
- Others
By Type
- Services
- New software licenses
By Geography
- North America
- Europe
- APAC
- South America
- Middle East and Africa
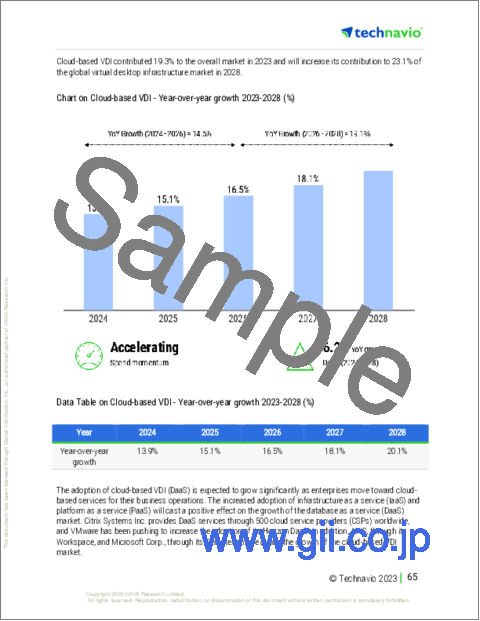
This study identifies the cloud-based vdi for smes as one of the prime reasons driving the virtual desktop infrastructure market growth during the next few years. Also, adoption of linux-based vdi and use of hyper-converged infrastructure for vdi will lead to sizable demand in the market.
Technavio presents a detailed picture of the market by the way of study, synthesis, and summation of data from multiple sources by an analysis of key parameters. Our report on the virtual desktop infrastructure market covers the following areas:
- Virtual desktop infrastructure market sizing
- Virtual desktop infrastructure market forecast
- Virtual desktop infrastructure market industry analysis
Technavio's robust vendor analysis is designed to help clients improve their market position, and in line with this, this report provides a detailed analysis of several leading virtual desktop infrastructure market vendors that include Amazon.com Inc., Centerm Information Co. Ltd., Cisco Systems Inc., Citrix Systems Inc., Dell Technologies Inc., dinCloud Inc., Fujitsu Ltd., Hewlett Packard Enterprise Co., HiveIO Inc., Huawei Technologies Co. Ltd., IGEL, Intel Corp., International Business Machines Corp., Microsoft Corp., Ncomputing Co. Ltd., Oracle Corp., Parallels International GmbH, Progress Software Corp., Red Hat Inc., and Stratodesk Corp.. Also, the virtual desktop infrastructure market analysis report includes information on upcoming trends and challenges that will influence market growth. This is to help companies strategize and leverage all forthcoming growth opportunities.
The study was conducted using an objective combination of primary and secondary information including inputs from key participants in the industry. The report contains a comprehensive market and vendor landscape in addition to an analysis of the key vendors.
Technavio presents a detailed picture of the market by the way of study, synthesis, and summation of data from multiple sources by an analysis of key parameters such as profit, pricing, competition, and promotions. It presents various market facets by identifying the key industry influencers. The data presented is comprehensive, reliable, and a result of extensive research - both primary and secondary. Technavio's market research reports provide a complete competitive landscape and an in-depth vendor selection methodology and analysis using qualitative and quantitative research to forecast accurate market growth.
Table of Contents
1 Executive Summary
- 1.1 Market overview
- Executive Summary - Chart on Market Overview
- Executive Summary - Data Table on Market Overview
- Executive Summary - Chart on Global Market Characteristics
- Executive Summary - Chart on Market by Geography
- Executive Summary - Chart on Market Segmentation by Application
- Executive Summary - Chart on Market Segmentation by End-user
- Executive Summary - Chart on Market Segmentation by Type
- Executive Summary - Chart on Incremental Growth
- Executive Summary - Data Table on Incremental Growth
- Executive Summary - Chart on Company Market Positioning
2 Market Landscape
- 2.1 Market ecosystem
- Parent Market
- Data Table on - Parent Market
- 2.2 Market characteristics
- Market characteristics analysis
- 2.3 Value chain analysis
- Value Chain Analysis
3 Market Sizing
- 3.1 Market definition
- Offerings of companies included in the market definition
- 3.2 Market segment analysis
- Market segments
- 3.3 Market size 2023
- 3.4 Market outlook: Forecast for 2023-2028
- Chart on Global - Market size and forecast 2023-2028 ($ million)
- Data Table on Global - Market size and forecast 2023-2028 ($ million)
- Chart on Global Market: Year-over-year growth 2023-2028 (%)
- Data Table on Global Market: Year-over-year growth 2023-2028 (%)
4 Historic Market Size
- 4.1 Global Virtual Desktop Infrastructure Market 2018 - 2022
- Historic Market Size - Data Table on Global Virtual Desktop Infrastructure Market 2018 - 2022 ($ million)
- 4.2 Application segment analysis 2018 - 2022
- Historic Market Size - Application Segment 2018 - 2022 ($ million)
- 4.3 End-user segment analysis 2018 - 2022
- Historic Market Size - End-user Segment 2018 - 2022 ($ million)
- 4.4 Type segment analysis 2018 - 2022
- Historic Market Size - Type Segment 2018 - 2022 ($ million)
- 4.5 Geography segment analysis 2018 - 2022
- Historic Market Size - Geography Segment 2018 - 2022 ($ million)
- 4.6 Country segment analysis 2018 - 2022
- Historic Market Size - Country Segment 2018 - 2022 ($ million)
5 Five Forces Analysis
- 5.1 Five forces summary
- Five forces analysis - Comparison between 2023 and 2028
- 5.2 Bargaining power of buyers
- Bargaining power of buyers - Impact of key factors 2023 and 2028
- 5.3 Bargaining power of suppliers
- Bargaining power of suppliers - Impact of key factors in 2023 and 2028
- 5.4 Threat of new entrants
- Threat of new entrants - Impact of key factors in 2023 and 2028
- 5.5 Threat of substitutes
- Threat of substitutes - Impact of key factors in 2023 and 2028
- 5.6 Threat of rivalry
- Threat of rivalry - Impact of key factors in 2023 and 2028
- 5.7 Market condition
- Chart on Market condition - Five forces 2023 and 2028
6 Market Segmentation by Application
- 6.1 Market segments
- Chart on Application - Market share 2023-2028 (%)
- Data Table on Application - Market share 2023-2028 (%)
- 6.2 Comparison by Application
- Chart on Comparison by Application
- Data Table on Comparison by Application
- 6.3 On-premise VDI - Market size and forecast 2023-2028
- Chart on On-premise VDI - Market size and forecast 2023-2028 ($ million)
- Data Table on On-premise VDI - Market size and forecast 2023-2028 ($ million)
- Chart on On-premise VDI - Year-over-year growth 2023-2028 (%)
- Data Table on On-premise VDI - Year-over-year growth 2023-2028 (%)
- 6.4 Cloud-based VDI - Market size and forecast 2023-2028
- Chart on Cloud-based VDI - Market size and forecast 2023-2028 ($ million)
- Data Table on Cloud-based VDI - Market size and forecast 2023-2028 ($ million)
- Chart on Cloud-based VDI - Year-over-year growth 2023-2028 (%)
- Data Table on Cloud-based VDI - Year-over-year growth 2023-2028 (%)
- 6.5 Market opportunity by Application
- Market opportunity by Application ($ million)
- Data Table on Market opportunity by Application ($ million)
7 Market Segmentation by End-user
- 7.1 Market segments
- Chart on End-user - Market share 2023-2028 (%)
- Data Table on End-user - Market share 2023-2028 (%)
- 7.2 Comparison by End-user
- Chart on Comparison by End-user
- Data Table on Comparison by End-user
- 7.3 BFSI - Market size and forecast 2023-2028
- Chart on BFSI - Market size and forecast 2023-2028 ($ million)
- Data Table on BFSI - Market size and forecast 2023-2028 ($ million)
- Chart on BFSI - Year-over-year growth 2023-2028 (%)
- Data Table on BFSI - Year-over-year growth 2023-2028 (%)
- 7.4 Education - Market size and forecast 2023-2028
- Chart on Education - Market size and forecast 2023-2028 ($ million)
- Data Table on Education - Market size and forecast 2023-2028 ($ million)
- Chart on Education - Year-over-year growth 2023-2028 (%)
- Data Table on Education - Year-over-year growth 2023-2028 (%)
- 7.5 Healthcare - Market size and forecast 2023-2028
- Chart on Healthcare - Market size and forecast 2023-2028 ($ million)
- Data Table on Healthcare - Market size and forecast 2023-2028 ($ million)
- Chart on Healthcare - Year-over-year growth 2023-2028 (%)
- Data Table on Healthcare - Year-over-year growth 2023-2028 (%)
- 7.6 Others - Market size and forecast 2023-2028
- Chart on Others - Market size and forecast 2023-2028 ($ million)
- Data Table on Others - Market size and forecast 2023-2028 ($ million)
- Chart on Others - Year-over-year growth 2023-2028 (%)
- Data Table on Others - Year-over-year growth 2023-2028 (%)
- 7.7 Market opportunity by End-user
- Market opportunity by End-user ($ million)
- Data Table on Market opportunity by End-user ($ million)
8 Market Segmentation by Type
- 8.1 Market segments
- Chart on Type - Market share 2023-2028 (%)
- Data Table on Type - Market share 2023-2028 (%)
- 8.2 Comparison by Type
- Chart on Comparison by Type
- Data Table on Comparison by Type
- 8.3 Services - Market size and forecast 2023-2028
- Chart on Services - Market size and forecast 2023-2028 ($ million)
- Data Table on Services - Market size and forecast 2023-2028 ($ million)
- Chart on Services - Year-over-year growth 2023-2028 (%)
- Data Table on Services - Year-over-year growth 2023-2028 (%)
- 8.4 New software licenses - Market size and forecast 2023-2028
- Chart on New software licenses - Market size and forecast 2023-2028 ($ million)
- Data Table on New software licenses - Market size and forecast 2023-2028 ($ million)
- Chart on New software licenses - Year-over-year growth 2023-2028 (%)
- Data Table on New software licenses - Year-over-year growth 2023-2028 (%)
- 8.5 Market opportunity by Type
- Market opportunity by Type ($ million)
- Data Table on Market opportunity by Type ($ million)
9 Customer Landscape
- 9.1 Customer landscape overview
- Analysis of price sensitivity, lifecycle, customer purchase basket, adoption rates, and purchase criteria
10 Geographic Landscape
- 10.1 Geographic segmentation
- Chart on Market share By Geographical Landscape2023-2028 (%)
- Data Table on Market share By Geographical Landscape2023-2028 (%)
- 10.2 Geographic comparison
- Chart on Geographic comparison
- Data Table on Geographic comparison
- 10.3 North America - Market size and forecast 2023-2028
- Chart on North America - Market size and forecast 2023-2028 ($ million)
- Data Table on North America - Market size and forecast 2023-2028 ($ million)
- Chart on North America - Year-over-year growth 2023-2028 (%)
- Data Table on North America - Year-over-year growth 2023-2028 (%)
- 10.4 Europe - Market size and forecast 2023-2028
- Chart on Europe - Market size and forecast 2023-2028 ($ million)
- Data Table on Europe - Market size and forecast 2023-2028 ($ million)
- Chart on Europe - Year-over-year growth 2023-2028 (%)
- Data Table on Europe - Year-over-year growth 2023-2028 (%)
- 10.5 APAC - Market size and forecast 2023-2028
- Chart on APAC - Market size and forecast 2023-2028 ($ million)
- Data Table on APAC - Market size and forecast 2023-2028 ($ million)
- Chart on APAC - Year-over-year growth 2023-2028 (%)
- Data Table on APAC - Year-over-year growth 2023-2028 (%)
- 10.6 South America - Market size and forecast 2023-2028
- Chart on South America - Market size and forecast 2023-2028 ($ million)
- Data Table on South America - Market size and forecast 2023-2028 ($ million)
- Chart on South America - Year-over-year growth 2023-2028 (%)
- Data Table on South America - Year-over-year growth 2023-2028 (%)
- 10.7 Middle East and Africa - Market size and forecast 2023-2028
- Chart on Middle East and Africa - Market size and forecast 2023-2028 ($ million)
- Data Table on Middle East and Africa - Market size and forecast 2023-2028 ($ million)
- Chart on Middle East and Africa - Year-over-year growth 2023-2028 (%)
- Data Table on Middle East and Africa - Year-over-year growth 2023-2028 (%)
- 10.8 US - Market size and forecast 2023-2028
- Chart on US - Market size and forecast 2023-2028 ($ million)
- Data Table on US - Market size and forecast 2023-2028 ($ million)
- Chart on US - Year-over-year growth 2023-2028 (%)
- Data Table on US - Year-over-year growth 2023-2028 (%)
- 10.9 Germany - Market size and forecast 2023-2028
- Chart on Germany - Market size and forecast 2023-2028 ($ million)
- Data Table on Germany - Market size and forecast 2023-2028 ($ million)
- Chart on Germany - Year-over-year growth 2023-2028 (%)
- Data Table on Germany - Year-over-year growth 2023-2028 (%)
- 10.10 UK - Market size and forecast 2023-2028
- Chart on UK - Market size and forecast 2023-2028 ($ million)
- Data Table on UK - Market size and forecast 2023-2028 ($ million)
- Chart on UK - Year-over-year growth 2023-2028 (%)
- Data Table on UK - Year-over-year growth 2023-2028 (%)
- 10.11 Canada - Market size and forecast 2023-2028
- Chart on Canada - Market size and forecast 2023-2028 ($ million)
- Data Table on Canada - Market size and forecast 2023-2028 ($ million)
- Chart on Canada - Year-over-year growth 2023-2028 (%)
- Data Table on Canada - Year-over-year growth 2023-2028 (%)
- 10.12 Australia - Market size and forecast 2023-2028
- Chart on Australia - Market size and forecast 2023-2028 ($ million)
- Data Table on Australia - Market size and forecast 2023-2028 ($ million)
- Chart on Australia - Year-over-year growth 2023-2028 (%)
- Data Table on Australia - Year-over-year growth 2023-2028 (%)
- 10.13 Market opportunity by geography
- Market opportunity By Geographical Landscape($ million)
- Data Tables on Market opportunity By Geographical Landscape($ million)
11 Drivers, Challenges, and Opportunity/Restraints
- 11.1 Market drivers
- 11.2 Market challenges
- 11.3 Impact of drivers and challenges
- Impact of drivers and challenges in 2023 and 2028
- 11.4 Market opportunities/restraints
12 Competitive Landscape
- 12.1 Overview
- 12.2 Competitive Landscape
- Overview on criticality of inputs and factors of differentiation
- 12.3 Landscape disruption
- Overview on factors of disruption
- 12.4 Industry risks
- Impact of key risks on business
13 Competitive Analysis
- 13.1 Companies profiled
- Companies covered
- 13.2 Market positioning of companies
- Matrix on companies position and classification
- 13.3 Amazon.com Inc.
- Amazon.com Inc. - Overview
- Amazon.com Inc. - Business segments
- Amazon.com Inc. - Key news
- Amazon.com Inc. - Key offerings
- Amazon.com Inc. - Segment focus
- 13.4 Centerm Information Co. Ltd.
- Centerm Information Co. Ltd. - Overview
- Centerm Information Co. Ltd. - Product / Service
- Centerm Information Co. Ltd. - Key offerings
- 13.5 Cisco Systems Inc.
- Cisco Systems Inc. - Overview
- Cisco Systems Inc. - Business segments
- Cisco Systems Inc. - Key news
- Cisco Systems Inc. - Key offerings
- Cisco Systems Inc. - Segment focus
- 13.6 Citrix Systems Inc.
- Citrix Systems Inc. - Overview
- Citrix Systems Inc. - Product / Service
- Citrix Systems Inc. - Key offerings
- 13.7 Dell Technologies Inc.
- Dell Technologies Inc. - Overview
- Dell Technologies Inc. - Business segments
- Dell Technologies Inc. - Key offerings
- Dell Technologies Inc. - Segment focus
- 13.8 dinCloud Inc.
- dinCloud Inc. - Overview
- dinCloud Inc. - Product / Service
- dinCloud Inc. - Key offerings
- 13.9 Fujitsu Ltd.
- Fujitsu Ltd. - Overview
- Fujitsu Ltd. - Business segments
- Fujitsu Ltd. - Key news
- Fujitsu Ltd. - Key offerings
- Fujitsu Ltd. - Segment focus
- 13.10 Hewlett Packard Enterprise Co.
- Hewlett Packard Enterprise Co. - Overview
- Hewlett Packard Enterprise Co. - Business segments
- Hewlett Packard Enterprise Co. - Key news
- Hewlett Packard Enterprise Co. - Key offerings
- Hewlett Packard Enterprise Co. - Segment focus
- 13.11 HiveIO Inc.
- HiveIO Inc. - Overview
- HiveIO Inc. - Product / Service
- HiveIO Inc. - Key offerings
- 13.12 Huawei Technologies Co. Ltd.
- Huawei Technologies Co. Ltd. - Overview
- Huawei Technologies Co. Ltd. - Product / Service
- Huawei Technologies Co. Ltd. - Key news
- Huawei Technologies Co. Ltd. - Key offerings
- 13.13 Intel Corp.
- Intel Corp. - Overview
- Intel Corp. - Business segments
- Intel Corp. - Key news
- Intel Corp. - Key offerings
- Intel Corp. - Segment focus
- 13.14 International Business Machines Corp.
- International Business Machines Corp. - Overview
- International Business Machines Corp. - Business segments
- International Business Machines Corp. - Key news
- International Business Machines Corp. - Key offerings
- International Business Machines Corp. - Segment focus
- 13.15 Microsoft Corp.
- Microsoft Corp. - Overview
- Microsoft Corp. - Business segments
- Microsoft Corp. - Key news
- Microsoft Corp. - Key offerings
- Microsoft Corp. - Segment focus
- 13.16 Oracle Corp.
- Oracle Corp. - Overview
- Oracle Corp. - Business segments
- Oracle Corp. - Key news
- Oracle Corp. - Key offerings
- Oracle Corp. - Segment focus
- 13.17 Red Hat Inc.
- Red Hat Inc. - Overview
- Red Hat Inc. - Product / Service
- Red Hat Inc. - Key offerings
14 Appendix
- 14.1 Scope of the report
- 14.2 Inclusions and exclusions checklist
- Inclusions checklist
- Exclusions checklist
- 14.3 Currency conversion rates for US$
- Currency conversion rates for US$
- 14.4 Research methodology
- Research methodology
- 14.5 Data procurement
- Information sources
- 14.6 Data validation
- Data validation
- 14.7 Validation techniques employed for market sizing
- Validation techniques employed for market sizing
- 14.8 Data synthesis
- Data synthesis
- 14.9 360 degree market analysis
- 360 degree market analysis
- 14.10 List of abbreviations
- List of abbreviations

