
|
市場調査レポート
商品コード
1666558
仮想デスクトップインフラの市場機会、成長促進要因、産業動向分析、2025年~2034年予測Virtual Desktop Infrastructure Market Opportunity, Growth Drivers, Industry Trend Analysis, and Forecast 2025 - 2034 |
||||||
カスタマイズ可能
|
|||||||
| 仮想デスクトップインフラの市場機会、成長促進要因、産業動向分析、2025年~2034年予測 |
|
出版日: 2024年12月13日
発行: Global Market Insights Inc.
ページ情報: 英文 175 Pages
納期: 2~3営業日
|

全表示
- 概要
- 目次
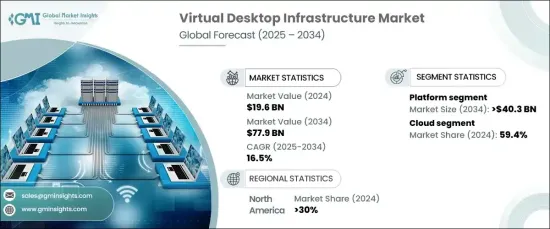
世界の仮想デスクトップインフラ市場は、2024年に196億米ドルとなり、2025年から2034年にかけてのCAGRは16.5%と堅調な成長が見込まれています。
この動向の主な要因は、柔軟なワークソリューションに対するニーズの高まりと、リモートワークの増加傾向にあります。仮想デスクトップソリューションは、インターネット接続さえあればどこからでもデスクトップ、アプリケーション、データにシームレスにアクセスできるため、現代の企業にとって不可欠なツールとなっています。進化するワークプレイスダイナミクスに対応するため、柔軟な運用が重視されるようになったことが、こうしたテクノロジーの採用にさらに拍車をかけています。
VDIの利点は否定できませんが、その導入にはいくつかの課題があります。仮想デスクトップシステムの構築には、インフラへの多大な投資と、既存のITフレームワークとの慎重な調整が必要です。さらに、シームレスなアプリケーションの互換性を確保し、仮想環境を維持するには、専門知識が必要になることが多く、ITリソースが限られている中小企業にとってはハードルが高いです。このような障壁があるにもかかわらず、ダイナミックな環境における業務効率と適応性を高めるという役割から、市場は拡大を続けています。
| 市場範囲 | |
|---|---|
| 開始年 | 2024年 |
| 予測年 | 2025年~2034年 |
| 開始金額 | 196億米ドル |
| 予測金額 | 779億米ドル |
| CAGR | 16.5% |
市場はハードウェア、プラットフォーム、サービスに分類されます。プラットフォーム分野は2024年に市場シェアの50%以上を占め、2034年には403億米ドルを超えると予測されています。この成長の背景には、仮想化環境の運用要件をサポートできる高性能ハードウェアに対する需要の高まりがあります。組織がデジタルファーストのアプローチに移行するにつれ、信頼性と拡張性の高いプラットフォームの必要性がますます高まっています。
VDIの導入モデルは、主にクラウドベースとオンプレミスに分けられます。クラウドベースのソリューションは、さまざまなワークロードに適応し、スケーラブルなリソースを提供できることから、2024年のシェアは59.4%で市場をリードしました。企業は、変動する需要に対応してリソースを調整できる柔軟性とコスト効率の高さから、クラウドモデルに引き寄せられつつあります。
北米は世界のVDI市場の主要プレーヤーとして台頭し、2024年には売上高の30%を占めるまでになりました。同地域の先進的な技術環境とリモートワーク戦略の普及が、仮想デスクトップソリューションの需要を大幅に押し上げました。安全でコラボレーティブなデジタルワークスペースが重視されるようになったことで、同地域ではVDIへの投資が引き続き活発化しています。
仮想デスクトップインフラ市場は、変化するワークプレイスニーズとテクノロジーの整合性の高まりを反映しています。導入や保守に一定の課題はあるものの、業界の拡大は、世界中の企業の進化する要件に対応する拡張性の高いプラットフォームやクラウドベースのソリューションへの投資の増加によって支えられています。
目次
第1章 調査手法と調査範囲
- 調査デザイン
- 調査アプローチ
- データ収集方法
- 基本推定と計算
- 基準年の算出
- 市場推計の主要動向
- 予測モデル
- 一次調査と検証
- 一次ソース
- データマイニングソース
- 市場範囲と定義
第2章 エグゼクティブサマリー
第3章 業界洞察
- 業界エコシステム分析
- サプライヤーの状況
- ソリューションプロバイダー
- テクノロジープロバイダー
- サービスプロバイダー
- 最終用途
- 利益率分析
- テクノロジー・イノベーション情勢
- 特許分析
- 規制状況
- 価格分析
- 影響要因
- 成長促進要因
- 職場の柔軟性の動向の高まり
- 仮想化ソリューションの採用拡大
- クラウドコンピューティングサービスの浸透
- 業界の潜在的リスク・課題
- 標準化の欠如
- 監視と管理の複雑さ
- 成長促進要因
- 成長可能性分析
- ポーター分析
- PESTEL分析
第4章 競合情勢
- イントロダクション
- 企業市場シェア分析
- 競合のポジショニングマトリックス
- 戦略展望マトリックス
第5章 市場推計・予測:コンポーネント別、2021年~2034年
- 主要動向
- ハードウェア
- クライアント
- サーバー
- ソフトウェア/プラットフォーム
- サービス
- 導入サービス
- 保守サービス
- コンサルティングサービス
第6章 市場推計・予測:タイプ別、2021年~2034年
- 主要動向
- 永続的VDI
- 非永続的VDI
第7章 市場推計・予測:展開モデル別、2021年~2034年
- 主要動向
- オンプレミス
- クラウド
第8章 市場推計・予測:企業規模別、2021年~2034年
- 主要動向
- 中小企業
- 大企業
第9章 市場推計・予測:用途別、2021年~2034年
- 主要動向
- BFSI
- 永続的VDI
- 非永続的VDI
- IT・通信
- 永続的VDI
- 非永続的VDI
- 航空宇宙・防衛
- 永続的VDI
- 非永続的VDI
- 政府機関
- 永続的VDI
- 非永続的VDI
- 製造業
- 永続的VDI
- 非永続的VDI
- 教育
- 永続的VDI
- 非永続的VDI
- 小売
- 永続的VDI
- 非永続的VDI
- 運輸
- 永続的VDI
- 非永続的VDI
- ヘルスケア
- 永続的VDI
- 非永続的VDI
- その他
第10章 市場推計・予測:地域別、2021年~2034年
- 主要動向
- 北米
- 米国
- カナダ
- 欧州
- 英国
- ドイツ
- フランス
- イタリア
- スペイン
- ロシア
- 北欧
- アジア太平洋
- 中国
- インド
- 日本
- オーストラリア
- 韓国
- 東南アジア
- ラテンアメリカ
- ブラジル
- メキシコ
- アルゼンチン
- 中東・アフリカ
- UAE
- 南アフリカ
- サウジアラビア
第11章 企業プロファイル
- Ace cloud hosting
- AWS
- Cisco
- Citrix
- Ericom Software
- Flexxible IT
- Hewlett Packard Enterprise(HPE)
- Huawei
- IBM
- Intel
- Inuvika
- Microsoft
- Nutanix
- Oracle
- Parallels
- Red Hat
- Scale Computing
- V2Cloud
- Vmware
The Global Virtual Desktop Infrastructure Market was valued at USD 19.6 billion in 2024 and is expected to experience robust growth with a CAGR of 16.5% from 2025 to 2034. This surge is primarily driven by the increasing need for flexible work solutions and the rising trend of remote work. Virtual desktop solutions enable seamless access to desktops, applications, and data from any location with internet connectivity, making them an essential tool for modern businesses. The growing emphasis on flexible operations in response to evolving workplace dynamics has further fueled the adoption of these technologies.
While the benefits of VDI are undeniable, its implementation poses several challenges. Setting up virtual desktop systems requires considerable investments in infrastructure and careful alignment with existing IT frameworks. Additionally, ensuring seamless application compatibility and maintaining the virtual environment often demands expertise, creating hurdles for smaller businesses with limited IT resources. Despite these barriers, the market continues to expand due to its role in enhancing operational efficiency and adaptability in dynamic environments.
| Market Scope | |
|---|---|
| Start Year | 2024 |
| Forecast Year | 2025-2034 |
| Start Value | $19.6 Billion |
| Forecast Value | $77.9 Billion |
| CAGR | 16.5% |
The market is categorized into hardware, platforms, and services. The platform segment dominated in 2024, accounting for more than 50% of the market share, and is projected to surpass USD 40.3 billion by 2034. This growth is attributed to the rising demand for high-performance hardware capable of supporting the operational requirements of virtualized environments. The need for reliable and scalable platforms is becoming increasingly critical as organizations shift toward digital-first approaches.
VDI deployment models are primarily divided into cloud-based and on-premise options. Cloud-based solutions led the market with a 59.4% share in 2024, driven by their ability to adapt to varying workloads and provide scalable resources. Organizations are gravitating toward cloud models for their flexibility and cost-efficiency, allowing businesses to adjust their resources in response to fluctuating demands.
North America emerged as a key player in the global VDI market, contributing 30% of the revenue in 2024. The region's advanced technological landscape and widespread adoption of remote work strategies have significantly bolstered the demand for virtual desktop solutions. The emphasis on secure and collaborative digital workspaces continues to drive investments in VDI across the region.
The virtual desktop infrastructure market reflects the growing alignment of technology with changing workplace needs. Despite certain challenges in deployment and maintenance, the industry's expansion is supported by increasing investments in scalable platforms and cloud-based solutions, which address the evolving requirements of businesses worldwide.
Table of Contents
Chapter 1 Methodology & Scope
- 1.1 Research design
- 1.1.1 Research approach
- 1.1.2 Data collection methods
- 1.2 Base estimates & calculations
- 1.2.1 Base year calculation
- 1.2.2 Key trends for market estimation
- 1.3 Forecast model
- 1.4 Primary research and validation
- 1.4.1 Primary sources
- 1.4.2 Data mining sources
- 1.5 Market scope & definition
Chapter 2 Executive Summary
- 2.1 Industry 3600 synopsis, 2021 - 2034
Chapter 3 Industry Insights
- 3.1 Industry ecosystem analysis
- 3.2 Supplier landscape
- 3.2.1 Solution provider
- 3.2.2 Technology providers
- 3.2.3 Service providers
- 3.2.4 End Use
- 3.3 Profit margin analysis
- 3.4 Technology & innovation landscape
- 3.5 Patent analysis
- 3.6 Regulatory landscape
- 3.7 Pricing analysis
- 3.8 Impact forces
- 3.8.1 Growth drivers
- 3.8.1.1 Rising trend of workplace flexibility
- 3.8.1.2 Growing adoption of virtualization solutions
- 3.8.1.3 Rising penetration of cloud computing services
- 3.8.2 Industry pitfalls & challenges
- 3.8.2.1 Lack of standardization
- 3.8.2.2 Complexities in monitoring and management
- 3.8.1 Growth drivers
- 3.9 Growth potential analysis
- 3.10 Porter’s analysis
- 3.11 PESTEL analysis
Chapter 4 Competitive Landscape, 2024
- 4.1 Introduction
- 4.2 Company market share analysis
- 4.3 Competitive positioning matrix
- 4.4 Strategic outlook matrix
Chapter 5 Market Estimates & Forecast, By Component, 2021 - 2034 ($Bn)
- 5.1 Key trends
- 5.2 Hardware
- 5.2.1 Client
- 5.2.2 Server
- 5.3 Software/Platform
- 5.4 Services
- 5.4.1 Implementation service
- 5.4.2 Maintenance & support service
- 5.4.3 Consulting service
Chapter 6 Market Estimates & Forecast, By Type, 2021 - 2034 ($Bn)
- 6.1 Key trends
- 6.2 Persistent VDI
- 6.3 Non- persistent VDI
Chapter 7 Market Estimates & Forecast, By Deployment Model, 2021 - 2034 ($Bn)
- 7.1 Key trends
- 7.2 On-premise
- 7.3 Cloud
Chapter 8 Market Estimates & Forecast, By Enterprise Size, 2021 - 2034 ($Bn)
- 8.1 Key trends
- 8.2 SME
- 8.3 Large enterprises
Chapter 9 Market Estimates & Forecast, By Application, 2021 - 2034 ($Bn)
- 9.1 Key trends
- 9.2 BFSI
- 9.2.1 Persistent VDI
- 9.2.2 Non- persistent VDI
- 9.3 IT & telecom
- 9.3.1 Persistent VDI
- 9.3.2 Non- persistent VDI
- 9.4 Aerospace & defense
- 9.4.1 Persistent VDI
- 9.4.2 Non- persistent VDI
- 9.5 Government
- 9.5.1 Persistent VDI
- 9.5.2 Non- persistent VDI
- 9.6 Manufacturing
- 9.6.1 Persistent VDI
- 9.6.2 Non- persistent VDI
- 9.7 Education
- 9.7.1 Persistent VDI
- 9.7.2 Non- persistent VDI
- 9.8 Retail
- 9.8.1 Persistent VDI
- 9.8.2 Non- persistent VDI
- 9.9 Transportation
- 9.9.1 Persistent VDI
- 9.9.2 Non- persistent VDI
- 9.10 Healthcare
- 9.10.1 Persistent VDI
- 9.10.2 Non- persistent VDI
- 9.11 Others
Chapter 10 Market Estimates & Forecast, By Region, 2021 - 2034 ($Bn)
- 10.1 Key trends
- 10.2 North America
- 10.2.1 U.S.
- 10.2.2 Canada
- 10.3 Europe
- 10.3.1 UK
- 10.3.2 Germany
- 10.3.3 France
- 10.3.4 Italy
- 10.3.5 Spain
- 10.3.6 Russia
- 10.3.7 Nordics
- 10.4 Asia Pacific
- 10.4.1 China
- 10.4.2 India
- 10.4.3 Japan
- 10.4.4 Australia
- 10.4.5 South Korea
- 10.4.6 Southeast Asia
- 10.5 Latin America
- 10.5.1 Brazil
- 10.5.2 Mexico
- 10.5.3 Argentina
- 10.6 MEA
- 10.6.1 UAE
- 10.6.2 South Africa
- 10.6.3 Saudi Arabia
Chapter 11 Company Profiles
- 11.1 Ace cloud hosting
- 11.2 AWS
- 11.3 Cisco
- 11.4 Citrix
- 11.5 Ericom Software
- 11.6 Flexxible IT
- 11.7 Google
- 11.8 Hewlett Packard Enterprise (HPE)
- 11.9 Huawei
- 11.10 IBM
- 11.11 Intel
- 11.12 Inuvika
- 11.13 Microsoft
- 11.14 Nutanix
- 11.15 Oracle
- 11.16 Parallels
- 11.17 Red Hat
- 11.18 Scale Computing
- 11.19 V2Cloud
- 11.20 Vmware
