|
|
市場調査レポート
商品コード
1645519
飲料缶の世界市場 2025~2029年Global Beverage can Market 2025-2029 |
||||||

|
|||||||
カスタマイズ可能
|
|||||||

| 飲料缶の世界市場 2025~2029年 |
|
出版日: 2025年01月22日
発行: TechNavio
ページ情報: 英文 196 Pages
納期: 即納可能
|

全表示
- 概要
- 図表
- 目次
飲料缶市場は2024~2029年に59億1,560万米ドル、予測期間中のCAGRは3%で成長すると予測されます。
当レポートでは、飲料缶市場の全体的な分析、市場規模・予測、動向、成長促進要因、課題、約25のベンダーを網羅したベンダー分析などを掲載しています。
現在の市場シナリオ、最新動向と促進要因、市場環境全体に関する最新分析を提供しています。市場は、金属缶のニーズの増加、エネルギー飲料やジュース飲料産業の成長、持続可能性に関する消費者の意識の高まりによって牽引されています。
| 市場範囲 | |
|---|---|
| 基準年 | 2025年 |
| 終了年 | 2029年 |
| 予測期間 | 2025~2029年 |
| 成長モメンタム | 加速 |
| 前年比[2025年] | 2.8% |
| CAGR | 3% |
| 増分額 | 59億1,560万米ドル |
本調査では、今後数年間の飲料缶市場の成長を牽引する主要要因の1つとして、RTDコーヒー・紅茶市場の成長を挙げています。また、板紙缶の人気上昇と軽量缶への注目の高まりは、市場の大きな需要につながります。
目次
第1章 エグゼクティブサマリー
- 市場概要
第2章 Technavio分析
- 価格・ライフサイクル・顧客購入バスケット・採用率・購入基準の分析
- インプットの重要性と差別化の要因
- 混乱の要因
- 促進要因と課題の影響
第3章 市場情勢
- 市場エコシステム
- 市場の特徴
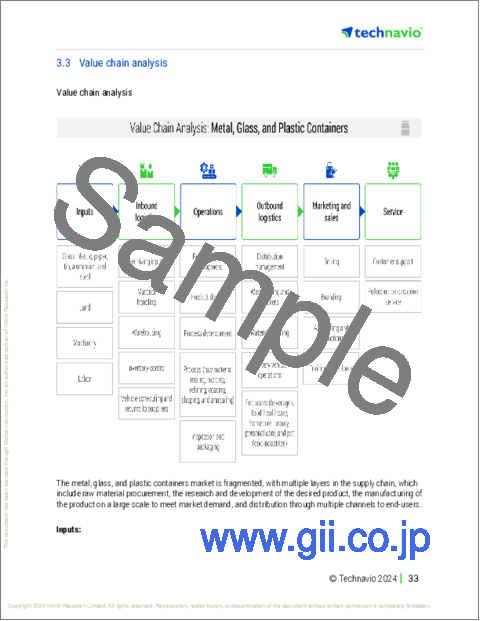
- バリューチェーン分析
第4章 市場規模
- 市場の定義
- 市場セグメント分析
- 市場規模 2024年
- 市場の展望 2024~2029年
第5章 市場規模実績
- 飲料缶の世界市場 2019~2023年
- 用途別セグメント分析 2019~2023年
- 材料別セグメント分析 2019~2023年
- 地域別セグメント分析 2019~2023年
- 国別セグメント分析 2019~2023年
第6章 定性分析
- AIの影響:飲料缶の世界市場
第7章 ファイブフォース分析
- ファイブフォースの要約
- 買い手の交渉力
- 供給企業の交渉力
- 新規参入業者の脅威
- 代替品の脅威
- 競争の脅威
- 市況
第8章 市場セグメンテーション:用途別
- 市場セグメント
- 比較:用途別
- ノンアルコール飲料:市場規模と予測 2024~2029年
- アルコール飲料:市場規模と予測 2024~2029年
- 市場機会:用途別
第9章 市場セグメンテーション:材料別
- 市場セグメント
- 比較:材料別
- アルミニウム:市場規模と予測 2024~2029年
- 鋼鉄:市場規模と予測 2024~2029年
- 市場機会:材料別
第10章 顧客情勢
- 顧客情勢概要
第11章 地域別情勢
- 地域別セグメンテーション
- 比較:地域別
- アジア太平洋:市場規模と予測 2024~2029年
- 北米:市場規模と予測 2024~2029年
- 欧州:市場規模と予測 2024~2029年
- 中東・アフリカ:市場規模と予測 2024~2029年
- 南米:市場規模と予測 2024~2029年
- 米国:市場規模と予測 2024~2029年
- 中国:市場規模と予測 2024~2029年
- カナダ:市場規模と予測 2024~2029年
- ドイツ:市場規模と予測 2024~2029年
- インド:市場規模と予測 2024~2029年
- 日本:市場規模と予測 2024~2029年
- ブラジル:市場規模と予測 2024~2029年
- 英国:市場規模と予測 2024~2029年
- フランス:市場規模と予測 2024~2029年
- アラブ首長国連邦:市場規模と予測 2024~2029年
- 地域情勢による市場機会
第12章 促進要因・課題・機会・抑制要因
- 市場促進要因
- 市場課題
- 促進要因と課題の影響
- 市場機会・抑制要因
第13章 競合情勢
- 概要
- 競合情勢
- 混乱の状況
- 産業のリスク
第14章 競合分析
- 企業プロファイル
- 企業ランキング指数
- 企業の市場ポジショニング
- Amcor Plc
- Ardagh Group SA
- Ball Corp.
- CANPACK SA
- CPMC Holdings Ltd.
- Crown Holdings Inc.
- Envases Ohringen GmbH
- GZ Industries Ltd.
- Mitsubishi Materials Corp.
- Nampak Ltd.
- ORG Technology Co. Ltd.
- Orora Ltd.
- Shengxing Group
- Silgan Holdings Inc.
- Trivium Packaging BV
第15章 付録
Exhibits:
- Exhibits1: Executive Summary - Chart on Market Overview
- Exhibits2: Executive Summary - Data Table on Market Overview
- Exhibits3: Executive Summary - Chart on Global Market Characteristics
- Exhibits4: Executive Summary - Chart on Market By Geographical Landscape
- Exhibits5: Executive Summary - Chart on Market Segmentation by Application
- Exhibits6: Executive Summary - Chart on Market Segmentation by Material
- Exhibits7: Executive Summary - Chart on Incremental Growth
- Exhibits8: Executive Summary - Data Table on Incremental Growth
- Exhibits9: Executive Summary - Chart on Company Market Positioning
- Exhibits10: Analysis of price sensitivity, lifecycle, customer purchase basket, adoption rates, and purchase criteria
- Exhibits11: Overview on criticality of inputs and factors of differentiation
- Exhibits12: Overview on factors of disruption
- Exhibits13: Impact of drivers and challenges in 2024 and 2029
- Exhibits14: Parent Market
- Exhibits15: Data Table on - Parent Market
- Exhibits16: Market characteristics analysis
- Exhibits17: Value chain analysis
- Exhibits18: Offerings of companies included in the market definition
- Exhibits19: Market segments
- Exhibits20: Chart on Global - Market size and forecast 2024-2029 ($ million)
- Exhibits21: Data Table on Global - Market size and forecast 2024-2029 ($ million)
- Exhibits22: Chart on Global Market: Year-over-year growth 2024-2029 (%)
- Exhibits23: Data Table on Global Market: Year-over-year growth 2024-2029 (%)
- Exhibits24: Historic Market Size - Data Table on Global Beverage Can Market 2019 - 2023 ($ million)
- Exhibits25: Historic Market Size - Application Segment 2019 - 2023 ($ million)
- Exhibits26: Historic Market Size - Material Segment 2019 - 2023 ($ million)
- Exhibits27: Historic Market Size - Geography Segment 2019 - 2023 ($ million)
- Exhibits28: Historic Market Size - Country Segment 2019 - 2023 ($ million)
- Exhibits29: Five forces analysis - Comparison between 2024 and 2029
- Exhibits30: Bargaining power of buyers - Impact of key factors 2024 and 2029
- Exhibits31: Bargaining power of suppliers - Impact of key factors in 2024 and 2029
- Exhibits32: Threat of new entrants - Impact of key factors in 2024 and 2029
- Exhibits33: Threat of substitutes - Impact of key factors in 2024 and 2029
- Exhibits34: Threat of rivalry - Impact of key factors in 2024 and 2029
- Exhibits35: Chart on Market condition - Five forces 2024 and 2029
- Exhibits36: Chart on Application - Market share 2024-2029 (%)
- Exhibits37: Data Table on Application - Market share 2024-2029 (%)
- Exhibits38: Chart on Comparison by Application
- Exhibits39: Data Table on Comparison by Application
- Exhibits40: Chart on Non alcoholic beverages - Market size and forecast 2024-2029 ($ million)
- Exhibits41: Data Table on Non alcoholic beverages - Market size and forecast 2024-2029 ($ million)
- Exhibits42: Chart on Non alcoholic beverages - Year-over-year growth 2024-2029 (%)
- Exhibits43: Data Table on Non alcoholic beverages - Year-over-year growth 2024-2029 (%)
- Exhibits44: Chart on Alcoholic beverages - Market size and forecast 2024-2029 ($ million)
- Exhibits45: Data Table on Alcoholic beverages - Market size and forecast 2024-2029 ($ million)
- Exhibits46: Chart on Alcoholic beverages - Year-over-year growth 2024-2029 (%)
- Exhibits47: Data Table on Alcoholic beverages - Year-over-year growth 2024-2029 (%)
- Exhibits48: Market opportunity by Application ($ million)
- Exhibits49: Data Table on Market opportunity by Application ($ million)
- Exhibits50: Chart on Material - Market share 2024-2029 (%)
- Exhibits51: Data Table on Material - Market share 2024-2029 (%)
- Exhibits52: Chart on Comparison by Material
- Exhibits53: Data Table on Comparison by Material
- Exhibits54: Chart on Aluminum - Market size and forecast 2024-2029 ($ million)
- Exhibits55: Data Table on Aluminum - Market size and forecast 2024-2029 ($ million)
- Exhibits56: Chart on Aluminum - Year-over-year growth 2024-2029 (%)
- Exhibits57: Data Table on Aluminum - Year-over-year growth 2024-2029 (%)
- Exhibits58: Chart on Steel - Market size and forecast 2024-2029 ($ million)
- Exhibits59: Data Table on Steel - Market size and forecast 2024-2029 ($ million)
- Exhibits60: Chart on Steel - Year-over-year growth 2024-2029 (%)
- Exhibits61: Data Table on Steel - Year-over-year growth 2024-2029 (%)
- Exhibits62: Market opportunity by Material ($ million)
- Exhibits63: Data Table on Market opportunity by Material ($ million)
- Exhibits64: Analysis of price sensitivity, lifecycle, customer purchase basket, adoption rates, and purchase criteria
- Exhibits65: Chart on Market share By Geographical Landscape 2024-2029 (%)
- Exhibits66: Data Table on Market share By Geographical Landscape 2024-2029 (%)
- Exhibits67: Chart on Geographic comparison
- Exhibits68: Data Table on Geographic comparison
- Exhibits69: Chart on APAC - Market size and forecast 2024-2029 ($ million)
- Exhibits70: Data Table on APAC - Market size and forecast 2024-2029 ($ million)
- Exhibits71: Chart on APAC - Year-over-year growth 2024-2029 (%)
- Exhibits72: Data Table on APAC - Year-over-year growth 2024-2029 (%)
- Exhibits73: Chart on North America - Market size and forecast 2024-2029 ($ million)
- Exhibits74: Data Table on North America - Market size and forecast 2024-2029 ($ million)
- Exhibits75: Chart on North America - Year-over-year growth 2024-2029 (%)
- Exhibits76: Data Table on North America - Year-over-year growth 2024-2029 (%)
- Exhibits77: Chart on Europe - Market size and forecast 2024-2029 ($ million)
- Exhibits78: Data Table on Europe - Market size and forecast 2024-2029 ($ million)
- Exhibits79: Chart on Europe - Year-over-year growth 2024-2029 (%)
- Exhibits80: Data Table on Europe - Year-over-year growth 2024-2029 (%)
- Exhibits81: Chart on Middle East and Africa - Market size and forecast 2024-2029 ($ million)
- Exhibits82: Data Table on Middle East and Africa - Market size and forecast 2024-2029 ($ million)
- Exhibits83: Chart on Middle East and Africa - Year-over-year growth 2024-2029 (%)
- Exhibits84: Data Table on Middle East and Africa - Year-over-year growth 2024-2029 (%)
- Exhibits85: Chart on South America - Market size and forecast 2024-2029 ($ million)
- Exhibits86: Data Table on South America - Market size and forecast 2024-2029 ($ million)
- Exhibits87: Chart on South America - Year-over-year growth 2024-2029 (%)
- Exhibits88: Data Table on South America - Year-over-year growth 2024-2029 (%)
- Exhibits89: Chart on US - Market size and forecast 2024-2029 ($ million)
- Exhibits90: Data Table on US - Market size and forecast 2024-2029 ($ million)
- Exhibits91: Chart on US - Year-over-year growth 2024-2029 (%)
- Exhibits92: Data Table on US - Year-over-year growth 2024-2029 (%)
- Exhibits93: Chart on China - Market size and forecast 2024-2029 ($ million)
- Exhibits94: Data Table on China - Market size and forecast 2024-2029 ($ million)
- Exhibits95: Chart on China - Year-over-year growth 2024-2029 (%)
- Exhibits96: Data Table on China - Year-over-year growth 2024-2029 (%)
- Exhibits97: Chart on Canada - Market size and forecast 2024-2029 ($ million)
- Exhibits98: Data Table on Canada - Market size and forecast 2024-2029 ($ million)
- Exhibits99: Chart on Canada - Year-over-year growth 2024-2029 (%)
- Exhibits100: Data Table on Canada - Year-over-year growth 2024-2029 (%)
- Exhibits101: Chart on Germany - Market size and forecast 2024-2029 ($ million)
- Exhibits102: Data Table on Germany - Market size and forecast 2024-2029 ($ million)
- Exhibits103: Chart on Germany - Year-over-year growth 2024-2029 (%)
- Exhibits104: Data Table on Germany - Year-over-year growth 2024-2029 (%)
- Exhibits105: Chart on India - Market size and forecast 2024-2029 ($ million)
- Exhibits106: Data Table on India - Market size and forecast 2024-2029 ($ million)
- Exhibits107: Chart on India - Year-over-year growth 2024-2029 (%)
- Exhibits108: Data Table on India - Year-over-year growth 2024-2029 (%)
- Exhibits109: Chart on Japan - Market size and forecast 2024-2029 ($ million)
- Exhibits110: Data Table on Japan - Market size and forecast 2024-2029 ($ million)
- Exhibits111: Chart on Japan - Year-over-year growth 2024-2029 (%)
- Exhibits112: Data Table on Japan - Year-over-year growth 2024-2029 (%)
- Exhibits113: Chart on Brazil - Market size and forecast 2024-2029 ($ million)
- Exhibits114: Data Table on Brazil - Market size and forecast 2024-2029 ($ million)
- Exhibits115: Chart on Brazil - Year-over-year growth 2024-2029 (%)
- Exhibits116: Data Table on Brazil - Year-over-year growth 2024-2029 (%)
- Exhibits117: Chart on UK - Market size and forecast 2024-2029 ($ million)
- Exhibits118: Data Table on UK - Market size and forecast 2024-2029 ($ million)
- Exhibits119: Chart on UK - Year-over-year growth 2024-2029 (%)
- Exhibits120: Data Table on UK - Year-over-year growth 2024-2029 (%)
- Exhibits121: Chart on France - Market size and forecast 2024-2029 ($ million)
- Exhibits122: Data Table on France - Market size and forecast 2024-2029 ($ million)
- Exhibits123: Chart on France - Year-over-year growth 2024-2029 (%)
- Exhibits124: Data Table on France - Year-over-year growth 2024-2029 (%)
- Exhibits125: Chart on UAE - Market size and forecast 2024-2029 ($ million)
- Exhibits126: Data Table on UAE - Market size and forecast 2024-2029 ($ million)
- Exhibits127: Chart on UAE - Year-over-year growth 2024-2029 (%)
- Exhibits128: Data Table on UAE - Year-over-year growth 2024-2029 (%)
- Exhibits129: Market opportunity By Geographical Landscape ($ million)
- Exhibits130: Data Tables on Market opportunity By Geographical Landscape ($ million)
- Exhibits131: Impact of drivers and challenges in 2024 and 2029
- Exhibits132: Overview on criticality of inputs and factors of differentiation
- Exhibits133: Overview on factors of disruption
- Exhibits134: Impact of key risks on business
- Exhibits135: Companies covered
- Exhibits136: Company ranking index
- Exhibits137: Matrix on companies position and classification
- Exhibits138: Amcor Plc - Overview
- Exhibits139: Amcor Plc - Business segments
- Exhibits140: Amcor Plc - Key news
- Exhibits141: Amcor Plc - Key offerings
- Exhibits142: Amcor Plc - Segment focus
- Exhibits143: SWOT
- Exhibits144: Ardagh Group SA - Overview
- Exhibits145: Ardagh Group SA - Business segments
- Exhibits146: Ardagh Group SA - Key news
- Exhibits147: Ardagh Group SA - Key offerings
- Exhibits148: Ardagh Group SA - Segment focus
- Exhibits149: SWOT
- Exhibits150: Ball Corp. - Overview
- Exhibits151: Ball Corp. - Business segments
- Exhibits152: Ball Corp. - Key offerings
- Exhibits153: Ball Corp. - Segment focus
- Exhibits154: SWOT
- Exhibits155: CANPACK SA - Overview
- Exhibits156: CANPACK SA - Product / Service
- Exhibits157: CANPACK SA - Key offerings
- Exhibits158: SWOT
- Exhibits159: CPMC Holdings Ltd. - Overview
- Exhibits160: CPMC Holdings Ltd. - Product / Service
- Exhibits161: CPMC Holdings Ltd. - Key offerings
- Exhibits162: SWOT
- Exhibits163: Crown Holdings Inc. - Overview
- Exhibits164: Crown Holdings Inc. - Business segments
- Exhibits165: Crown Holdings Inc. - Key offerings
- Exhibits166: Crown Holdings Inc. - Segment focus
- Exhibits167: SWOT
- Exhibits168: Envases Ohringen GmbH - Overview
- Exhibits169: Envases Ohringen GmbH - Product / Service
- Exhibits170: Envases Ohringen GmbH - Key offerings
- Exhibits171: SWOT
- Exhibits172: GZ Industries Ltd. - Overview
- Exhibits173: GZ Industries Ltd. - Product / Service
- Exhibits174: GZ Industries Ltd. - Key offerings
- Exhibits175: SWOT
- Exhibits176: Mitsubishi Materials Corp. - Overview
- Exhibits177: Mitsubishi Materials Corp. - Business segments
- Exhibits178: Mitsubishi Materials Corp. - Key news
- Exhibits179: Mitsubishi Materials Corp. - Key offerings
- Exhibits180: Mitsubishi Materials Corp. - Segment focus
- Exhibits181: SWOT
- Exhibits182: Nampak Ltd. - Overview
- Exhibits183: Nampak Ltd. - Business segments
- Exhibits184: Nampak Ltd. - Key offerings
- Exhibits185: Nampak Ltd. - Segment focus
- Exhibits186: SWOT
- Exhibits187: ORG Technology Co. Ltd. - Overview
- Exhibits188: ORG Technology Co. Ltd. - Product / Service
- Exhibits189: ORG Technology Co. Ltd. - Key offerings
- Exhibits190: SWOT
- Exhibits191: Orora Ltd. - Overview
- Exhibits192: Orora Ltd. - Business segments
- Exhibits193: Orora Ltd. - Key offerings
- Exhibits194: Orora Ltd. - Segment focus
- Exhibits195: SWOT
- Exhibits196: Shengxing Group - Overview
- Exhibits197: Shengxing Group - Product / Service
- Exhibits198: Shengxing Group - Key offerings
- Exhibits199: SWOT
- Exhibits200: Silgan Holdings Inc. - Overview
- Exhibits201: Silgan Holdings Inc. - Business segments
- Exhibits202: Silgan Holdings Inc. - Key offerings
- Exhibits203: Silgan Holdings Inc. - Segment focus
- Exhibits204: SWOT
- Exhibits205: Trivium Packaging BV - Overview
- Exhibits206: Trivium Packaging BV - Business segments
- Exhibits207: Trivium Packaging BV - Key offerings
- Exhibits208: Trivium Packaging BV - Segment focus
- Exhibits209: SWOT
- Exhibits210: Inclusions checklist
- Exhibits211: Exclusions checklist
- Exhibits212: Currency conversion rates for US$
- Exhibits213: Research methodology
- Exhibits214: Information sources
- Exhibits215: Data validation
- Exhibits216: Validation techniques employed for market sizing
- Exhibits217: Data synthesis
- Exhibits218: 360 degree market analysis
- Exhibits219: List of abbreviations
The beverage can market is forecasted to grow by USD 5915.6 mn during 2024-2029, accelerating at a CAGR of 3% during the forecast period. The report on the beverage can market provides a holistic analysis, market size and forecast, trends, growth drivers, and challenges, as well as vendor analysis covering around 25 vendors.
The report offers an up-to-date analysis regarding the current market scenario, the latest trends and drivers, and the overall market environment. The market is driven by increased need for metal cans, growing energy and juice drinks industry, and growing awareness among consumers regarding sustainability.
| Market Scope | |
|---|---|
| Base Year | 2025 |
| End Year | 2029 |
| Series Year | 2025-2029 |
| Growth Momentum | Accelerate |
| YOY 2025 | 2.8% |
| CAGR | 3% |
| Incremental Value | $5915.6 mn |
Technavio's beverage can market is segmented as below:
By Application
- Non alcoholic beverages
- Alcoholic beverages
By Material
- Aluminum
- Steel
By Geographical Landscape
- APAC
- North America
- Europe
- Middle East and Africa
- South America
This study identifies the growing market of rtd coffee and tea as one of the prime reasons driving the beverage can market growth during the next few years. Also, rising popularity of paperboard cans and increased focus on light-weighting cans will lead to sizable demand in the market.
The report on the beverage can market covers the following areas:
- Beverage Can Market sizing
- Beverage Can Market forecast
- Beverage Can Market industry analysis
The robust vendor analysis is designed to help clients improve their market position, and in line with this, this report provides a detailed analysis of several leading beverage can market vendors that include Amcor Plc, Ardagh Group SA, Ball Corp., Bangkok Can Manufacturing Co. Ltd., Can One Berhad, CANPACK SA, CPMC Holdings Ltd., Crown Holdings Inc., Envases Ohringen GmbH, GZ Industries Ltd., Kian Joo Can Factory Bhd, Mahmood Saeed Co. Ltd., Mitsubishi Materials Corp., Nampak Ltd., ORG Technology Co. Ltd., Orora Ltd., Shengxing Group, Silgan Holdings Inc., Toyo Seikan Group Holdings Ltd., and Trivium Packaging BV. Also, the beverage can market analysis report includes information on upcoming trends and challenges that will influence market growth. This is to help companies strategize and leverage all forthcoming growth opportunities.
The study was conducted using an objective combination of primary and secondary information including inputs from key participants in the industry. The report contains a comprehensive market and vendor landscape in addition to an analysis of the key vendors.
The publisher presents a detailed picture of the market by the way of study, synthesis, and summation of data from multiple sources by an analysis of key parameters such as profit, pricing, competition, and promotions. It presents various market facets by identifying the key industry influencers. The data presented is comprehensive, reliable, and a result of extensive primary and secondary research. The market research reports provide a complete competitive landscape and an in-depth vendor selection methodology and analysis using qualitative and quantitative research to forecast accurate market growth.
Table of Contents
1 Executive Summary
- 1.1 Market overview
- Executive Summary - Chart on Market Overview
- Executive Summary - Data Table on Market Overview
- Executive Summary - Chart on Global Market Characteristics
- Executive Summary - Chart on Market By Geographical Landscape
- Executive Summary - Chart on Market Segmentation by Application
- Executive Summary - Chart on Market Segmentation by Material
- Executive Summary - Chart on Incremental Growth
- Executive Summary - Data Table on Incremental Growth
- Executive Summary - Chart on Company Market Positioning
2 Technavio Analysis
- 2.1 Analysis of price sensitivity, lifecycle, customer purchase basket, adoption rates, and purchase criteria
- Analysis of price sensitivity, lifecycle, customer purchase basket, adoption rates, and purchase criteria
- 2.2 Criticality of inputs and Factors of differentiation
- Overview on criticality of inputs and factors of differentiation
- 2.3 Factors of disruption
- Overview on factors of disruption
- 2.4 Impact of drivers and challenges
- Impact of drivers and challenges in 2024 and 2029
3 Market Landscape
- 3.1 Market ecosystem
- Parent Market
- Data Table on - Parent Market
- 3.2 Market characteristics
- Market characteristics analysis
- 3.3 Value chain analysis
- Value chain analysis
4 Market Sizing
- 4.1 Market definition
- Offerings of companies included in the market definition
- 4.2 Market segment analysis
- Market segments
- 4.3 Market size 2024
- 4.4 Market outlook: Forecast for 2024-2029
- Chart on Global - Market size and forecast 2024-2029 ($ million)
- Data Table on Global - Market size and forecast 2024-2029 ($ million)
- Chart on Global Market: Year-over-year growth 2024-2029 (%)
- Data Table on Global Market: Year-over-year growth 2024-2029 (%)
5 Historic Market Size
- 5.1 Global Beverage Can Market 2019 - 2023
- Historic Market Size - Data Table on Global Beverage Can Market 2019 - 2023 ($ million)
- 5.2 Application segment analysis 2019 - 2023
- Historic Market Size - Application Segment 2019 - 2023 ($ million)
- 5.3 Material segment analysis 2019 - 2023
- Historic Market Size - Material Segment 2019 - 2023 ($ million)
- 5.4 Geography segment analysis 2019 - 2023
- Historic Market Size - Geography Segment 2019 - 2023 ($ million)
- 5.5 Country segment analysis 2019 - 2023
- Historic Market Size - Country Segment 2019 - 2023 ($ million)
6 Qualitative Analysis
- 6.1 The AI impact on Global Beverage Can Market
7 Five Forces Analysis
- 7.1 Five forces summary
- Five forces analysis - Comparison between 2024 and 2029
- 7.2 Bargaining power of buyers
- Bargaining power of buyers - Impact of key factors 2024 and 2029
- 7.3 Bargaining power of suppliers
- Bargaining power of suppliers - Impact of key factors in 2024 and 2029
- 7.4 Threat of new entrants
- Threat of new entrants - Impact of key factors in 2024 and 2029
- 7.5 Threat of substitutes
- Threat of substitutes - Impact of key factors in 2024 and 2029
- 7.6 Threat of rivalry
- Threat of rivalry - Impact of key factors in 2024 and 2029
- 7.7 Market condition
- Chart on Market condition - Five forces 2024 and 2029
8 Market Segmentation by Application
- 8.1 Market segments
- Chart on Application - Market share 2024-2029 (%)
- Data Table on Application - Market share 2024-2029 (%)
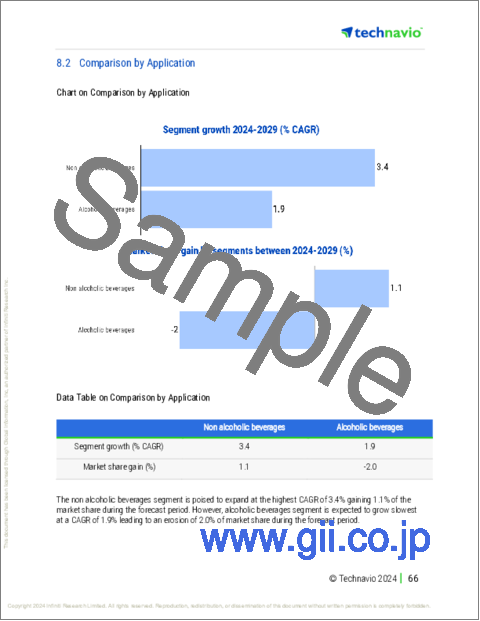
- 8.2 Comparison by Application
- Chart on Comparison by Application
- Data Table on Comparison by Application
- 8.3 Non alcoholic beverages - Market size and forecast 2024-2029
- Chart on Non alcoholic beverages - Market size and forecast 2024-2029 ($ million)
- Data Table on Non alcoholic beverages - Market size and forecast 2024-2029 ($ million)
- Chart on Non alcoholic beverages - Year-over-year growth 2024-2029 (%)
- Data Table on Non alcoholic beverages - Year-over-year growth 2024-2029 (%)
- 8.4 Alcoholic beverages - Market size and forecast 2024-2029
- Chart on Alcoholic beverages - Market size and forecast 2024-2029 ($ million)
- Data Table on Alcoholic beverages - Market size and forecast 2024-2029 ($ million)
- Chart on Alcoholic beverages - Year-over-year growth 2024-2029 (%)
- Data Table on Alcoholic beverages - Year-over-year growth 2024-2029 (%)
- 8.5 Market opportunity by Application
- Market opportunity by Application ($ million)
- Data Table on Market opportunity by Application ($ million)
9 Market Segmentation by Material
- 9.1 Market segments
- Chart on Material - Market share 2024-2029 (%)
- Data Table on Material - Market share 2024-2029 (%)
- 9.2 Comparison by Material
- Chart on Comparison by Material
- Data Table on Comparison by Material
- 9.3 Aluminum - Market size and forecast 2024-2029
- Chart on Aluminum - Market size and forecast 2024-2029 ($ million)
- Data Table on Aluminum - Market size and forecast 2024-2029 ($ million)
- Chart on Aluminum - Year-over-year growth 2024-2029 (%)
- Data Table on Aluminum - Year-over-year growth 2024-2029 (%)
- 9.4 Steel - Market size and forecast 2024-2029
- Chart on Steel - Market size and forecast 2024-2029 ($ million)
- Data Table on Steel - Market size and forecast 2024-2029 ($ million)
- Chart on Steel - Year-over-year growth 2024-2029 (%)
- Data Table on Steel - Year-over-year growth 2024-2029 (%)
- 9.5 Market opportunity by Material
- Market opportunity by Material ($ million)
- Data Table on Market opportunity by Material ($ million)
10 Customer Landscape
- 10.1 Customer landscape overview
- Analysis of price sensitivity, lifecycle, customer purchase basket, adoption rates, and purchase criteria
11 Geographic Landscape
- 11.1 Geographic segmentation
- Chart on Market share By Geographical Landscape 2024-2029 (%)
- Data Table on Market share By Geographical Landscape 2024-2029 (%)
- 11.2 Geographic comparison
- Chart on Geographic comparison
- Data Table on Geographic comparison
- 11.3 APAC - Market size and forecast 2024-2029
- Chart on APAC - Market size and forecast 2024-2029 ($ million)
- Data Table on APAC - Market size and forecast 2024-2029 ($ million)
- Chart on APAC - Year-over-year growth 2024-2029 (%)
- Data Table on APAC - Year-over-year growth 2024-2029 (%)
- 11.4 North America - Market size and forecast 2024-2029
- Chart on North America - Market size and forecast 2024-2029 ($ million)
- Data Table on North America - Market size and forecast 2024-2029 ($ million)
- Chart on North America - Year-over-year growth 2024-2029 (%)
- Data Table on North America - Year-over-year growth 2024-2029 (%)
- 11.5 Europe - Market size and forecast 2024-2029
- Chart on Europe - Market size and forecast 2024-2029 ($ million)
- Data Table on Europe - Market size and forecast 2024-2029 ($ million)
- Chart on Europe - Year-over-year growth 2024-2029 (%)
- Data Table on Europe - Year-over-year growth 2024-2029 (%)
- 11.6 Middle East and Africa - Market size and forecast 2024-2029
- Chart on Middle East and Africa - Market size and forecast 2024-2029 ($ million)
- Data Table on Middle East and Africa - Market size and forecast 2024-2029 ($ million)
- Chart on Middle East and Africa - Year-over-year growth 2024-2029 (%)
- Data Table on Middle East and Africa - Year-over-year growth 2024-2029 (%)
- 11.7 South America - Market size and forecast 2024-2029
- Chart on South America - Market size and forecast 2024-2029 ($ million)
- Data Table on South America - Market size and forecast 2024-2029 ($ million)
- Chart on South America - Year-over-year growth 2024-2029 (%)
- Data Table on South America - Year-over-year growth 2024-2029 (%)
- 11.8 US - Market size and forecast 2024-2029
- Chart on US - Market size and forecast 2024-2029 ($ million)
- Data Table on US - Market size and forecast 2024-2029 ($ million)
- Chart on US - Year-over-year growth 2024-2029 (%)
- Data Table on US - Year-over-year growth 2024-2029 (%)
- 11.9 China - Market size and forecast 2024-2029
- Chart on China - Market size and forecast 2024-2029 ($ million)
- Data Table on China - Market size and forecast 2024-2029 ($ million)
- Chart on China - Year-over-year growth 2024-2029 (%)
- Data Table on China - Year-over-year growth 2024-2029 (%)
- 11.10 Canada - Market size and forecast 2024-2029
- Chart on Canada - Market size and forecast 2024-2029 ($ million)
- Data Table on Canada - Market size and forecast 2024-2029 ($ million)
- Chart on Canada - Year-over-year growth 2024-2029 (%)
- Data Table on Canada - Year-over-year growth 2024-2029 (%)
- 11.11 Germany - Market size and forecast 2024-2029
- Chart on Germany - Market size and forecast 2024-2029 ($ million)
- Data Table on Germany - Market size and forecast 2024-2029 ($ million)
- Chart on Germany - Year-over-year growth 2024-2029 (%)
- Data Table on Germany - Year-over-year growth 2024-2029 (%)
- 11.12 India - Market size and forecast 2024-2029
- Chart on India - Market size and forecast 2024-2029 ($ million)
- Data Table on India - Market size and forecast 2024-2029 ($ million)
- Chart on India - Year-over-year growth 2024-2029 (%)
- Data Table on India - Year-over-year growth 2024-2029 (%)
- 11.13 Japan - Market size and forecast 2024-2029
- Chart on Japan - Market size and forecast 2024-2029 ($ million)
- Data Table on Japan - Market size and forecast 2024-2029 ($ million)
- Chart on Japan - Year-over-year growth 2024-2029 (%)
- Data Table on Japan - Year-over-year growth 2024-2029 (%)
- 11.14 Brazil - Market size and forecast 2024-2029
- Chart on Brazil - Market size and forecast 2024-2029 ($ million)
- Data Table on Brazil - Market size and forecast 2024-2029 ($ million)
- Chart on Brazil - Year-over-year growth 2024-2029 (%)
- Data Table on Brazil - Year-over-year growth 2024-2029 (%)
- 11.15 UK - Market size and forecast 2024-2029
- Chart on UK - Market size and forecast 2024-2029 ($ million)
- Data Table on UK - Market size and forecast 2024-2029 ($ million)
- Chart on UK - Year-over-year growth 2024-2029 (%)
- Data Table on UK - Year-over-year growth 2024-2029 (%)
- 11.16 France - Market size and forecast 2024-2029
- Chart on France - Market size and forecast 2024-2029 ($ million)
- Data Table on France - Market size and forecast 2024-2029 ($ million)
- Chart on France - Year-over-year growth 2024-2029 (%)
- Data Table on France - Year-over-year growth 2024-2029 (%)
- 11.17 UAE - Market size and forecast 2024-2029
- Chart on UAE - Market size and forecast 2024-2029 ($ million)
- Data Table on UAE - Market size and forecast 2024-2029 ($ million)
- Chart on UAE - Year-over-year growth 2024-2029 (%)
- Data Table on UAE - Year-over-year growth 2024-2029 (%)
- 11.18 Market opportunity By Geographical Landscape
- Market opportunity By Geographical Landscape ($ million)
- Data Tables on Market opportunity By Geographical Landscape ($ million)
12 Drivers, Challenges, and Opportunity/Restraints
- 12.1 Market drivers
- 12.2 Market challenges
- 12.3 Impact of drivers and challenges
- Impact of drivers and challenges in 2024 and 2029
- 12.4 Market opportunities/restraints
13 Competitive Landscape
- 13.1 Overview
- 13.2 Competitive Landscape
- Overview on criticality of inputs and factors of differentiation
- 13.3 Landscape disruption
- Overview on factors of disruption
- 13.4 Industry risks
- Impact of key risks on business
14 Competitive Analysis
- 14.1 Companies profiled
- Companies covered
- 14.2 Company ranking index
- Company ranking index
- 14.3 Market positioning of companies
- Matrix on companies position and classification
- 14.4 Amcor Plc
- Amcor Plc - Overview
- Amcor Plc - Business segments
- Amcor Plc - Key news
- Amcor Plc - Key offerings
- Amcor Plc - Segment focus
- SWOT
- 14.5 Ardagh Group SA
- Ardagh Group SA - Overview
- Ardagh Group SA - Business segments
- Ardagh Group SA - Key news
- Ardagh Group SA - Key offerings
- Ardagh Group SA - Segment focus
- SWOT
- 14.6 Ball Corp.
- Ball Corp. - Overview
- Ball Corp. - Business segments
- Ball Corp. - Key offerings
- Ball Corp. - Segment focus
- SWOT
- 14.7 CANPACK SA
- CANPACK SA - Overview
- CANPACK SA - Product / Service
- CANPACK SA - Key offerings
- SWOT
- 14.8 CPMC Holdings Ltd.
- CPMC Holdings Ltd. - Overview
- CPMC Holdings Ltd. - Product / Service
- CPMC Holdings Ltd. - Key offerings
- SWOT
- 14.9 Crown Holdings Inc.
- Crown Holdings Inc. - Overview
- Crown Holdings Inc. - Business segments
- Crown Holdings Inc. - Key offerings
- Crown Holdings Inc. - Segment focus
- SWOT
- 14.10 Envases Ohringen GmbH
- Envases Ohringen GmbH - Overview
- Envases Ohringen GmbH - Product / Service
- Envases Ohringen GmbH - Key offerings
- SWOT
- 14.11 GZ Industries Ltd.
- GZ Industries Ltd. - Overview
- GZ Industries Ltd. - Product / Service
- GZ Industries Ltd. - Key offerings
- SWOT
- 14.12 Mitsubishi Materials Corp.
- Mitsubishi Materials Corp. - Overview
- Mitsubishi Materials Corp. - Business segments
- Mitsubishi Materials Corp. - Key news
- Mitsubishi Materials Corp. - Key offerings
- Mitsubishi Materials Corp. - Segment focus
- SWOT
- 14.13 Nampak Ltd.
- Nampak Ltd. - Overview
- Nampak Ltd. - Business segments
- Nampak Ltd. - Key offerings
- Nampak Ltd. - Segment focus
- SWOT
- 14.14 ORG Technology Co. Ltd.
- ORG Technology Co. Ltd. - Overview
- ORG Technology Co. Ltd. - Product / Service
- ORG Technology Co. Ltd. - Key offerings
- SWOT
- 14.15 Orora Ltd.
- Orora Ltd. - Overview
- Orora Ltd. - Business segments
- Orora Ltd. - Key offerings
- Orora Ltd. - Segment focus
- SWOT
- 14.16 Shengxing Group
- Shengxing Group - Overview
- Shengxing Group - Product / Service
- Shengxing Group - Key offerings
- SWOT
- 14.17 Silgan Holdings Inc.
- Silgan Holdings Inc. - Overview
- Silgan Holdings Inc. - Business segments
- Silgan Holdings Inc. - Key offerings
- Silgan Holdings Inc. - Segment focus
- SWOT
- 14.18 Trivium Packaging BV
- Trivium Packaging BV - Overview
- Trivium Packaging BV - Business segments
- Trivium Packaging BV - Key offerings
- Trivium Packaging BV - Segment focus
- SWOT
15 Appendix
- 15.1 Scope of the report
- 15.2 Inclusions and exclusions checklist
- Inclusions checklist
- Exclusions checklist
- 15.3 Currency conversion rates for US$
- Currency conversion rates for US$
- 15.4 Research methodology
- Research methodology
- 15.5 Data procurement
- Information sources
- 15.6 Data validation
- Data validation
- 15.7 Validation techniques employed for market sizing
- Validation techniques employed for market sizing
- 15.8 Data synthesis
- Data synthesis
- 15.9 360 degree market analysis
- 360 degree market analysis
- 15.10 List of abbreviations
- List of abbreviations

