|
|
市場調査レポート
商品コード
1180084
空港キオスクの世界市場 2023-2027Global Airport Kiosk Market 2023-2027 |
||||||
|
|
|||||||
|
● お客様のご希望に応じて、既存データの加工や未掲載情報(例:国別セグメント)の追加などの対応が可能です。 詳細はお問い合わせください。 |
|||||||


| 空港キオスクの世界市場 2023-2027 |
|
出版日: 2022年12月24日
発行: TechNavio
ページ情報: 英文 173 Pages
納期: 即納可能
|
- 全表示
- 概要
- 図表
- 目次
当レポートでは空港キオスクの市場規模は、2022年から2027年の間に9億6,247万米ドルの増加が見込まれ、予測期間中に7.46%のCAGRで成長すると予測しています。
当レポートでは、空港キオスク市場の全体分析、市場規模・予測、動向、成長促進要因・課題、約25社のベンダーを網羅したベンダー分析を行っています。
現在の市場動向と促進要因、市場全体の環境に関する最新の分析を提供しています。市場は、乗客の移動の増加、スマートパーキングへの投資の増加、消費者行動を予測するためのデータ解析の利用の増加によって牽引されています。
本調査では、今後数年間の空港キオスク市場の成長を促進する主要な理由の1つとして、オペレーションのデジタル化を挙げています。また、空港キオスクの戦略的開拓と先端技術の統合は、市場の大きな需要につながるでしょう。
目次
第1章 エグゼクティブサマリー
- 市場概要
第2章 市場情勢
- 市場エコシステム
第3章 市場規模
- 市場の定義
- 市場セグメント分析
- 市場規模 2022
- 市場の見通し:2022-2027年の予測
第4章 市場規模実績
- 世界の空港キオスク市場2017-2021
- テクノロジーセグメント分析2017-2021
- タイプセグメント分析2017-2021
- 地域セグメント分析2017-2021
- 国セグメント分析2017-2021
第5章 ファイブフォース分析
- ファイブフォースの要約
- 買い手の交渉力
- 供給企業の交渉力
- 新規参入業者の脅威
- 代替品の脅威
- 競争の脅威
- 市況
第6章 テクノロジー別市場セグメンテーション
- マーケット・セグメント
- 技術別比較
- ハードウェア - 市場規模と予測 2022-2027
- ソフトウェア - 市場規模と予測 2022-2027
- サービス - 市場規模と予測 2022-2027
- テクノロジー別の市場機会
第7章 タイプ別の市場セグメンテーション
- マーケット・セグメント
- タイプ別比較
- チェックインキオスク - 市場規模と予測 2022-2027
- 自動化されたパスポートコントロール - 市場規模と予測 2022-2027
- 共用セルフサービス - 市場規模と予測 2022-2027
- バッグドロップ - 市場規模と予測 2022-2027
- その他 - 市場規模と予測 2022-2027
- タイプ別の市場機会
第8章 顧客情勢
- 顧客情勢の概要
第9章 地域別情勢
- 地域別セグメンテーション
- 地域別比較
- 北米 - 市場規模と予測 2022-2027
- 欧州 - 市場規模と予測 2022-2027
- APAC - 市場規模と予測 2022-2027
- 中東およびアフリカ - 市場規模と予測 2022-2027
- 南米 - 市場規模と予測 2022-2027
- 米国 - 市場規模と予測 2022-2027
- 中国 - 市場規模と予測 2022-2027
- 英国 - 市場規模と予測 2022-2027
- ドイツ - 市場規模と予測 2022-2027
- アラブ首長国連邦 - 市場規模と予測 2022-2027
- 地域情勢別の市場機会
第10章 促進要因、課題、および動向
- 市場促進要因
- 市場の課題
- 促進要因と課題の影響
- 市場動向
第11章 ベンダー情勢
- 概要
- ベンダー情勢
- 混乱の状況
- 業界のリスク
第12章 ベンダー分析
- 対象ベンダー
- ベンダーの市場ポジショニング
- Advantech Co. Ltd.
- Amadeus IT Group SA
- Bollore SE
- Cognizant Technology Solutions Corp.
- DERMALOG Identification Systems GmbH
- Elenium Automation Pty Ltd.
- Embross
- Marcus Pedersen ApS
- Materna Information and Communications SE
- NCR Corp.
- Parabit Systems Inc.
- Posiflex Technology Inc.
- Quavis
- Raytheon Technologies Corp.
- Secunet Security Networks AG
第13章 付録
Exhibits:
- Exhibits1: Executive Summary - Chart on Market Overview
- Exhibits2: Executive Summary - Data Table on Market Overview
- Exhibits3: Executive Summary - Chart on Global Market Characteristics
- Exhibits4: Executive Summary - Chart on Market By Geographical Landscape
- Exhibits5: Executive Summary - Chart on Market Segmentation by Technology
- Exhibits6: Executive Summary - Chart on Market Segmentation by Type
- Exhibits7: Executive Summary - Chart on Incremental Growth
- Exhibits8: Executive Summary - Data Table on Incremental Growth
- Exhibits9: Executive Summary - Chart on Vendor Market Positioning
- Exhibits10: Parent market
- Exhibits11: Market Characteristics
- Exhibits12: Offerings of vendors included in the market definition
- Exhibits13: Market segments
- Exhibits14: Chart on Global - Market size and forecast 2022-2027 ($ million)
- Exhibits15: Data Table on Global - Market size and forecast 2022-2027 ($ million)
- Exhibits16: Chart on Global Market: Year-over-year growth 2022-2027 (%)
- Exhibits17: Data Table on Global Market: Year-over-year growth 2022-2027 (%)
- Exhibits18: Historic Market Size - Data Table on Global airport kiosk market 2017 - 2021 ($ million)
- Exhibits19: Historic Market Size - Technology Segment 2017 - 2021 ($ million)
- Exhibits20: Historic Market Size - Type Segment 2017 - 2021 ($ million)
- Exhibits21: Historic Market Size - Geography Segment 2017 - 2021 ($ million)
- Exhibits22: Historic Market Size - Country Segment 2017 - 2021 ($ million)
- Exhibits23: Five forces analysis - Comparison between 2022 and 2027
- Exhibits24: Chart on Bargaining power of buyers - Impact of key factors 2022 and 2027
- Exhibits25: Bargaining power of suppliers - Impact of key factors in 2022 and 2027
- Exhibits26: Threat of new entrants - Impact of key factors in 2022 and 2027
- Exhibits27: Threat of substitutes - Impact of key factors in 2022 and 2027
- Exhibits28: Threat of rivalry - Impact of key factors in 2022 and 2027
- Exhibits29: Chart on Market condition - Five forces 2022 and 2027
- Exhibits30: Chart on Technology - Market share 2022-2027 (%)
- Exhibits31: Data Table on Technology - Market share 2022-2027 (%)
- Exhibits32: Chart on Comparison by Technology
- Exhibits33: Data Table on Comparison by Technology
- Exhibits34: Chart on Hardware - Market size and forecast 2022-2027 ($ million)
- Exhibits35: Data Table on Hardware - Market size and forecast 2022-2027 ($ million)
- Exhibits36: Chart on Hardware - Year-over-year growth 2022-2027 (%)
- Exhibits37: Data Table on Hardware - Year-over-year growth 2022-2027 (%)
- Exhibits38: Chart on Software - Market size and forecast 2022-2027 ($ million)
- Exhibits39: Data Table on Software - Market size and forecast 2022-2027 ($ million)
- Exhibits40: Chart on Software - Year-over-year growth 2022-2027 (%)
- Exhibits41: Data Table on Software - Year-over-year growth 2022-2027 (%)
- Exhibits42: Chart on Services - Market size and forecast 2022-2027 ($ million)
- Exhibits43: Data Table on Services - Market size and forecast 2022-2027 ($ million)
- Exhibits44: Chart on Services - Year-over-year growth 2022-2027 (%)
- Exhibits45: Data Table on Services - Year-over-year growth 2022-2027 (%)
- Exhibits46: Market opportunity by Technology ($ million)
- Exhibits47: Chart on Type - Market share 2022-2027 (%)
- Exhibits48: Data Table on Type - Market share 2022-2027 (%)
- Exhibits49: Chart on Comparison by Type
- Exhibits50: Data Table on Comparison by Type
- Exhibits51: Chart on Check-in Kiosk - Market size and forecast 2022-2027 ($ million)
- Exhibits52: Data Table on Check-in Kiosk - Market size and forecast 2022-2027 ($ million)
- Exhibits53: Chart on Check-in Kiosk - Year-over-year growth 2022-2027 (%)
- Exhibits54: Data Table on Check-in Kiosk - Year-over-year growth 2022-2027 (%)
- Exhibits55: Chart on Automated passport control - Market size and forecast 2022-2027 ($ million)
- Exhibits56: Data Table on Automated passport control - Market size and forecast 2022-2027 ($ million)
- Exhibits57: Chart on Automated passport control - Year-over-year growth 2022-2027 (%)
- Exhibits58: Data Table on Automated passport control - Year-over-year growth 2022-2027 (%)
- Exhibits59: Chart on Common-use self service - Market size and forecast 2022-2027 ($ million)
- Exhibits60: Data Table on Common-use self service - Market size and forecast 2022-2027 ($ million)
- Exhibits61: Chart on Common-use self service - Year-over-year growth 2022-2027 (%)
- Exhibits62: Data Table on Common-use self service - Year-over-year growth 2022-2027 (%)
- Exhibits63: Chart on Bag drop - Market size and forecast 2022-2027 ($ million)
- Exhibits64: Data Table on Bag drop - Market size and forecast 2022-2027 ($ million)
- Exhibits65: Chart on Bag drop - Year-over-year growth 2022-2027 (%)
- Exhibits66: Data Table on Bag drop - Year-over-year growth 2022-2027 (%)
- Exhibits67: Chart on Others - Market size and forecast 2022-2027 ($ million)
- Exhibits68: Data Table on Others - Market size and forecast 2022-2027 ($ million)
- Exhibits69: Chart on Others - Year-over-year growth 2022-2027 (%)
- Exhibits70: Data Table on Others - Year-over-year growth 2022-2027 (%)
- Exhibits71: Market opportunity by Type ($ million)
- Exhibits72: Analysis of price sensitivity, lifecycle, customer purchase basket, adoption rates, and purchase criteria
- Exhibits73: Chart on Market share By Geographical Landscape 2022-2027 (%)
- Exhibits74: Data Table on Market share By Geographical Landscape 2022-2027 (%)
- Exhibits75: Chart on Geographic comparison
- Exhibits76: Data Table on Geographic comparison
- Exhibits77: Chart on North America - Market size and forecast 2022-2027 ($ million)
- Exhibits78: Data Table on North America - Market size and forecast 2022-2027 ($ million)
- Exhibits79: Chart on North America - Year-over-year growth 2022-2027 (%)
- Exhibits80: Data Table on North America - Year-over-year growth 2022-2027 (%)
- Exhibits81: Chart on Europe - Market size and forecast 2022-2027 ($ million)
- Exhibits82: Data Table on Europe - Market size and forecast 2022-2027 ($ million)
- Exhibits83: Chart on Europe - Year-over-year growth 2022-2027 (%)
- Exhibits84: Data Table on Europe - Year-over-year growth 2022-2027 (%)
- Exhibits85: Chart on APAC - Market size and forecast 2022-2027 ($ million)
- Exhibits86: Data Table on APAC - Market size and forecast 2022-2027 ($ million)
- Exhibits87: Chart on APAC - Year-over-year growth 2022-2027 (%)
- Exhibits88: Data Table on APAC - Year-over-year growth 2022-2027 (%)
- Exhibits89: Chart on Middle East and Africa - Market size and forecast 2022-2027 ($ million)
- Exhibits90: Data Table on Middle East and Africa - Market size and forecast 2022-2027 ($ million)
- Exhibits91: Chart on Middle East and Africa - Year-over-year growth 2022-2027 (%)
- Exhibits92: Data Table on Middle East and Africa - Year-over-year growth 2022-2027 (%)
- Exhibits93: Chart on South America - Market size and forecast 2022-2027 ($ million)
- Exhibits94: Data Table on South America - Market size and forecast 2022-2027 ($ million)
- Exhibits95: Chart on South America - Year-over-year growth 2022-2027 (%)
- Exhibits96: Data Table on South America - Year-over-year growth 2022-2027 (%)
- Exhibits97: Chart on US - Market size and forecast 2022-2027 ($ million)
- Exhibits98: Data Table on US - Market size and forecast 2022-2027 ($ million)
- Exhibits99: Chart on US - Year-over-year growth 2022-2027 (%)
- Exhibits100: Data Table on US - Year-over-year growth 2022-2027 (%)
- Exhibits101: Chart on China - Market size and forecast 2022-2027 ($ million)
- Exhibits102: Data Table on China - Market size and forecast 2022-2027 ($ million)
- Exhibits103: Chart on China - Year-over-year growth 2022-2027 (%)
- Exhibits104: Data Table on China - Year-over-year growth 2022-2027 (%)
- Exhibits105: Chart on UK - Market size and forecast 2022-2027 ($ million)
- Exhibits106: Data Table on UK - Market size and forecast 2022-2027 ($ million)
- Exhibits107: Chart on UK - Year-over-year growth 2022-2027 (%)
- Exhibits108: Data Table on UK - Year-over-year growth 2022-2027 (%)
- Exhibits109: Chart on Germany - Market size and forecast 2022-2027 ($ million)
- Exhibits110: Data Table on Germany - Market size and forecast 2022-2027 ($ million)
- Exhibits111: Chart on Germany - Year-over-year growth 2022-2027 (%)
- Exhibits112: Data Table on Germany - Year-over-year growth 2022-2027 (%)
- Exhibits113: Chart on United Arab Emirates - Market size and forecast 2022-2027 ($ million)
- Exhibits114: Data Table on United Arab Emirates - Market size and forecast 2022-2027 ($ million)
- Exhibits115: Chart on United Arab Emirates - Year-over-year growth 2022-2027 (%)
- Exhibits116: Data Table on United Arab Emirates - Year-over-year growth 2022-2027 (%)
- Exhibits117: Market opportunity By Geographical Landscape ($ million)
- Exhibits118: Impact of drivers and challenges in 2022 and 2027
- Exhibits119: Overview on Criticality of inputs and Factors of differentiation
- Exhibits120: Overview on factors of disruption
- Exhibits121: Impact of key risks on business
- Exhibits122: Vendors covered
- Exhibits123: Matrix on vendor position and classification
- Exhibits124: Advantech Co. Ltd. - Overview
- Exhibits125: Advantech Co. Ltd. - Business segments
- Exhibits126: Advantech Co. Ltd. - Key offerings
- Exhibits127: Advantech Co. Ltd. - Segment focus
- Exhibits128: Amadeus IT Group SA - Overview
- Exhibits129: Amadeus IT Group SA - Business segments
- Exhibits130: Amadeus IT Group SA - Key news
- Exhibits131: Amadeus IT Group SA - Key offerings
- Exhibits132: Amadeus IT Group SA - Segment focus
- Exhibits133: Bollore SE - Overview
- Exhibits134: Bollore SE - Business segments
- Exhibits135: Bollore SE - Key offerings
- Exhibits136: Bollore SE - Segment focus
- Exhibits137: Cognizant Technology Solutions Corp. - Overview
- Exhibits138: Cognizant Technology Solutions Corp. - Business segments
- Exhibits139: Cognizant Technology Solutions Corp. - Key news
- Exhibits140: Cognizant Technology Solutions Corp. - Key offerings
- Exhibits141: Cognizant Technology Solutions Corp. - Segment focus
- Exhibits142: DERMALOG Identification Systems GmbH - Overview
- Exhibits143: DERMALOG Identification Systems GmbH - Product / Service
- Exhibits144: DERMALOG Identification Systems GmbH - Key offerings
- Exhibits145: Elenium Automation Pty Ltd. - Overview
- Exhibits146: Elenium Automation Pty Ltd. - Product / Service
- Exhibits147: Elenium Automation Pty Ltd. - Key news
- Exhibits148: Elenium Automation Pty Ltd. - Key offerings
- Exhibits149: Embross - Overview
- Exhibits150: Embross - Product / Service
- Exhibits151: Embross - Key offerings
- Exhibits152: Marcus Pedersen ApS - Overview
- Exhibits153: Marcus Pedersen ApS - Product / Service
- Exhibits154: Marcus Pedersen ApS - Key offerings
- Exhibits155: Materna Information and Communications SE - Overview
- Exhibits156: Materna Information and Communications SE - Product / Service
- Exhibits157: Materna Information and Communications SE - Key news
- Exhibits158: Materna Information and Communications SE - Key offerings
- Exhibits159: NCR Corp. - Overview
- Exhibits160: NCR Corp. - Business segments
- Exhibits161: NCR Corp. - Key news
- Exhibits162: NCR Corp. - Key offerings
- Exhibits163: NCR Corp. - Segment focus
- Exhibits164: Parabit Systems Inc. - Overview
- Exhibits165: Parabit Systems Inc. - Product / Service
- Exhibits166: Parabit Systems Inc. - Key offerings
- Exhibits167: Posiflex Technology Inc. - Overview
- Exhibits168: Posiflex Technology Inc. - Product / Service
- Exhibits169: Posiflex Technology Inc. - Key offerings
- Exhibits170: Quavis - Overview
- Exhibits171: Quavis - Product / Service
- Exhibits172: Quavis - Key offerings
- Exhibits173: Raytheon Technologies Corp. - Overview
- Exhibits174: Raytheon Technologies Corp. - Business segments
- Exhibits175: Raytheon Technologies Corp. - Key news
- Exhibits176: Raytheon Technologies Corp. - Key offerings
- Exhibits177: Raytheon Technologies Corp. - Segment focus
- Exhibits178: Secunet Security Networks AG - Overview
- Exhibits179: Secunet Security Networks AG - Business segments
- Exhibits180: Secunet Security Networks AG - Key offerings
- Exhibits181: Secunet Security Networks AG - Segment focus
- Exhibits182: Inclusions checklist
- Exhibits183: Exclusions checklist
- Exhibits184: Currency conversion rates for US$
- Exhibits185: Research methodology
- Exhibits186: Validation techniques employed for market sizing
- Exhibits187: Information sources
- Exhibits188: List of abbreviations
Technavio has been monitoring the airport kiosk market and is forecast to grow by $962.47 mn during 2022-2027, decelerating at a CAGR of 7.46% during the forecast period. Our report on the airport kiosk market provides a holistic analysis, market size and forecast, trends, growth drivers, and challenges, as well as vendor analysis covering around 25 vendors.
The report offers an up-to-date analysis regarding the current market scenario, the latest trends and drivers, and the overall market environment. The market is driven by increasing passenger travel, growing investment in smart parking, and increasing use of data analytics to predict consumer behavior.
Technavio's airport kiosk market is segmented as below:
By Technology
- Hardware
- Software
- Services
By Type
- Check-in Kiosk
- Automated passport control
- Common-use self service
- Bag drop
- Others
By Geographical Landscape
- North America
- Europe
- APAC
- Middle East and Africa
- South America
This study identifies the digitization of operations as one of the prime reasons driving the airport kiosk market growth during the next few years. Also, strategic developments and integration of advanced technologies in airport kiosks will lead to sizable demand in the market.
Technavio presents a detailed picture of the market by the way of study, synthesis, and summation of data from multiple sources by an analysis of key parameters. Our report on the airport kiosk market covers the following areas:
- Airport kiosk market sizing
- Airport kiosk market forecast
- Airport kiosk market industry analysis
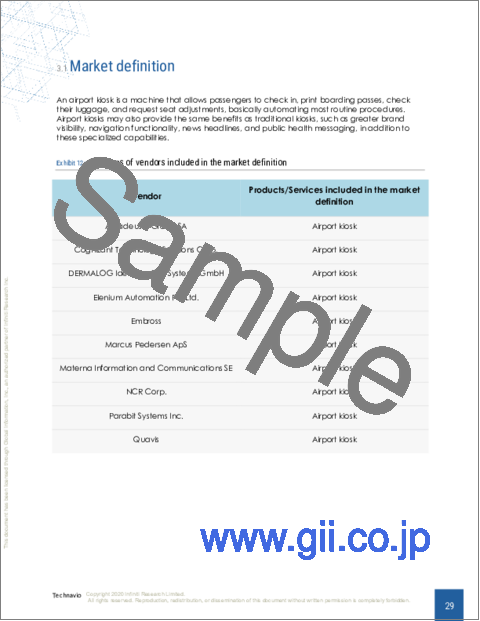
Technavio's robust vendor analysis is designed to help clients improve their market position, and in line with this, this report provides a detailed analysis of several leading airport kiosk market vendors that include Advantech Co. Ltd., Amadeus IT Group SA, Bollore SE, Cognizant Technology Solutions Corp., DERMALOG Identification Systems GmbH, Elenium Automation Pty Ltd., Embross, ICTS Europe S.A, Marcus Pedersen ApS, Materna Information and Communications SE, NCR Corp., Parabit Systems Inc., Phoenix Microsystems, Posiflex Technology Inc., Quavis, Raytheon Technologies Corp., Secunet Security Networks AG, SITA, Vancouver Airport Authority, and Zamar AG. Also, the airport kiosk market analysis report includes information on upcoming trends and challenges that will influence market growth. This is to help companies strategize and leverage all forthcoming growth opportunities.
The study was conducted using an objective combination of primary and secondary information including inputs from key participants in the industry. The report contains a comprehensive market and vendor landscape in addition to an analysis of the key vendors.
Technavio presents a detailed picture of the market by the way of study, synthesis, and summation of data from multiple sources by an analysis of key parameters such as profit, pricing, competition, and promotions. It presents various market facets by identifying the key industry influencers. The data presented is comprehensive, reliable, and a result of extensive research - both primary and secondary. Technavio's market research reports provide a complete competitive landscape and an in-depth vendor selection methodology and analysis using qualitative and quantitative research to forecast accurate market growth.
Table of Contents
1 Executive Summary
- 1.1 Market overview
- Exhibit 01: Executive Summary - Chart on Market Overview
- Exhibit 02: Executive Summary - Data Table on Market Overview
- Exhibit 03: Executive Summary - Chart on Global Market Characteristics
- Exhibit 04: Executive Summary - Chart on Market By Geographical Landscape
- Exhibit 05: Executive Summary - Chart on Market Segmentation by Technology
- Exhibit 06: Executive Summary - Chart on Market Segmentation by Type
- Exhibit 07: Executive Summary - Chart on Incremental Growth
- Exhibit 08: Executive Summary - Data Table on Incremental Growth
- Exhibit 09: Executive Summary - Chart on Vendor Market Positioning
2 Market Landscape
- 2.1 Market ecosystem
- Exhibit 10: Parent market
- Exhibit 11: Market Characteristics
3 Market Sizing
- 3.1 Market definition
- Exhibit 12: Offerings of vendors included in the market definition
- 3.2 Market segment analysis
- Exhibit 13: Market segments
- 3.3 Market size 2022
- 3.4 Market outlook: Forecast for 2022-2027
- Exhibit 14: Chart on Global - Market size and forecast 2022-2027 ($ million)
- Exhibit 15: Data Table on Global - Market size and forecast 2022-2027 ($ million)
- Exhibit 16: Chart on Global Market: Year-over-year growth 2022-2027 (%)
- Exhibit 17: Data Table on Global Market: Year-over-year growth 2022-2027 (%)
4 Historic Market Size
- 4.1 Global airport kiosk market 2017 - 2021
- Exhibit 18: Historic Market Size - Data Table on Global airport kiosk market 2017 - 2021 ($ million)
- 4.2 Technology Segment Analysis 2017 - 2021
- Exhibit 19: Historic Market Size - Technology Segment 2017 - 2021 ($ million)
- 4.3 Type Segment Analysis 2017 - 2021
- Exhibit 20: Historic Market Size - Type Segment 2017 - 2021 ($ million)
- 4.4 Geography Segment Analysis 2017 - 2021
- Exhibit 21: Historic Market Size - Geography Segment 2017 - 2021 ($ million)
- 4.5 Country Segment Analysis 2017 - 2021
- Exhibit 22: Historic Market Size - Country Segment 2017 - 2021 ($ million)
5 Five Forces Analysis
- 5.1 Five forces summary
- Exhibit 23: Five forces analysis - Comparison between 2022 and 2027
- 5.2 Bargaining power of buyers
- Exhibit 24: Chart on Bargaining power of buyers - Impact of key factors 2022 and 2027
- 5.3 Bargaining power of suppliers
- Exhibit 25: Bargaining power of suppliers - Impact of key factors in 2022 and 2027
- 5.4 Threat of new entrants
- Exhibit 26: Threat of new entrants - Impact of key factors in 2022 and 2027
- 5.5 Threat of substitutes
- Exhibit 27: Threat of substitutes - Impact of key factors in 2022 and 2027
- 5.6 Threat of rivalry
- Exhibit 28: Threat of rivalry - Impact of key factors in 2022 and 2027
- 5.7 Market condition
- Exhibit 29: Chart on Market condition - Five forces 2022 and 2027
6 Market Segmentation by Technology
- 6.1 Market segments
- Exhibit 30: Chart on Technology - Market share 2022-2027 (%)
- Exhibit 31: Data Table on Technology - Market share 2022-2027 (%)
- 6.2 Comparison by Technology
- Exhibit 32: Chart on Comparison by Technology
- Exhibit 33: Data Table on Comparison by Technology
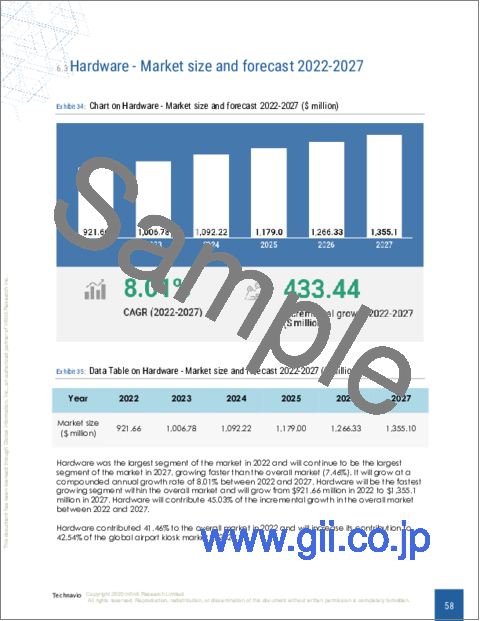
- 6.3 Hardware - Market size and forecast 2022-2027
- Exhibit 34: Chart on Hardware - Market size and forecast 2022-2027 ($ million)
- Exhibit 35: Data Table on Hardware - Market size and forecast 2022-2027 ($ million)
- Exhibit 36: Chart on Hardware - Year-over-year growth 2022-2027 (%)
- Exhibit 37: Data Table on Hardware - Year-over-year growth 2022-2027 (%)
- 6.4 Software - Market size and forecast 2022-2027
- Exhibit 38: Chart on Software - Market size and forecast 2022-2027 ($ million)
- Exhibit 39: Data Table on Software - Market size and forecast 2022-2027 ($ million)
- Exhibit 40: Chart on Software - Year-over-year growth 2022-2027 (%)
- Exhibit 41: Data Table on Software - Year-over-year growth 2022-2027 (%)
- 6.5 Services - Market size and forecast 2022-2027
- Exhibit 42: Chart on Services - Market size and forecast 2022-2027 ($ million)
- Exhibit 43: Data Table on Services - Market size and forecast 2022-2027 ($ million)
- Exhibit 44: Chart on Services - Year-over-year growth 2022-2027 (%)
- Exhibit 45: Data Table on Services - Year-over-year growth 2022-2027 (%)
- 6.6 Market opportunity by Technology
- Exhibit 46: Market opportunity by Technology ($ million)
7 Market Segmentation by Type
- 7.1 Market segments
- Exhibit 47: Chart on Type - Market share 2022-2027 (%)
- Exhibit 48: Data Table on Type - Market share 2022-2027 (%)
- 7.2 Comparison by Type
- Exhibit 49: Chart on Comparison by Type
- Exhibit 50: Data Table on Comparison by Type
- 7.3 Check-in Kiosk - Market size and forecast 2022-2027
- Exhibit 51: Chart on Check-in Kiosk - Market size and forecast 2022-2027 ($ million)
- Exhibit 52: Data Table on Check-in Kiosk - Market size and forecast 2022-2027 ($ million)
- Exhibit 53: Chart on Check-in Kiosk - Year-over-year growth 2022-2027 (%)
- Exhibit 54: Data Table on Check-in Kiosk - Year-over-year growth 2022-2027 (%)
- 7.4 Automated passport control - Market size and forecast 2022-2027
- Exhibit 55: Chart on Automated passport control - Market size and forecast 2022-2027 ($ million)
- Exhibit 56: Data Table on Automated passport control - Market size and forecast 2022-2027 ($ million)
- Exhibit 57: Chart on Automated passport control - Year-over-year growth 2022-2027 (%)
- Exhibit 58: Data Table on Automated passport control - Year-over-year growth 2022-2027 (%)
- 7.5 Common-use self service - Market size and forecast 2022-2027
- Exhibit 59: Chart on Common-use self service - Market size and forecast 2022-2027 ($ million)
- Exhibit 60: Data Table on Common-use self service - Market size and forecast 2022-2027 ($ million)
- Exhibit 61: Chart on Common-use self service - Year-over-year growth 2022-2027 (%)
- Exhibit 62: Data Table on Common-use self service - Year-over-year growth 2022-2027 (%)
- 7.6 Bag drop - Market size and forecast 2022-2027
- Exhibit 63: Chart on Bag drop - Market size and forecast 2022-2027 ($ million)
- Exhibit 64: Data Table on Bag drop - Market size and forecast 2022-2027 ($ million)
- Exhibit 65: Chart on Bag drop - Year-over-year growth 2022-2027 (%)
- Exhibit 66: Data Table on Bag drop - Year-over-year growth 2022-2027 (%)
- 7.7 Others - Market size and forecast 2022-2027
- Exhibit 67: Chart on Others - Market size and forecast 2022-2027 ($ million)
- Exhibit 68: Data Table on Others - Market size and forecast 2022-2027 ($ million)
- Exhibit 69: Chart on Others - Year-over-year growth 2022-2027 (%)
- Exhibit 70: Data Table on Others - Year-over-year growth 2022-2027 (%)
- 7.8 Market opportunity by Type
- Exhibit 71: Market opportunity by Type ($ million)
8 Customer Landscape
- 8.1 Customer landscape overview
- Exhibit 72: Analysis of price sensitivity, lifecycle, customer purchase basket, adoption rates, and purchase criteria
9 Geographic Landscape
- 9.1 Geographic segmentation
- Exhibit 73: Chart on Market share By Geographical Landscape 2022-2027 (%)
- Exhibit 74: Data Table on Market share By Geographical Landscape 2022-2027 (%)
- 9.2 Geographic comparison
- Exhibit 75: Chart on Geographic comparison
- Exhibit 76: Data Table on Geographic comparison
- 9.3 North America - Market size and forecast 2022-2027
- Exhibit 77: Chart on North America - Market size and forecast 2022-2027 ($ million)
- Exhibit 78: Data Table on North America - Market size and forecast 2022-2027 ($ million)
- Exhibit 79: Chart on North America - Year-over-year growth 2022-2027 (%)
- Exhibit 80: Data Table on North America - Year-over-year growth 2022-2027 (%)
- 9.4 Europe - Market size and forecast 2022-2027
- Exhibit 81: Chart on Europe - Market size and forecast 2022-2027 ($ million)
- Exhibit 82: Data Table on Europe - Market size and forecast 2022-2027 ($ million)
- Exhibit 83: Chart on Europe - Year-over-year growth 2022-2027 (%)
- Exhibit 84: Data Table on Europe - Year-over-year growth 2022-2027 (%)
- 9.5 APAC - Market size and forecast 2022-2027
- Exhibit 85: Chart on APAC - Market size and forecast 2022-2027 ($ million)
- Exhibit 86: Data Table on APAC - Market size and forecast 2022-2027 ($ million)
- Exhibit 87: Chart on APAC - Year-over-year growth 2022-2027 (%)
- Exhibit 88: Data Table on APAC - Year-over-year growth 2022-2027 (%)
- 9.6 Middle East and Africa - Market size and forecast 2022-2027
- Exhibit 89: Chart on Middle East and Africa - Market size and forecast 2022-2027 ($ million)
- Exhibit 90: Data Table on Middle East and Africa - Market size and forecast 2022-2027 ($ million)
- Exhibit 91: Chart on Middle East and Africa - Year-over-year growth 2022-2027 (%)
- Exhibit 92: Data Table on Middle East and Africa - Year-over-year growth 2022-2027 (%)
- 9.7 South America - Market size and forecast 2022-2027
- Exhibit 93: Chart on South America - Market size and forecast 2022-2027 ($ million)
- Exhibit 94: Data Table on South America - Market size and forecast 2022-2027 ($ million)
- Exhibit 95: Chart on South America - Year-over-year growth 2022-2027 (%)
- Exhibit 96: Data Table on South America - Year-over-year growth 2022-2027 (%)
- 9.8 US - Market size and forecast 2022-2027
- Exhibit 97: Chart on US - Market size and forecast 2022-2027 ($ million)
- Exhibit 98: Data Table on US - Market size and forecast 2022-2027 ($ million)
- Exhibit 99: Chart on US - Year-over-year growth 2022-2027 (%)
- Exhibit 100: Data Table on US - Year-over-year growth 2022-2027 (%)
- 9.9 China - Market size and forecast 2022-2027
- Exhibit 101: Chart on China - Market size and forecast 2022-2027 ($ million)
- Exhibit 102: Data Table on China - Market size and forecast 2022-2027 ($ million)
- Exhibit 103: Chart on China - Year-over-year growth 2022-2027 (%)
- Exhibit 104: Data Table on China - Year-over-year growth 2022-2027 (%)
- 9.10 UK - Market size and forecast 2022-2027
- Exhibit 105: Chart on UK - Market size and forecast 2022-2027 ($ million)
- Exhibit 106: Data Table on UK - Market size and forecast 2022-2027 ($ million)
- Exhibit 107: Chart on UK - Year-over-year growth 2022-2027 (%)
- Exhibit 108: Data Table on UK - Year-over-year growth 2022-2027 (%)
- 9.11 Germany - Market size and forecast 2022-2027
- Exhibit 109: Chart on Germany - Market size and forecast 2022-2027 ($ million)
- Exhibit 110: Data Table on Germany - Market size and forecast 2022-2027 ($ million)
- Exhibit 111: Chart on Germany - Year-over-year growth 2022-2027 (%)
- Exhibit 112: Data Table on Germany - Year-over-year growth 2022-2027 (%)
- 9.12 United Arab Emirates - Market size and forecast 2022-2027
- Exhibit 113: Chart on United Arab Emirates - Market size and forecast 2022-2027 ($ million)
- Exhibit 114: Data Table on United Arab Emirates - Market size and forecast 2022-2027 ($ million)
- Exhibit 115: Chart on United Arab Emirates - Year-over-year growth 2022-2027 (%)
- Exhibit 116: Data Table on United Arab Emirates - Year-over-year growth 2022-2027 (%)
- 9.13 Market opportunity By Geographical Landscape
- Exhibit 117: Market opportunity By Geographical Landscape ($ million)
10 Drivers, Challenges, and Trends
- 10.1 Market drivers
- 10.2 Market challenges
- 10.3 Impact of drivers and challenges
- Exhibit 118: Impact of drivers and challenges in 2022 and 2027
- 10.4 Market trends
11 Vendor Landscape
- 11.1 Overview
- 11.2 Vendor landscape
- Exhibit 119: Overview on Criticality of inputs and Factors of differentiation
- 11.3 Landscape disruption
- Exhibit 120: Overview on factors of disruption
- 11.4 Industry risks
- Exhibit 121: Impact of key risks on business
12 Vendor Analysis
- 12.1 Vendors covered
- Exhibit 122: Vendors covered
- 12.2 Market positioning of vendors
- Exhibit 123: Matrix on vendor position and classification
- 12.3 Advantech Co. Ltd.
- Exhibit 124: Advantech Co. Ltd. - Overview
- Exhibit 125: Advantech Co. Ltd. - Business segments
- Exhibit 126: Advantech Co. Ltd. - Key offerings
- Exhibit 127: Advantech Co. Ltd. - Segment focus
- 12.4 Amadeus IT Group SA
- Exhibit 128: Amadeus IT Group SA - Overview
- Exhibit 129: Amadeus IT Group SA - Business segments
- Exhibit 130: Amadeus IT Group SA - Key news
- Exhibit 131: Amadeus IT Group SA - Key offerings
- Exhibit 132: Amadeus IT Group SA - Segment focus
- 12.5 Bollore SE
- Exhibit 133: Bollore SE - Overview
- Exhibit 134: Bollore SE - Business segments
- Exhibit 135: Bollore SE - Key offerings
- Exhibit 136: Bollore SE - Segment focus
- 12.6 Cognizant Technology Solutions Corp.
- Exhibit 137: Cognizant Technology Solutions Corp. - Overview
- Exhibit 138: Cognizant Technology Solutions Corp. - Business segments
- Exhibit 139: Cognizant Technology Solutions Corp. - Key news
- Exhibit 140: Cognizant Technology Solutions Corp. - Key offerings
- Exhibit 141: Cognizant Technology Solutions Corp. - Segment focus
- 12.7 DERMALOG Identification Systems GmbH
- Exhibit 142: DERMALOG Identification Systems GmbH - Overview
- Exhibit 143: DERMALOG Identification Systems GmbH - Product / Service
- Exhibit 144: DERMALOG Identification Systems GmbH - Key offerings
- 12.8 Elenium Automation Pty Ltd.
- Exhibit 145: Elenium Automation Pty Ltd. - Overview
- Exhibit 146: Elenium Automation Pty Ltd. - Product / Service
- Exhibit 147: Elenium Automation Pty Ltd. - Key news
- Exhibit 148: Elenium Automation Pty Ltd. - Key offerings
- 12.9 Embross
- Exhibit 149: Embross - Overview
- Exhibit 150: Embross - Product / Service
- Exhibit 151: Embross - Key offerings
- 12.10 Marcus Pedersen ApS
- Exhibit 152: Marcus Pedersen ApS - Overview
- Exhibit 153: Marcus Pedersen ApS - Product / Service
- Exhibit 154: Marcus Pedersen ApS - Key offerings
- 12.11 Materna Information and Communications SE
- Exhibit 155: Materna Information and Communications SE - Overview
- Exhibit 156: Materna Information and Communications SE - Product / Service
- Exhibit 157: Materna Information and Communications SE - Key news
- Exhibit 158: Materna Information and Communications SE - Key offerings
- 12.12 NCR Corp.
- Exhibit 159: NCR Corp. - Overview
- Exhibit 160: NCR Corp. - Business segments
- Exhibit 161: NCR Corp. - Key news
- Exhibit 162: NCR Corp. - Key offerings
- Exhibit 163: NCR Corp. - Segment focus
- 12.13 Parabit Systems Inc.
- Exhibit 164: Parabit Systems Inc. - Overview
- Exhibit 165: Parabit Systems Inc. - Product / Service
- Exhibit 166: Parabit Systems Inc. - Key offerings
- 12.14 Posiflex Technology Inc.
- Exhibit 167: Posiflex Technology Inc. - Overview
- Exhibit 168: Posiflex Technology Inc. - Product / Service
- Exhibit 169: Posiflex Technology Inc. - Key offerings
- 12.15 Quavis
- Exhibit 170: Quavis - Overview
- Exhibit 171: Quavis - Product / Service
- Exhibit 172: Quavis - Key offerings
- 12.16 Raytheon Technologies Corp.
- Exhibit 173: Raytheon Technologies Corp. - Overview
- Exhibit 174: Raytheon Technologies Corp. - Business segments
- Exhibit 175: Raytheon Technologies Corp. - Key news
- Exhibit 176: Raytheon Technologies Corp. - Key offerings
- Exhibit 177: Raytheon Technologies Corp. - Segment focus
- 12.17 Secunet Security Networks AG
- Exhibit 178: Secunet Security Networks AG - Overview
- Exhibit 179: Secunet Security Networks AG - Business segments
- Exhibit 180: Secunet Security Networks AG - Key offerings
- Exhibit 181: Secunet Security Networks AG - Segment focus
13 Appendix
- 13.1 Scope of the report
- 13.2 Inclusions and exclusions checklist
- Exhibit 182: Inclusions checklist
- Exhibit 183: Exclusions checklist
- 13.3 Currency conversion rates for US$
- Exhibit 184: Currency conversion rates for US$
- 13.4 Research methodology
- Exhibit 185: Research methodology
- Exhibit 186: Validation techniques employed for market sizing
- Exhibit 187: Information sources
- 13.5 List of abbreviations
- Exhibit 188: List of abbreviations
- demand for infrastructure-as-a-service (IaaS): The ongoing migration from on-premise infrastructure to cloud-based services is having an impact on the revenues of original equipment manufacturers (OEMs) of servers, albeit the adverse impact on them is slightly milder than the effect on storage equipment. The emergence of IaaS has had a strong impact on the IT hardware market. The biggest advantage of IaaS is that it allows enterprises to scale operations or introduce innovations in the workflow without the need to make substantial investments in storage and servers for the traditional on-premise hardware environment. At the same time, cloud-focused infrastructure spending is expected to increase in terms of server, disk storage, and networking hardware.