
|
市場調査レポート
商品コード
1666721
空港キオスクシステムの市場機会、成長促進要因、産業動向分析、2025年~2034年予測Airport Kiosk System Market Opportunity, Growth Drivers, Industry Trend Analysis, and Forecast 2025 - 2034 |
||||||
カスタマイズ可能
|
|||||||
| 空港キオスクシステムの市場機会、成長促進要因、産業動向分析、2025年~2034年予測 |
|
出版日: 2024年12月20日
発行: Global Market Insights Inc.
ページ情報: 英文 170 Pages
納期: 2~3営業日
|

全表示
- 概要
- 目次
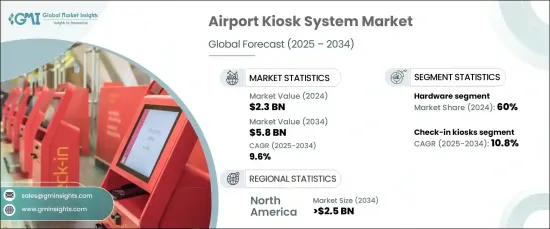
世界の空港キオスクシステム市場は、2024年に23億米ドルとなり、2025年から2034年にかけてCAGR9.6%で拡大すると予測されています。
市場成長の原動力となっているのは、航空旅客数の増加と、よりスムーズで効率的な空港運営に対するニーズの高まりです。空港では、増加する旅客数を管理しながらより良いサービスを提供しようと努力しており、セルフサービスキオスクは、プロセスの合理化、待ち時間の短縮、旅客全体の満足度の向上において重要な役割を果たしています。
これらのシステムは、従来のカウンターサービスを必要とせず、旅行者がチェックイン手続き、手荷物タグ付け、座席指定を単独で完了できるようにすることで、空港での体験を一変させています。このような自動化ソリューションに対する需要の高まりにより、空港はテクノロジーの導入を優先するようになり、生体認証、多言語オプション、共通利用旅客処理システム(CUPPS)などの革新的なツールの導入を推進しています。
| 市場範囲 | |
|---|---|
| 開始年 | 2024年 |
| 予測年 | 2025年~2034年 |
| 開始金額 | 23億米ドル |
| 予測金額 | 58億米ドル |
| CAGR | 9.6% |
航空機の利用頻度とアクセス性が高まるにつれ、利用客はより迅速でシームレスな空港体験を求めています。その結果、空港運営会社はセルフサービスキオスクソリューションの導入に熱心で、特に旅行のピーク時のボトルネックを減らし、業務フローを改善しています。特筆すべきは、キオスク端末に生体認証技術を統合することでセキュリティ対策が強化され、安全性を損なうことなく、より迅速な本人確認が可能になっていることです。さらに、自動化されたパスポートコントロールや手荷物預け入れキオスクは、手作業のプロセスを削減することで空港業務の最適化に役立っており、これにより空港での体験全体がスピードアップしています。こうしたシステムの進化に伴い、利用者と空港運営者双方の要求を満たすよう調整される傾向が強まっており、利用者が空港内を快適に移動できる一方、空港はスムーズで効率的なワークフローを維持できるようになっています。
市場はハードウェア、ソフトウェア、サービスに分けられ、2024年にはハードウェア分野が60%の圧倒的シェアを占めました。この優位性は、キオスク端末、バーコードスキャナー、プリンター、タッチスクリーン、手荷物預け入れユニットなど、必要不可欠なインフラが広く展開されていることが主な要因です。これらのシステムはしばしば、プロセスをより安全でユーザーフレンドリーにするバイオメトリック技術やタッチレス技術で強化されています。キオスク端末の種類の中では、チェックインキオスク端末の分野がCAGR10.8%と最も高い成長が見込まれています。この成長は、空港が処理時間の短縮と混雑の緩和を求めてセルフサービスチェックインへのシフトが進んでいることを反映しています。
北米では、空港キオスクシステム市場は2034年までに25億米ドルに達すると予測されています。同地域は、旅客数の増加と空港のスマート化技術への多額の投資により、急成長を遂げています。生体認証機能、手荷物預け入れシステム、自動パスポートコントロールを備えたキオスク端末は、国内外からの旅客の需要に応えるために採用されています。こうした技術革新により、北米の空港は全体的な旅行体験と運営効率を高めています。
目次
第1章 調査手法と調査範囲
- 市場範囲と定義
- 基本推定と計算
- 予測計算
- データソース
- 一次
- 二次
- 有料ソース
- 公的ソース
第2章 エグゼクティブサマリー
第3章 業界洞察
- 業界エコシステム分析
- バリューチェーンに影響を与える要因
- 利益率分析
- 変革
- 将来の展望
- メーカー
- 流通業者
- サプライヤーの状況
- 利益率分析
- 主要ニュースと取り組み
- 規制状況
- 影響要因
- 成長促進要因
- 空港運営を最適化するためのセルフサービス技術の採用拡大
- 効率的なチェックインプロセスに対する旅客需要の増加
- スマート空港の世界の拡大によるキオスクシステム導入の促進
- 空港キオスクシステムにおける生体認証の導入
- 費用対効果の高い空港自動化ソリューションに対する需要の高まり
- 業界の潜在的リスク・課題
- キオスクシステム導入のための高額な初期投資要件
- 旅客データ保護に関するサイバーセキュリティリスク
- 成長促進要因
- 成長可能性分析
- ポーター分析
- PESTEL分析
第4章 競合情勢
- イントロダクション
- 企業市場シェア分析
- 競合のポジショニングマトリックス
- 戦略展望マトリックス
第5章 市場推計・予測:コンポーネント別、2021年~2034年
- 主要動向
- ハードウェア
- ソフトウェア
- サービス
第6章 市場推計・予測:タイプ別、2021年~2034年
- 主要動向
- チェックインキオスク
- 自動出入国管理キオスク
- 共用セルフキオスク
- バッグドロップキオスク
- リテールキオスク
- その他
第7章 市場推計・予測:地域別、2021年~2034年
- 主要動向
- 北米
- 米国
- カナダ
- 欧州
- 英国
- ドイツ
- フランス
- イタリア
- スペイン
- ロシア
- アジア太平洋
- 中国
- インド
- 日本
- 韓国
- オーストラリア
- ラテンアメリカ
- ブラジル
- メキシコ
- 中東・アフリカ
- 南アフリカ
- サウジアラビア
- アラブ首長国連邦
第8章 企業プロファイル
- Amadeus IT Group SA
- Elenium Automation Pty Ltd
- Embross Group
- Fujitsu Ltd.
- IER SAS
- Innovative Travel Solutions
- KIOSK Information Systems
- Marcus Pedersen Ap
- Materna IPS GmbH(SITA)
- NCR Voyix Corporation
- Olea Kiosks Inc.
- Phoenix Kiosk, Inc
- Rockwell Collins, Inc.
- Toshiba Tec Cor
The Global Airport Kiosk System Market, valued at USD 2.3 billion in 2024, is projected to expand at a CAGR of 9.6% from 2025 to 2034. The market growth is being driven by the increasing volume of air passengers and the rising need for smoother, more efficient airport operations. As airports strive to provide better services while managing growing passenger traffic, self-service kiosks are playing a crucial role in streamlining processes, reducing wait times, and improving overall passenger satisfaction.
These systems are transforming the airport experience by enabling travelers to complete check-in procedures, baggage tagging, and seat selection independently, without the need for traditional counter service. This growing demand for automated solutions has led airports to prioritize technology adoption, pushing them to implement innovative tools like biometric verification, multi-language options, and Common Use Passenger Processing Systems (CUPPS), all contributing to enhanced efficiency and security.
| Market Scope | |
|---|---|
| Start Year | 2024 |
| Forecast Year | 2025-2034 |
| Start Value | $2.3 billion |
| Forecast Value | $5.8 billion |
| CAGR | 9.6% |
With air travel becoming more frequent and accessible, passengers expect quicker, seamless airport experiences. As a result, airport operators are keen to deploy self-service kiosk solutions, reducing bottlenecks and improving operational flow, especially during peak travel periods. Notably, the integration of biometric technologies in kiosks is bolstering security measures, allowing for faster identity verification without compromising safety. Furthermore, automated passport control and baggage drop kiosks are helping to optimize airport operations by cutting down on manual processes, which speeds up the entire airport experience. As these systems evolve, they are increasingly tailored to meet the demands of both passengers and airport operators, ensuring that travelers can move through airports with ease while airports maintain smooth and efficient workflows.
The market is divided into hardware, software, and services, with the hardware segment holding a dominant share of 60% in 2024. This dominance is largely due to the widespread deployment of essential infrastructure such as kiosks, barcode scanners, printers, touchscreens, and bag drop units. These systems are often enhanced with biometric and touchless technologies that make the process more secure and user-friendly. Among the types of kiosks available, the check-in kiosk segment is expected to experience the highest growth, with a CAGR of 10.8%. This growth reflects an ongoing shift toward self-service check-in as airports seek faster processing times and reduced congestion.
In North America, the airport kiosk system market is forecast to reach USD 2.5 billion by 2034. The region is experiencing rapid growth as passenger numbers increase and airports invest heavily in smart technologies. Kiosks equipped with biometric features, baggage drop systems, and automated passport control are being adopted to meet the demands of both domestic and international passengers. With these innovations, North American airports are enhancing the overall travel experience and operational efficiency.
Table of Contents
Chapter 1 Methodology & Scope
- 1.1 Market scope & definitions
- 1.2 Base estimates & calculations
- 1.3 Forecast calculations
- 1.4 Data sources
- 1.4.1 Primary
- 1.4.2 Secondary
- 1.4.2.1 Paid sources
- 1.4.2.2 Public sources
Chapter 2 Executive Summary
- 2.1 Industry synopsis, 2021-2034
Chapter 3 Industry Insights
- 3.1 Industry ecosystem analysis
- 3.1.1 Factor affecting the value chain
- 3.1.2 Profit margin analysis
- 3.1.3 Disruptions
- 3.1.4 Future outlook
- 3.1.5 Manufacturers
- 3.1.6 Distributors
- 3.2 Supplier landscape
- 3.3 Profit margin analysis
- 3.4 Key news & initiatives
- 3.5 Regulatory landscape
- 3.6 Impact forces
- 3.6.1 Growth drivers
- 3.6.1.1 Growing adoption of self-service technologies to optimize airport operations
- 3.6.1.2 Increasing passenger demand for efficient check-in processes
- 3.6.1.3 Global expansion of smart airports driving kiosk system deployment
- 3.6.1.4 Implementation of biometric authentication in airport kiosk systems
- 3.6.1.5 Rising demand for cost-effective airport automation solutions
- 3.6.2 Industry pitfalls & challenges
- 3.6.2.1 High initial investment requirements for kiosk system implementation
- 3.6.2.2 Cybersecurity risks associated with passenger data protection
- 3.6.1 Growth drivers
- 3.7 Growth potential analysis
- 3.8 Porter’s analysis
- 3.9 PESTEL analysis
Chapter 4 Competitive Landscape, 2024
- 4.1 Introduction
- 4.2 Company market share analysis
- 4.3 Competitive positioning matrix
- 4.4 Strategic outlook matrix
Chapter 5 Market Estimates & Forecast, By Component, 2021-2034 (USD Million)
- 5.1 Key trends
- 5.2 Hardware
- 5.3 Software
- 5.4 Services
Chapter 6 Market Estimates & Forecast, By Type, 2021-2034 (USD Million)
- 6.1 Key trends
- 6.2 Check-in kiosks
- 6.3 Automated passport control kiosks
- 6.4 Common-use self kiosk
- 6.5 Bag drop kiosks
- 6.6 Retail kiosks
- 6.7 Others
Chapter 7 Market Estimates & Forecast, By Region, 2021-2034 (USD Million)
- 7.1 Key trends
- 7.2 North America
- 7.2.1 U.S.
- 7.2.2 Canada
- 7.3 Europe
- 7.3.1 UK
- 7.3.2 Germany
- 7.3.3 France
- 7.3.4 Italy
- 7.3.5 Spain
- 7.3.6 Russia
- 7.4 Asia Pacific
- 7.4.1 China
- 7.4.2 India
- 7.4.3 Japan
- 7.4.4 South Korea
- 7.4.5 Australia
- 7.5 Latin America
- 7.5.1 Brazil
- 7.5.2 Mexico
- 7.6 MEA
- 7.6.1 South Africa
- 7.6.2 Saudi Arabia
- 7.6.3 UAE
Chapter 8 Company Profiles
- 8.1 Amadeus IT Group SA
- 8.2 Elenium Automation Pty Ltd
- 8.3 Embross Group
- 8.4 Fujitsu Ltd.
- 8.5 IER SAS
- 8.6 Innovative Travel Solutions
- 8.7 KIOSK Information Systems
- 8.8 Marcus Pedersen Ap
- 8.9 Materna IPS GmbH (SITA)
- 8.10 NCR Voyix Corporation
- 8.11 Olea Kiosks Inc.
- 8.12 Phoenix Kiosk, Inc
- 8.13 Rockwell Collins, Inc.
- 8.14 Toshiba Tec Cor

