
|
市場調査レポート
商品コード
1414983
空港キオスク市場:コンポーネント別、用途別、空港規模別:世界の機会分析と産業予測 2023-2032年Airport Kiosk Market By Component, By Application, By Airport Size : Global Opportunity Analysis and Industry Forecast, 2023-2032 |
||||||
|
|||||||

| 空港キオスク市場:コンポーネント別、用途別、空港規模別:世界の機会分析と産業予測 2023-2032年 |
|
出版日: 2023年11月30日
発行: Allied Market Research
ページ情報: 英文 245 Pages
納期: 2~3営業日
|

- 全表示
- 概要
- 図表
- 目次
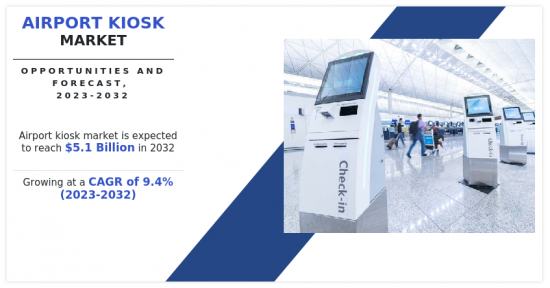
空港キオスク市場は、世界の航空旅客数の増加、新興国市場の空港インフラの改善、旅客体験を向上させるためのタッチスクリーン、マルチメディア、生体認証キオスクの採用増加により、2023年から2032年にかけて9.4%の大幅な成長率を記録する可能性が高いです。
ラテンアメリカでは、経済成長と接続性の向上により、航空旅客数が着実に増加しています。このような旅客数の急増は、効率的で使い勝手の良いサービスへの需要を生み出し、空港キオスクをチェックイン、手荷物取り扱い、その他のプロセスの合理化に不可欠なコンポーネントとして位置づけています。アフリカは、その豊富な自然と文化的アトラクションにより、世界的に観光客の旅行先としての重要性が高まっています。この地域の空港は、国内外からの旅行者の需要に応え、観光セクターの拡大に伴ってよりスムーズな旅行体験を確保するため、空港キオスク端末のようなテクノロジーの導入に注力しています。
目次
第1章 イントロダクション
第2章 エグゼクティブサマリー
第3章 市場概要
- 市場の定義と範囲
- 主な調査結果
- 影響要因
- 主な投資機会
- ポーターのファイブフォース分析
- 市場力学
- 促進要因
- 世界の航空旅客輸送量の増加
- 発展途上国における空港インフラの改善
- 旅客体験を向上させるためのタッチスクリーン、マルチメディア、生体認証キオスクの採用増加
- 抑制要因
- 空港キオスク端末のハードウェア/ソフトウェアにかかる高い開発費と保守費用
- データ漏洩に関するセキュリティとプライバシーへの懸念
- 機会
- 人工知能とデータ分析ツールの活用の増加
- 世界のスマート空港コンセプトの開発により、キオスク端末の導入が促進されます。
- 促進要因
第4章 空港キオスク市場:構成別
- 概要
- ハードウェア
- ソフトウェア
- サービス
第5章 空港キオスク市場:用途別
- 概要
- 自動パスポートコントロール
- 共通セルフサービス(CUSS)キオスク
- インフォメーション・キオスク
- 手荷物チェックイン・キオスク
- 発券キオスク
- その他
第6章 空港キオスク市場:空港規模別
- 概要
- 小規模
- 中規模
- 大
第7章 空港キオスク市場:地域別
- 概要
- 北米
- 米国
- カナダ
- メキシコ
- 欧州
- 英国
- ドイツ
- フランス
- イタリア
- ロシア
- その他
- アジア太平洋
- 中国
- 日本
- インド
- 韓国
- その他
- ラテンアメリカ・中東・アフリカ
- ラテンアメリカ
- 中東
- アフリカ
第8章 競合情勢
- イントロダクション
- 主要成功戦略
- 主要10社の製品マッピング
- 競合ダッシュボード
- 競合ヒートマップ
- 主要企業のポジショニング、2022年
第9章 企業プロファイル
- Amadeus IT Group SA
- Collins Aerospace
- Embross
- Thales Group
- IER
- KIOSK Information Systems, Inc
- Materna IPS GmbH
- NCR VOYIX Corporation
- Olea Kiosks Inc.
- SITA
LIST OF TABLES
- TABLE 01. GLOBAL AIRPORT KIOSK MARKET, BY COMPONENT, 2022-2032 ($MILLION)
- TABLE 02. AIRPORT KIOSK MARKET FOR HARDWARE, BY REGION, 2022-2032 ($MILLION)
- TABLE 03. AIRPORT KIOSK MARKET FOR SOFTWARE, BY REGION, 2022-2032 ($MILLION)
- TABLE 04. AIRPORT KIOSK MARKET FOR SERVICES, BY REGION, 2022-2032 ($MILLION)
- TABLE 05. GLOBAL AIRPORT KIOSK MARKET, BY APPLICATION, 2022-2032 ($MILLION)
- TABLE 06. AIRPORT KIOSK MARKET FOR AUTOMATED PASSPORT CONTROL, BY REGION, 2022-2032 ($MILLION)
- TABLE 07. AIRPORT KIOSK MARKET FOR COMMON-USE SELF SERVICE (CUSS) KIOSK, BY REGION, 2022-2032 ($MILLION)
- TABLE 08. AIRPORT KIOSK MARKET FOR INFORMATION KIOSK, BY REGION, 2022-2032 ($MILLION)
- TABLE 09. AIRPORT KIOSK MARKET FOR BAGGAGE CHECK-IN KIOSK, BY REGION, 2022-2032 ($MILLION)
- TABLE 10. AIRPORT KIOSK MARKET FOR TICKETING KIOSK, BY REGION, 2022-2032 ($MILLION)
- TABLE 11. AIRPORT KIOSK MARKET FOR OTHERS, BY REGION, 2022-2032 ($MILLION)
- TABLE 12. GLOBAL AIRPORT KIOSK MARKET, BY AIRPORT SIZE, 2022-2032 ($MILLION)
- TABLE 13. AIRPORT KIOSK MARKET FOR SMALL, BY REGION, 2022-2032 ($MILLION)
- TABLE 14. AIRPORT KIOSK MARKET FOR MEDIUM, BY REGION, 2022-2032 ($MILLION)
- TABLE 15. AIRPORT KIOSK MARKET FOR LARGE, BY REGION, 2022-2032 ($MILLION)
- TABLE 16. AIRPORT KIOSK MARKET, BY REGION, 2022-2032 ($MILLION)
- TABLE 17. NORTH AMERICA AIRPORT KIOSK MARKET, BY COMPONENT, 2022-2032 ($MILLION)
- TABLE 18. NORTH AMERICA AIRPORT KIOSK MARKET, BY APPLICATION, 2022-2032 ($MILLION)
- TABLE 19. NORTH AMERICA AIRPORT KIOSK MARKET, BY AIRPORT SIZE, 2022-2032 ($MILLION)
- TABLE 20. NORTH AMERICA AIRPORT KIOSK MARKET, BY COUNTRY, 2022-2032 ($MILLION)
- TABLE 21. U.S. AIRPORT KIOSK MARKET, BY COMPONENT, 2022-2032 ($MILLION)
- TABLE 22. U.S. AIRPORT KIOSK MARKET, BY APPLICATION, 2022-2032 ($MILLION)
- TABLE 23. U.S. AIRPORT KIOSK MARKET, BY AIRPORT SIZE, 2022-2032 ($MILLION)
- TABLE 24. CANADA AIRPORT KIOSK MARKET, BY COMPONENT, 2022-2032 ($MILLION)
- TABLE 25. CANADA AIRPORT KIOSK MARKET, BY APPLICATION, 2022-2032 ($MILLION)
- TABLE 26. CANADA AIRPORT KIOSK MARKET, BY AIRPORT SIZE, 2022-2032 ($MILLION)
- TABLE 27. MEXICO AIRPORT KIOSK MARKET, BY COMPONENT, 2022-2032 ($MILLION)
- TABLE 28. MEXICO AIRPORT KIOSK MARKET, BY APPLICATION, 2022-2032 ($MILLION)
- TABLE 29. MEXICO AIRPORT KIOSK MARKET, BY AIRPORT SIZE, 2022-2032 ($MILLION)
- TABLE 30. EUROPE AIRPORT KIOSK MARKET, BY COMPONENT, 2022-2032 ($MILLION)
- TABLE 31. EUROPE AIRPORT KIOSK MARKET, BY APPLICATION, 2022-2032 ($MILLION)
- TABLE 32. EUROPE AIRPORT KIOSK MARKET, BY AIRPORT SIZE, 2022-2032 ($MILLION)
- TABLE 33. EUROPE AIRPORT KIOSK MARKET, BY COUNTRY, 2022-2032 ($MILLION)
- TABLE 34. UK AIRPORT KIOSK MARKET, BY COMPONENT, 2022-2032 ($MILLION)
- TABLE 35. UK AIRPORT KIOSK MARKET, BY APPLICATION, 2022-2032 ($MILLION)
- TABLE 36. UK AIRPORT KIOSK MARKET, BY AIRPORT SIZE, 2022-2032 ($MILLION)
- TABLE 37. GERMANY AIRPORT KIOSK MARKET, BY COMPONENT, 2022-2032 ($MILLION)
- TABLE 38. GERMANY AIRPORT KIOSK MARKET, BY APPLICATION, 2022-2032 ($MILLION)
- TABLE 39. GERMANY AIRPORT KIOSK MARKET, BY AIRPORT SIZE, 2022-2032 ($MILLION)
- TABLE 40. FRANCE AIRPORT KIOSK MARKET, BY COMPONENT, 2022-2032 ($MILLION)
- TABLE 41. FRANCE AIRPORT KIOSK MARKET, BY APPLICATION, 2022-2032 ($MILLION)
- TABLE 42. FRANCE AIRPORT KIOSK MARKET, BY AIRPORT SIZE, 2022-2032 ($MILLION)
- TABLE 43. ITALY AIRPORT KIOSK MARKET, BY COMPONENT, 2022-2032 ($MILLION)
- TABLE 44. ITALY AIRPORT KIOSK MARKET, BY APPLICATION, 2022-2032 ($MILLION)
- TABLE 45. ITALY AIRPORT KIOSK MARKET, BY AIRPORT SIZE, 2022-2032 ($MILLION)
- TABLE 46. RUSSIA AIRPORT KIOSK MARKET, BY COMPONENT, 2022-2032 ($MILLION)
- TABLE 47. RUSSIA AIRPORT KIOSK MARKET, BY APPLICATION, 2022-2032 ($MILLION)
- TABLE 48. RUSSIA AIRPORT KIOSK MARKET, BY AIRPORT SIZE, 2022-2032 ($MILLION)
- TABLE 49. REST OF EUROPE AIRPORT KIOSK MARKET, BY COMPONENT, 2022-2032 ($MILLION)
- TABLE 50. REST OF EUROPE AIRPORT KIOSK MARKET, BY APPLICATION, 2022-2032 ($MILLION)
- TABLE 51. REST OF EUROPE AIRPORT KIOSK MARKET, BY AIRPORT SIZE, 2022-2032 ($MILLION)
- TABLE 52. ASIA-PACIFIC AIRPORT KIOSK MARKET, BY COMPONENT, 2022-2032 ($MILLION)
- TABLE 53. ASIA-PACIFIC AIRPORT KIOSK MARKET, BY APPLICATION, 2022-2032 ($MILLION)
- TABLE 54. ASIA-PACIFIC AIRPORT KIOSK MARKET, BY AIRPORT SIZE, 2022-2032 ($MILLION)
- TABLE 55. ASIA-PACIFIC AIRPORT KIOSK MARKET, BY COUNTRY, 2022-2032 ($MILLION)
- TABLE 56. CHINA AIRPORT KIOSK MARKET, BY COMPONENT, 2022-2032 ($MILLION)
- TABLE 57. CHINA AIRPORT KIOSK MARKET, BY APPLICATION, 2022-2032 ($MILLION)
- TABLE 58. CHINA AIRPORT KIOSK MARKET, BY AIRPORT SIZE, 2022-2032 ($MILLION)
- TABLE 59. JAPAN AIRPORT KIOSK MARKET, BY COMPONENT, 2022-2032 ($MILLION)
- TABLE 60. JAPAN AIRPORT KIOSK MARKET, BY APPLICATION, 2022-2032 ($MILLION)
- TABLE 61. JAPAN AIRPORT KIOSK MARKET, BY AIRPORT SIZE, 2022-2032 ($MILLION)
- TABLE 62. INDIA AIRPORT KIOSK MARKET, BY COMPONENT, 2022-2032 ($MILLION)
- TABLE 63. INDIA AIRPORT KIOSK MARKET, BY APPLICATION, 2022-2032 ($MILLION)
- TABLE 64. INDIA AIRPORT KIOSK MARKET, BY AIRPORT SIZE, 2022-2032 ($MILLION)
- TABLE 65. SOUTH KOREA AIRPORT KIOSK MARKET, BY COMPONENT, 2022-2032 ($MILLION)
- TABLE 66. SOUTH KOREA AIRPORT KIOSK MARKET, BY APPLICATION, 2022-2032 ($MILLION)
- TABLE 67. SOUTH KOREA AIRPORT KIOSK MARKET, BY AIRPORT SIZE, 2022-2032 ($MILLION)
- TABLE 68. REST OF ASIA-PACIFIC AIRPORT KIOSK MARKET, BY COMPONENT, 2022-2032 ($MILLION)
- TABLE 69. REST OF ASIA-PACIFIC AIRPORT KIOSK MARKET, BY APPLICATION, 2022-2032 ($MILLION)
- TABLE 70. REST OF ASIA-PACIFIC AIRPORT KIOSK MARKET, BY AIRPORT SIZE, 2022-2032 ($MILLION)
- TABLE 71. LAMEA AIRPORT KIOSK MARKET, BY COMPONENT, 2022-2032 ($MILLION)
- TABLE 72. LAMEA AIRPORT KIOSK MARKET, BY APPLICATION, 2022-2032 ($MILLION)
- TABLE 73. LAMEA AIRPORT KIOSK MARKET, BY AIRPORT SIZE, 2022-2032 ($MILLION)
- TABLE 74. LAMEA AIRPORT KIOSK MARKET, BY COUNTRY, 2022-2032 ($MILLION)
- TABLE 75. LATIN AMERICA AIRPORT KIOSK MARKET, BY COMPONENT, 2022-2032 ($MILLION)
- TABLE 76. LATIN AMERICA AIRPORT KIOSK MARKET, BY APPLICATION, 2022-2032 ($MILLION)
- TABLE 77. LATIN AMERICA AIRPORT KIOSK MARKET, BY AIRPORT SIZE, 2022-2032 ($MILLION)
- TABLE 78. MIDDLE EAST AIRPORT KIOSK MARKET, BY COMPONENT, 2022-2032 ($MILLION)
- TABLE 79. MIDDLE EAST AIRPORT KIOSK MARKET, BY APPLICATION, 2022-2032 ($MILLION)
- TABLE 80. MIDDLE EAST AIRPORT KIOSK MARKET, BY AIRPORT SIZE, 2022-2032 ($MILLION)
- TABLE 81. AFRICA AIRPORT KIOSK MARKET, BY COMPONENT, 2022-2032 ($MILLION)
- TABLE 82. AFRICA AIRPORT KIOSK MARKET, BY APPLICATION, 2022-2032 ($MILLION)
- TABLE 83. AFRICA AIRPORT KIOSK MARKET, BY AIRPORT SIZE, 2022-2032 ($MILLION)
- TABLE 84. AMADEUS IT GROUP SA: KEY EXECUTIVES
- TABLE 85. AMADEUS IT GROUP SA: COMPANY SNAPSHOT
- TABLE 86. AMADEUS IT GROUP SA: PRODUCT SEGMENTS
- TABLE 87. AMADEUS IT GROUP SA: PRODUCT PORTFOLIO
- TABLE 88. AMADEUS IT GROUP SA: KEY STRATERGIES
- TABLE 89. COLLINS AEROSPACE: KEY EXECUTIVES
- TABLE 90. COLLINS AEROSPACE: COMPANY SNAPSHOT
- TABLE 91. COLLINS AEROSPACE: PRODUCT SEGMENTS
- TABLE 92. COLLINS AEROSPACE: PRODUCT PORTFOLIO
- TABLE 93. COLLINS AEROSPACE: KEY STRATERGIES
- TABLE 94. EMBROSS: KEY EXECUTIVES
- TABLE 95. EMBROSS: COMPANY SNAPSHOT
- TABLE 96. EMBROSS: PRODUCT SEGMENTS
- TABLE 97. EMBROSS: PRODUCT PORTFOLIO
- TABLE 98. EMBROSS: KEY STRATERGIES
- TABLE 99. THALES GROUP: KEY EXECUTIVES
- TABLE 100. THALES GROUP: COMPANY SNAPSHOT
- TABLE 101. THALES GROUP: PRODUCT SEGMENTS
- TABLE 102. THALES GROUP: PRODUCT PORTFOLIO
- TABLE 103. THALES GROUP: KEY STRATERGIES
- TABLE 104. IER: KEY EXECUTIVES
- TABLE 105. IER: COMPANY SNAPSHOT
- TABLE 106. IER: PRODUCT SEGMENTS
- TABLE 107. IER: PRODUCT PORTFOLIO
- TABLE 108. IER: KEY STRATERGIES
- TABLE 109. KIOSK INFORMATION SYSTEMS, INC: KEY EXECUTIVES
- TABLE 110. KIOSK INFORMATION SYSTEMS, INC: COMPANY SNAPSHOT
- TABLE 111. KIOSK INFORMATION SYSTEMS, INC: PRODUCT SEGMENTS
- TABLE 112. KIOSK INFORMATION SYSTEMS, INC: PRODUCT PORTFOLIO
- TABLE 113. KIOSK INFORMATION SYSTEMS, INC: KEY STRATERGIES
- TABLE 114. MATERNA IPS GMBH: KEY EXECUTIVES
- TABLE 115. MATERNA IPS GMBH: COMPANY SNAPSHOT
- TABLE 116. MATERNA IPS GMBH: PRODUCT SEGMENTS
- TABLE 117. MATERNA IPS GMBH: PRODUCT PORTFOLIO
- TABLE 118. MATERNA IPS GMBH: KEY STRATERGIES
- TABLE 119. NCR VOYIX CORPORATION: KEY EXECUTIVES
- TABLE 120. NCR VOYIX CORPORATION: COMPANY SNAPSHOT
- TABLE 121. NCR VOYIX CORPORATION: SERVICE SEGMENTS
- TABLE 122. NCR VOYIX CORPORATION: PRODUCT PORTFOLIO
- TABLE 123. NCR VOYIX CORPORATION: KEY STRATERGIES
- TABLE 124. OLEA KIOSKS INC.: KEY EXECUTIVES
- TABLE 125. OLEA KIOSKS INC.: COMPANY SNAPSHOT
- TABLE 126. OLEA KIOSKS INC.: PRODUCT SEGMENTS
- TABLE 127. OLEA KIOSKS INC.: PRODUCT PORTFOLIO
- TABLE 128. OLEA KIOSKS INC.: KEY STRATERGIES
- TABLE 129. SITA: KEY EXECUTIVES
- TABLE 130. SITA: COMPANY SNAPSHOT
- TABLE 131. SITA: SERVICE SEGMENTS
- TABLE 132. SITA: PRODUCT PORTFOLIO
- TABLE 133. SITA: KEY STRATERGIES
LIST OF FIGURES
- FIGURE 01. AIRPORT KIOSK MARKET, 2022-2032
- FIGURE 02. SEGMENTATION OF AIRPORT KIOSK MARKET,2022-2032
- FIGURE 03. TOP IMPACTING FACTORS IN AIRPORT KIOSK MARKET (2022 TO 2032)
- FIGURE 04. TOP INVESTMENT POCKETS IN AIRPORT KIOSK MARKET (2023-2032)
- FIGURE 05. MODERATE TO HIGH BARGAINING POWER OF SUPPLIERS
- FIGURE 06. MODERATE TO HIGH THREAT OF NEW ENTRANTS
- FIGURE 07. MODERATE THREAT OF SUBSTITUTES
- FIGURE 08. MODERATE TO HIGH INTENSITY OF RIVALRY
- FIGURE 09. MODERATE TO HIGH BARGAINING POWER OF BUYERS
- FIGURE 10. GLOBAL AIRPORT KIOSK MARKET:DRIVERS, RESTRAINTS AND OPPORTUNITIES
- FIGURE 11. AIRPORT KIOSK MARKET, BY COMPONENT, 2022 AND 2032(%)
- FIGURE 12. COMPARATIVE SHARE ANALYSIS OF AIRPORT KIOSK MARKET FOR HARDWARE, BY COUNTRY 2022 AND 2032(%)
- FIGURE 13. COMPARATIVE SHARE ANALYSIS OF AIRPORT KIOSK MARKET FOR SOFTWARE, BY COUNTRY 2022 AND 2032(%)
- FIGURE 14. COMPARATIVE SHARE ANALYSIS OF AIRPORT KIOSK MARKET FOR SERVICES, BY COUNTRY 2022 AND 2032(%)
- FIGURE 15. AIRPORT KIOSK MARKET, BY APPLICATION, 2022 AND 2032(%)
- FIGURE 16. COMPARATIVE SHARE ANALYSIS OF AIRPORT KIOSK MARKET FOR AUTOMATED PASSPORT CONTROL, BY COUNTRY 2022 AND 2032(%)
- FIGURE 17. COMPARATIVE SHARE ANALYSIS OF AIRPORT KIOSK MARKET FOR COMMON-USE SELF SERVICE (CUSS) KIOSK, BY COUNTRY 2022 AND 2032(%)
- FIGURE 18. COMPARATIVE SHARE ANALYSIS OF AIRPORT KIOSK MARKET FOR INFORMATION KIOSK, BY COUNTRY 2022 AND 2032(%)
- FIGURE 19. COMPARATIVE SHARE ANALYSIS OF AIRPORT KIOSK MARKET FOR BAGGAGE CHECK-IN KIOSK, BY COUNTRY 2022 AND 2032(%)
- FIGURE 20. COMPARATIVE SHARE ANALYSIS OF AIRPORT KIOSK MARKET FOR TICKETING KIOSK, BY COUNTRY 2022 AND 2032(%)
- FIGURE 21. COMPARATIVE SHARE ANALYSIS OF AIRPORT KIOSK MARKET FOR OTHERS, BY COUNTRY 2022 AND 2032(%)
- FIGURE 22. AIRPORT KIOSK MARKET, BY AIRPORT SIZE, 2022 AND 2032(%)
- FIGURE 23. COMPARATIVE SHARE ANALYSIS OF AIRPORT KIOSK MARKET FOR SMALL, BY COUNTRY 2022 AND 2032(%)
- FIGURE 24. COMPARATIVE SHARE ANALYSIS OF AIRPORT KIOSK MARKET FOR MEDIUM, BY COUNTRY 2022 AND 2032(%)
- FIGURE 25. COMPARATIVE SHARE ANALYSIS OF AIRPORT KIOSK MARKET FOR LARGE, BY COUNTRY 2022 AND 2032(%)
- FIGURE 26. AIRPORT KIOSK MARKET BY REGION, 2022 AND 2032(%)
- FIGURE 27. U.S. AIRPORT KIOSK MARKET, 2022-2032 ($MILLION)
- FIGURE 28. CANADA AIRPORT KIOSK MARKET, 2022-2032 ($MILLION)
- FIGURE 29. MEXICO AIRPORT KIOSK MARKET, 2022-2032 ($MILLION)
- FIGURE 30. UK AIRPORT KIOSK MARKET, 2022-2032 ($MILLION)
- FIGURE 31. GERMANY AIRPORT KIOSK MARKET, 2022-2032 ($MILLION)
- FIGURE 32. FRANCE AIRPORT KIOSK MARKET, 2022-2032 ($MILLION)
- FIGURE 33. ITALY AIRPORT KIOSK MARKET, 2022-2032 ($MILLION)
- FIGURE 34. RUSSIA AIRPORT KIOSK MARKET, 2022-2032 ($MILLION)
- FIGURE 35. REST OF EUROPE AIRPORT KIOSK MARKET, 2022-2032 ($MILLION)
- FIGURE 36. CHINA AIRPORT KIOSK MARKET, 2022-2032 ($MILLION)
- FIGURE 37. JAPAN AIRPORT KIOSK MARKET, 2022-2032 ($MILLION)
- FIGURE 38. INDIA AIRPORT KIOSK MARKET, 2022-2032 ($MILLION)
- FIGURE 39. SOUTH KOREA AIRPORT KIOSK MARKET, 2022-2032 ($MILLION)
- FIGURE 40. REST OF ASIA-PACIFIC AIRPORT KIOSK MARKET, 2022-2032 ($MILLION)
- FIGURE 41. LATIN AMERICA AIRPORT KIOSK MARKET, 2022-2032 ($MILLION)
- FIGURE 42. MIDDLE EAST AIRPORT KIOSK MARKET, 2022-2032 ($MILLION)
- FIGURE 43. AFRICA AIRPORT KIOSK MARKET, 2022-2032 ($MILLION)
- FIGURE 44. TOP WINNING STRATEGIES, BY YEAR (2020-2023)
- FIGURE 45. TOP WINNING STRATEGIES, BY DEVELOPMENT (2020-2023)
- FIGURE 46. TOP WINNING STRATEGIES, BY COMPANY (2020-2023)
- FIGURE 47. PRODUCT MAPPING OF TOP 10 PLAYERS
- FIGURE 48. COMPETITIVE DASHBOARD
- FIGURE 49. COMPETITIVE HEATMAP: AIRPORT KIOSK MARKET
- FIGURE 50. TOP PLAYER POSITIONING, 2022
- FIGURE 51. AMADEUS IT GROUP SA: NET REVENUE, 2020-2022 ($MILLION)
- FIGURE 52. AMADEUS IT GROUP SA: RESEARCH & DEVELOPMENT EXPENDITURE, 2020-2022 ($MILLION)
- FIGURE 53. AMADEUS IT GROUP SA: REVENUE SHARE BY SEGMENT, 2022 (%)
- FIGURE 54. AMADEUS IT GROUP SA: REVENUE SHARE BY REGION, 2022 (%)
- FIGURE 55. COLLINS AEROSPACE: NET REVENUE, 2020-2022 ($MILLION)
- FIGURE 56. COLLINS AEROSPACE: RESEARCH & DEVELOPMENT EXPENDITURE, 2020-2022 ($MILLION)
- FIGURE 57. COLLINS AEROSPACE: REVENUE SHARE BY SEGMENT, 2022 (%)
- FIGURE 58. COLLINS AEROSPACE: REVENUE SHARE BY REGION, 2022 (%)
- FIGURE 59. THALES GROUP: NET SALES, 2020-2022 ($MILLION)
- FIGURE 60. THALES GROUP: RESEARCH & DEVELOPMENT EXPENDITURE, 2020-2022 ($MILLION)
- FIGURE 61. THALES GROUP: REVENUE SHARE BY SEGMENT, 2022 (%)
- FIGURE 62. THALES GROUP: REVENUE SHARE BY REGION, 2022 (%)
- FIGURE 63. IER: NET REVENUE, 2020-2022 ($MILLION)
- FIGURE 64. IER: REVENUE SHARE BY SEGMENT, 2022 (%)
- FIGURE 65. IER: REVENUE SHARE BY REGION, 2022 (%)
- FIGURE 66. KIOSK INFORMATION SYSTEMS, INC: NET REVENUE, 2020-2022 ($MILLION)
- FIGURE 67. KIOSK INFORMATION SYSTEMS, INC: RESEARCH & DEVELOPMENT EXPENDITURE, 2020-2022 ($MILLION)
- FIGURE 68. KIOSK INFORMATION SYSTEMS, INC: REVENUE SHARE BY SEGMENT, 2022 (%)
- FIGURE 69. KIOSK INFORMATION SYSTEMS, INC: REVENUE SHARE BY REGION, 2022 (%)
- FIGURE 70. NCR VOYIX CORPORATION: NET REVENUE, 2020-2022 ($MILLION)
- FIGURE 71. NCR VOYIX CORPORATION: RESEARCH & DEVELOPMENT EXPENDITURE, 2020-2022 ($MILLION)
- FIGURE 72. NCR VOYIX CORPORATION: REVENUE SHARE BY SEGMENT, 2022 (%)
- FIGURE 73. NCR VOYIX CORPORATION: REVENUE SHARE BY REGION, 2022 (%)
"The Airport Kiosk Market is likely to experience a significant growth rate of 9.4% from 2023-2032 owing to increase in air passenger traffic globally, improvement in airport infrastructure in developing nations, and increased adoption of touchscreen, multimedia, and biometric kiosks to enhance passenger experience." - Allied Market Research.
Latin America is witnessing a steady increase in air travel, driven by economic growth and improved connectivity. This surge in passenger traffic creates a demand for efficient and user-friendly services, positioning airport kiosks as essential components in streamlining check-in, baggage handling, and other processes. Africa is growing in importance as a travel destination for tourists globally owing to its abundance of natural and cultural attractions. Airports in the area are focusing on implementing technologies like airport kiosks to meet the demands of both domestic and foreign travelers and ensure a smoother travel experience as the tourism sector expands.
The Middle East's strategic position at the crossroads of Asia-Pacific, Africa, and Europe has transformed it into a major international hub. Therefore, it attracts major international passengers, which further necessitates the expansion of the airports and their handling capacity. For instance, in October 2023, Sharjah International Airport implemented a range of automated processes to enhance the travel experience for passengers. From check-in to baggage drop, passport control, and boarding, passengers can independently manage these tasks with the self-service options at the airport. Self-check-in kiosks are accessible at the airport, which allow passengers to scan their passports or enter their passenger name record (PNR). In addition, passengers can print their bag tags using the self-check-in kiosks, streamlining the process, and offering greater convenience. Moreover, airports in countries like Brazil and Colombia are increasingly implementing innovative kiosks to improve operational efficiency and enhance passenger services. Therefore, major investments in greenfield and brownfield airports with a focus on enabling next-generation airport kiosks present a great opportunity for LAMEA.
In addition, the growth of the software segment is driven by increasing integration of kiosk management software, device monitoring tools, and analytics dashboards to maintain systems availability and coordinate central management of units dispersed airport wide.
Moreover, India is a rapidly growing market with airports like Indira Gandhi International Airport and Chhatrapati Shivaji International Airport leading in advanced technology adoption. Biometrics, self-check-in kiosks, and automation are being utilized to accommodate increasing passenger numbers. For instance, in September 2020, Mumbai based Chhatrapati Shivaji Maharaj International Airport implemented approximately 50 mobile-enabled kiosks from SITA, which offer fully contactless check-in options for passengers in India. In Terminal 2, travelers may utilize their mobile phones or tablets to scan a QR code, enabling them to operate the kiosks. Following the QR code scan, passengers may use their mobile devices as trackpads to control check-in and self-bag drop kiosks, facilitating the printing of boarding passes and bag tags in a contactless manner. Such developments across the Asia-Pacific region are anticipated to support the growth of the market.
The airport kiosk market has been segmented on the basis of component, airport size, application, and region. By component, the market is segmented into hardware, software, and services. As per airport size, the market is divided into small, medium, and large. According to application, the market is segmented into check-in kiosk, automated passport control, common-use self-service (CUSS) kiosks, information, baggage check, ticketing kiosk, and others. Region-wise, the market is studied across North America, Europe, Asia-Pacific, and LAMEA.
Some major companies operating in the market include: Amadeus IT Group SA, Collins Aerospace, Embross, Thales Group, IER, Kiosk Information Systems Inc., Materna IPS GmbH, NCR Corporation, Olea Kiosks Inc., and SITA.
Key Benefits For Stakeholders
- This report provides a quantitative analysis of the market segments, current trends, estimations, and dynamics of the airport kiosk market analysis from 2022 to 2032 to identify the prevailing airport kiosk market opportunities.
- The market research is offered along with information related to key drivers, restraints, and opportunities.
- Porter's five forces analysis highlights the potency of buyers and suppliers to enable stakeholders make profit-oriented business decisions and strengthen their supplier-buyer network.
- In-depth analysis of the airport kiosk market segmentation assists to determine the prevailing market opportunities.
- Major countries in each region are mapped according to their revenue contribution to the global market.
- Market player positioning facilitates benchmarking and provides a clear understanding of the present position of the market players.
- The report includes the analysis of the regional as well as global airport kiosk market trends, key players, market segments, application areas, and market growth strategies.
Additional benefits you will get with this purchase are:
- Quarterly Update and* (only available with a corporate license, on listed price)
- 5 additional Company Profile of client Choice pre- or Post-purchase, as a free update.
- Free Upcoming Version on the Purchase of Five and Enterprise User License.
- 16 analyst hours of support* (post-purchase, if you find additional data requirements upon review of the report, you may receive support amounting to 16 analyst hours to solve questions, and post-sale queries)
- 15% Free Customization* (in case the scope or segment of the report does not match your requirements, 15% is equivalent to 3 working days of free work, applicable once)
- Free data Pack on the Five and Enterprise User License. (Excel version of the report)
- Free Updated report if the report is 6-12 months old or older.
- 24-hour priority response*
- Free Industry updates and white papers.
Possible Customization with this report (with additional cost and timeline, please talk to the sales executive to know more)
- Additional company profiles with specific to client's interest
- Additional country or region analysis- market size and forecast
- Expanded list for Company Profiles
- SWOT Analysis
Key Market Segments
By Component
- Services
- Hardware
- Software
By Application
- Automated Passport Control
- Common-use Self Service (CUSS) Kiosk
- Information Kiosk
- Baggage Check-In Kiosk
- Ticketing Kiosk
- Others
By Airport Size
- Small
- Medium
- Large
By Region
- North America
- U.S.
- Canada
- Mexico
- Europe
- UK
- Germany
- France
- Italy
- Russia
- Rest of Europe
- Asia-Pacific
- China
- Japan
- India
- South Korea
- Rest of Asia-Pacific
- LAMEA
- Latin America
- Middle East
- Africa
Key Market Players:
- Amadeus IT Group SA
- Collins Aerospace
- Embross
- IER
- Materna IPS GmbH
- SITA
- Thales Group
- NCR VOYIX Corporation
- KIOSK Information Systems, Inc
- Olea Kiosks Inc.
TABLE OF CONTENTS
CHAPTER 1: INTRODUCTION
- 1.1. Report description
- 1.2. Key market segments
- 1.3. Key benefits to the stakeholders
- 1.4. Research methodology
- 1.4.1. Primary research
- 1.4.2. Secondary research
- 1.4.3. Analyst tools and models
CHAPTER 2: EXECUTIVE SUMMARY
- 2.1. CXO Perspective
CHAPTER 3: MARKET OVERVIEW
- 3.1. Market definition and scope
- 3.2. Key findings
- 3.2.1. Top impacting factors
- 3.2.2. Top investment pockets
- 3.3. Porter's five forces analysis
- 3.3.1. Moderate to high bargaining power of suppliers
- 3.3.2. Moderate to high threat of new entrants
- 3.3.3. Moderate threat of substitutes
- 3.3.4. Moderate to high intensity of rivalry
- 3.3.5. Moderate to high bargaining power of buyers
- 3.4. Market dynamics
- 3.4.1. Drivers
- 3.4.1.1. Increase in air passenger traffic globally
- 3.4.1.2. Improvement in airport infrastructure in developing nations
- 3.4.1.3. Increased adoption of touchscreen, multimedia, and biometric kiosks to enhance passenger experience
- 3.4.2. Restraints
- 3.4.2.1. High development and maintenance costs involved in airport kiosk hardware/software
- 3.4.2.2. Security and privacy concerns related to data breaches
- 3.4.3. Opportunities
- 3.4.3.1. The rise in utilization of artificial intelligence and data analytics tools
- 3.4.3.2. Development of smart airport concepts globally provides an avenue for better kiosk adoption
- 3.4.1. Drivers
CHAPTER 4: AIRPORT KIOSK MARKET, BY COMPONENT
- 4.1. Overview
- 4.1.1. Market size and forecast
- 4.2. Hardware
- 4.2.1. Key market trends, growth factors and opportunities
- 4.2.2. Market size and forecast, by region
- 4.2.3. Market share analysis by country
- 4.3. Software
- 4.3.1. Key market trends, growth factors and opportunities
- 4.3.2. Market size and forecast, by region
- 4.3.3. Market share analysis by country
- 4.4. Services
- 4.4.1. Key market trends, growth factors and opportunities
- 4.4.2. Market size and forecast, by region
- 4.4.3. Market share analysis by country
CHAPTER 5: AIRPORT KIOSK MARKET, BY APPLICATION
- 5.1. Overview
- 5.1.1. Market size and forecast
- 5.2. Automated Passport Control
- 5.2.1. Key market trends, growth factors and opportunities
- 5.2.2. Market size and forecast, by region
- 5.2.3. Market share analysis by country
- 5.3. Common-use Self Service (CUSS) Kiosk
- 5.3.1. Key market trends, growth factors and opportunities
- 5.3.2. Market size and forecast, by region
- 5.3.3. Market share analysis by country
- 5.4. Information Kiosk
- 5.4.1. Key market trends, growth factors and opportunities
- 5.4.2. Market size and forecast, by region
- 5.4.3. Market share analysis by country
- 5.5. Baggage Check-In Kiosk
- 5.5.1. Key market trends, growth factors and opportunities
- 5.5.2. Market size and forecast, by region
- 5.5.3. Market share analysis by country
- 5.6. Ticketing Kiosk
- 5.6.1. Key market trends, growth factors and opportunities
- 5.6.2. Market size and forecast, by region
- 5.6.3. Market share analysis by country
- 5.7. Others
- 5.7.1. Key market trends, growth factors and opportunities
- 5.7.2. Market size and forecast, by region
- 5.7.3. Market share analysis by country
CHAPTER 6: AIRPORT KIOSK MARKET, BY AIRPORT SIZE
- 6.1. Overview
- 6.1.1. Market size and forecast
- 6.2. Small
- 6.2.1. Key market trends, growth factors and opportunities
- 6.2.2. Market size and forecast, by region
- 6.2.3. Market share analysis by country
- 6.3. Medium
- 6.3.1. Key market trends, growth factors and opportunities
- 6.3.2. Market size and forecast, by region
- 6.3.3. Market share analysis by country
- 6.4. Large
- 6.4.1. Key market trends, growth factors and opportunities
- 6.4.2. Market size and forecast, by region
- 6.4.3. Market share analysis by country
CHAPTER 7: AIRPORT KIOSK MARKET, BY REGION
- 7.1. Overview
- 7.1.1. Market size and forecast By Region
- 7.2. North America
- 7.2.1. Key market trends, growth factors and opportunities
- 7.2.2. Market size and forecast, by Component
- 7.2.3. Market size and forecast, by Application
- 7.2.4. Market size and forecast, by Airport Size
- 7.2.5. Market size and forecast, by country
- 7.2.5.1. U.S.
- 7.2.5.1.1. Market size and forecast, by Component
- 7.2.5.1.2. Market size and forecast, by Application
- 7.2.5.1.3. Market size and forecast, by Airport Size
- 7.2.5.2. Canada
- 7.2.5.2.1. Market size and forecast, by Component
- 7.2.5.2.2. Market size and forecast, by Application
- 7.2.5.2.3. Market size and forecast, by Airport Size
- 7.2.5.3. Mexico
- 7.2.5.3.1. Market size and forecast, by Component
- 7.2.5.3.2. Market size and forecast, by Application
- 7.2.5.3.3. Market size and forecast, by Airport Size
- 7.3. Europe
- 7.3.1. Key market trends, growth factors and opportunities
- 7.3.2. Market size and forecast, by Component
- 7.3.3. Market size and forecast, by Application
- 7.3.4. Market size and forecast, by Airport Size
- 7.3.5. Market size and forecast, by country
- 7.3.5.1. UK
- 7.3.5.1.1. Market size and forecast, by Component
- 7.3.5.1.2. Market size and forecast, by Application
- 7.3.5.1.3. Market size and forecast, by Airport Size
- 7.3.5.2. Germany
- 7.3.5.2.1. Market size and forecast, by Component
- 7.3.5.2.2. Market size and forecast, by Application
- 7.3.5.2.3. Market size and forecast, by Airport Size
- 7.3.5.3. France
- 7.3.5.3.1. Market size and forecast, by Component
- 7.3.5.3.2. Market size and forecast, by Application
- 7.3.5.3.3. Market size and forecast, by Airport Size
- 7.3.5.4. Italy
- 7.3.5.4.1. Market size and forecast, by Component
- 7.3.5.4.2. Market size and forecast, by Application
- 7.3.5.4.3. Market size and forecast, by Airport Size
- 7.3.5.5. Russia
- 7.3.5.5.1. Market size and forecast, by Component
- 7.3.5.5.2. Market size and forecast, by Application
- 7.3.5.5.3. Market size and forecast, by Airport Size
- 7.3.5.6. Rest of Europe
- 7.3.5.6.1. Market size and forecast, by Component
- 7.3.5.6.2. Market size and forecast, by Application
- 7.3.5.6.3. Market size and forecast, by Airport Size
- 7.4. Asia-Pacific
- 7.4.1. Key market trends, growth factors and opportunities
- 7.4.2. Market size and forecast, by Component
- 7.4.3. Market size and forecast, by Application
- 7.4.4. Market size and forecast, by Airport Size
- 7.4.5. Market size and forecast, by country
- 7.4.5.1. China
- 7.4.5.1.1. Market size and forecast, by Component
- 7.4.5.1.2. Market size and forecast, by Application
- 7.4.5.1.3. Market size and forecast, by Airport Size
- 7.4.5.2. Japan
- 7.4.5.2.1. Market size and forecast, by Component
- 7.4.5.2.2. Market size and forecast, by Application
- 7.4.5.2.3. Market size and forecast, by Airport Size
- 7.4.5.3. India
- 7.4.5.3.1. Market size and forecast, by Component
- 7.4.5.3.2. Market size and forecast, by Application
- 7.4.5.3.3. Market size and forecast, by Airport Size
- 7.4.5.4. South Korea
- 7.4.5.4.1. Market size and forecast, by Component
- 7.4.5.4.2. Market size and forecast, by Application
- 7.4.5.4.3. Market size and forecast, by Airport Size
- 7.4.5.5. Rest of Asia-Pacific
- 7.4.5.5.1. Market size and forecast, by Component
- 7.4.5.5.2. Market size and forecast, by Application
- 7.4.5.5.3. Market size and forecast, by Airport Size
- 7.5. LAMEA
- 7.5.1. Key market trends, growth factors and opportunities
- 7.5.2. Market size and forecast, by Component
- 7.5.3. Market size and forecast, by Application
- 7.5.4. Market size and forecast, by Airport Size
- 7.5.5. Market size and forecast, by country
- 7.5.5.1. Latin America
- 7.5.5.1.1. Market size and forecast, by Component
- 7.5.5.1.2. Market size and forecast, by Application
- 7.5.5.1.3. Market size and forecast, by Airport Size
- 7.5.5.2. Middle East
- 7.5.5.2.1. Market size and forecast, by Component
- 7.5.5.2.2. Market size and forecast, by Application
- 7.5.5.2.3. Market size and forecast, by Airport Size
- 7.5.5.3. Africa
- 7.5.5.3.1. Market size and forecast, by Component
- 7.5.5.3.2. Market size and forecast, by Application
- 7.5.5.3.3. Market size and forecast, by Airport Size
CHAPTER 8: COMPETITIVE LANDSCAPE
- 8.1. Introduction
- 8.2. Top winning strategies
- 8.3. Product mapping of top 10 player
- 8.4. Competitive dashboard
- 8.5. Competitive heatmap
- 8.6. Top player positioning, 2022
CHAPTER 9: COMPANY PROFILES
- 9.1. Amadeus IT Group SA
- 9.1.1. Company overview
- 9.1.2. Key executives
- 9.1.3. Company snapshot
- 9.1.4. Operating business segments
- 9.1.5. Product portfolio
- 9.1.6. Business performance
- 9.1.7. Key strategic moves and developments
- 9.2. Collins Aerospace
- 9.2.1. Company overview
- 9.2.2. Key executives
- 9.2.3. Company snapshot
- 9.2.4. Operating business segments
- 9.2.5. Product portfolio
- 9.2.6. Business performance
- 9.2.7. Key strategic moves and developments
- 9.3. Embross
- 9.3.1. Company overview
- 9.3.2. Key executives
- 9.3.3. Company snapshot
- 9.3.4. Operating business segments
- 9.3.5. Product portfolio
- 9.3.6. Key strategic moves and developments
- 9.4. Thales Group
- 9.4.1. Company overview
- 9.4.2. Key executives
- 9.4.3. Company snapshot
- 9.4.4. Operating business segments
- 9.4.5. Product portfolio
- 9.4.6. Business performance
- 9.4.7. Key strategic moves and developments
- 9.5. IER
- 9.5.1. Company overview
- 9.5.2. Key executives
- 9.5.3. Company snapshot
- 9.5.4. Operating business segments
- 9.5.5. Product portfolio
- 9.5.6. Business performance
- 9.5.7. Key strategic moves and developments
- 9.6. KIOSK Information Systems, Inc
- 9.6.1. Company overview
- 9.6.2. Key executives
- 9.6.3. Company snapshot
- 9.6.4. Operating business segments
- 9.6.5. Product portfolio
- 9.6.6. Business performance
- 9.6.7. Key strategic moves and developments
- 9.7. Materna IPS GmbH
- 9.7.1. Company overview
- 9.7.2. Key executives
- 9.7.3. Company snapshot
- 9.7.4. Operating business segments
- 9.7.5. Product portfolio
- 9.7.6. Key strategic moves and developments
- 9.8. NCR VOYIX Corporation
- 9.8.1. Company overview
- 9.8.2. Key executives
- 9.8.3. Company snapshot
- 9.8.4. Operating business segments
- 9.8.5. Product portfolio
- 9.8.6. Business performance
- 9.8.7. Key strategic moves and developments
- 9.9. Olea Kiosks Inc.
- 9.9.1. Company overview
- 9.9.2. Key executives
- 9.9.3. Company snapshot
- 9.9.4. Operating business segments
- 9.9.5. Product portfolio
- 9.9.6. Key strategic moves and developments
- 9.10. SITA
- 9.10.1. Company overview
- 9.10.2. Key executives
- 9.10.3. Company snapshot
- 9.10.4. Operating business segments
- 9.10.5. Product portfolio
- 9.10.6. Key strategic moves and developments
