|
|
市場調査レポート
商品コード
1502135
加工野菜の世界市場 2024-2028Global processed vegetable market 2024-2028 |
||||||
|
|||||||
カスタマイズ可能
|
|||||||


| 加工野菜の世界市場 2024-2028 |
|
出版日: 2024年05月22日
発行: TechNavio
ページ情報: 英文 180 Pages
納期: 即納可能
|

全表示
- 概要
- 図表
- 目次
Technavio社は、加工野菜市場をモニターしており、2023年から2028年にかけて899億米ドル、予測期間中のCAGRは11.04%で成長すると予測しています。
当レポートでは、加工野菜市場の全体的な分析、市場規模・予測、動向、成長促進要因、課題、約25のベンダーを網羅したベンダー分析などを掲載しています。
現在の市場シナリオ、最新動向と促進要因、市場環境全体に関する最新分析を提供しています。市場は、加工野菜に対する需要の増加、加工野菜メーカーと小売業者間の強力な流通ネットワーク、最小限の加工野菜の摂取に関連する健康上の利点によって牽引されています。
| 市場範囲 | |
|---|---|
| 基準年 | 2024 |
| 終了年 | 2028 |
| 予測期間 | 2024-2028 |
| 成長モメンタム | 加速 |
| 前年比2024年 | 9.65% |
| CAGR | 11.04% |
| 増分額 | 899億米ドル |
本調査では、加工野菜メーカーや流通業者がプライベートブランド市場に参入していることが、今後数年間の加工野菜市場成長を牽引する主要因の一つであると分析しています。また、ハラルカテゴリーの加工野菜の提供増加や、加工野菜ベンダーのオンラインプレゼンス増加が、市場の大きな需要につながります。
目次
第1章 エグゼクティブサマリー
- 市場概要
第2章 市場情勢
- 市場エコシステム
- 市場の特徴
- バリューチェーン分析
第3章 市場規模の評価
- 市場の定義
- 市場セグメント分析
- 市場規模 2023
- 市場の見通し 2023-2028
第4章 市場規模実績
- 世界加工野菜市場 2018-2022
- 製品別セグメント分析 2018-2022
- 流通チャネル別セグメント分析 2018-2022
- 地域別セグメント分析 2018-2022
- 国別セグメント分析 2018-2022
第5章 ファイブフォース分析
- ファイブフォースの要約
- 買い手の交渉力
- 供給企業の交渉力
- 新規参入業者の脅威
- 代替品の脅威
- 競争の脅威
- 市況
第6章 市場セグメンテーション:製品別
- 市場セグメンテーション
- 比較:製品別
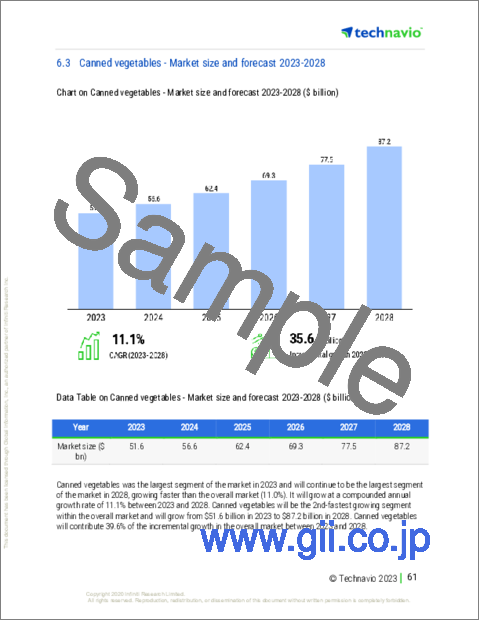
- 缶詰野菜:市場規模と予測 2023-2028
- 冷凍野菜:市場規模と予測 2023-2028
- 新鮮なカット野菜:市場規模と予測 2023-2028
- 市場機会:製品別
第7章 市場セグメンテーション:流通チャネル別
- 市場セグメンテーション
- 比較:流通チャネル別
- ハイパーマーケットとスーパーマーケット:市場規模と予測 2023-2028
- 独立系小売店およびコンビニエンスストア:市場規模と予測 2023-2028
- 専門食料品店:市場規模と予測 2023-2028
- オンライン小売業者:市場規模と予測 2023-2028
- 市場機会:流通チャネル別
第8章 顧客情勢
- 顧客情勢の概要
第9章 地域別情勢
- 地域別セグメンテーション
- 地域別比較
- アジア太平洋:市場規模と予測 2023-2028
- 北米:市場規模と予測 2023-2028
- 欧州:市場規模と予測 2023-2028
- 南米:市場規模と予測 2023-2028
- 中東・アフリカ:市場規模と予測 2023-2028
- 米国:市場規模と予測 2023-2028
- 中国:市場規模と予測 2023-2028
- 英国:市場規模と予測 2023-2028
- ドイツ:市場規模と予測 2023-2028
- インド:市場規模と予測 2023-2028
- 市場機会:地域別
第10章 促進要因・課題・機会・抑制要因
- 市場促進要因
- 市場の課題
- 促進要因と課題の影響
- 市場の機会・抑制要因
第11章 競合情勢
- 概要
- 競合情勢
- 混乱の状況
- 業界のリスク
第12章 競合分析
- 企業プロファイル
- 企業の市場ポジショニング
- Archer Daniels Midland Co.
- Ardo Coordination Center NV
- B and G Foods Inc.
- Charoen Pokphand Foods PCL
- Conagra Brands Inc.
- Cooperatie Koninklijke Cosun UA
- Dole plc
- Farmers Market Foods Inc.
- J.D. Irving Ltd.
- Libbys Brand Holding
- Mitsubishi Corp.
- Ninos Fresh Cut Fruit and Veg LLC
- NutriAsia Inc.
- Sprouts Farmers Market Inc.
- Sysco Corp.
第13章 付録
Exhibits:
- Exhibits1: Executive Summary - Chart on Market Overview
- Exhibits2: Executive Summary - Data Table on Market Overview
- Exhibits3: Executive Summary - Chart on Global Market Characteristics
- Exhibits4: Executive Summary - Chart on Market by Geography
- Exhibits5: Executive Summary - Chart on Market Segmentation by Product
- Exhibits6: Executive Summary - Chart on Market Segmentation by Distribution Channel
- Exhibits7: Executive Summary - Chart on Incremental Growth
- Exhibits8: Executive Summary - Data Table on Incremental Growth
- Exhibits9: Executive Summary - Chart on Company Market Positioning
- Exhibits10: Parent Market
- Exhibits11: Data Table on - Parent Market
- Exhibits12: Market characteristics analysis
- Exhibits13: Value Chain Analysis
- Exhibits14: Offerings of companies included in the market definition
- Exhibits15: Market segments
- Exhibits16: Chart on Global - Market size and forecast 2023-2028 ($ billion)
- Exhibits17: Data Table on Global - Market size and forecast 2023-2028 ($ billion)
- Exhibits18: Chart on Global Market: Year-over-year growth 2023-2028 (%)
- Exhibits19: Data Table on Global Market: Year-over-year growth 2023-2028 (%)
- Exhibits20: Historic Market Size - Data Table on Global Processed Vegetable Market 2018 - 2022 ($ billion)
- Exhibits21: Historic Market Size - Product Segment 2018 - 2022 ($ billion)
- Exhibits22: Historic Market Size - Distribution Channel Segment 2018 - 2022 ($ billion)
- Exhibits23: Historic Market Size - Geography Segment 2018 - 2022 ($ billion)
- Exhibits24: Historic Market Size - Country Segment 2018 - 2022 ($ billion)
- Exhibits25: Five forces analysis - Comparison between 2023 and 2028
- Exhibits26: Bargaining power of buyers - Impact of key factors 2023 and 2028
- Exhibits27: Bargaining power of suppliers - Impact of key factors in 2023 and 2028
- Exhibits28: Threat of new entrants - Impact of key factors in 2023 and 2028
- Exhibits29: Threat of substitutes - Impact of key factors in 2023 and 2028
- Exhibits30: Threat of rivalry - Impact of key factors in 2023 and 2028
- Exhibits31: Chart on Market condition - Five forces 2023 and 2028
- Exhibits32: Chart on Product - Market share 2023-2028 (%)
- Exhibits33: Data Table on Product - Market share 2023-2028 (%)
- Exhibits34: Chart on Comparison by Product
- Exhibits35: Data Table on Comparison by Product
- Exhibits36: Chart on Canned vegetables - Market size and forecast 2023-2028 ($ billion)
- Exhibits37: Data Table on Canned vegetables - Market size and forecast 2023-2028 ($ billion)
- Exhibits38: Chart on Canned vegetables - Year-over-year growth 2023-2028 (%)
- Exhibits39: Data Table on Canned vegetables - Year-over-year growth 2023-2028 (%)
- Exhibits40: Chart on Frozen vegetables - Market size and forecast 2023-2028 ($ billion)
- Exhibits41: Data Table on Frozen vegetables - Market size and forecast 2023-2028 ($ billion)
- Exhibits42: Chart on Frozen vegetables - Year-over-year growth 2023-2028 (%)
- Exhibits43: Data Table on Frozen vegetables - Year-over-year growth 2023-2028 (%)
- Exhibits44: Chart on Fresh-cut vegetables - Market size and forecast 2023-2028 ($ billion)
- Exhibits45: Data Table on Fresh-cut vegetables - Market size and forecast 2023-2028 ($ billion)
- Exhibits46: Chart on Fresh-cut vegetables - Year-over-year growth 2023-2028 (%)
- Exhibits47: Data Table on Fresh-cut vegetables - Year-over-year growth 2023-2028 (%)
- Exhibits48: Market opportunity by Product ($ billion)
- Exhibits49: Data Table on Market opportunity by Product ($ billion)
- Exhibits50: Chart on Distribution Channel - Market share 2023-2028 (%)
- Exhibits51: Data Table on Distribution Channel - Market share 2023-2028 (%)
- Exhibits52: Chart on Comparison by Distribution Channel
- Exhibits53: Data Table on Comparison by Distribution Channel
- Exhibits54: Chart on Hypermarkets and supermarkets - Market size and forecast 2023-2028 ($ billion)
- Exhibits55: Data Table on Hypermarkets and supermarkets - Market size and forecast 2023-2028 ($ billion)
- Exhibits56: Chart on Hypermarkets and supermarkets - Year-over-year growth 2023-2028 (%)
- Exhibits57: Data Table on Hypermarkets and supermarkets - Year-over-year growth 2023-2028 (%)
- Exhibits58: Chart on Independent retailers and convenience store - Market size and forecast 2023-2028 ($ billion)
- Exhibits59: Data Table on Independent retailers and convenience store - Market size and forecast 2023-2028 ($ billion)
- Exhibits60: Chart on Independent retailers and convenience store - Year-over-year growth 2023-2028 (%)
- Exhibits61: Data Table on Independent retailers and convenience store - Year-over-year growth 2023-2028 (%)
- Exhibits62: Chart on Speciality food stores - Market size and forecast 2023-2028 ($ billion)
- Exhibits63: Data Table on Speciality food stores - Market size and forecast 2023-2028 ($ billion)
- Exhibits64: Chart on Speciality food stores - Year-over-year growth 2023-2028 (%)
- Exhibits65: Data Table on Speciality food stores - Year-over-year growth 2023-2028 (%)
- Exhibits66: Chart on Online retailers - Market size and forecast 2023-2028 ($ billion)
- Exhibits67: Data Table on Online retailers - Market size and forecast 2023-2028 ($ billion)
- Exhibits68: Chart on Online retailers - Year-over-year growth 2023-2028 (%)
- Exhibits69: Data Table on Online retailers - Year-over-year growth 2023-2028 (%)
- Exhibits70: Market opportunity by Distribution Channel ($ billion)
- Exhibits71: Data Table on Market opportunity by Distribution Channel ($ billion)
- Exhibits72: Analysis of price sensitivity, lifecycle, customer purchase basket, adoption rates, and purchase criteria
- Exhibits73: Chart on Market share By Geographical Landscape2023-2028 (%)
- Exhibits74: Data Table on Market share By Geographical Landscape2023-2028 (%)
- Exhibits75: Chart on Geographic comparison
- Exhibits76: Data Table on Geographic comparison
- Exhibits77: Chart on APAC - Market size and forecast 2023-2028 ($ billion)
- Exhibits78: Data Table on APAC - Market size and forecast 2023-2028 ($ billion)
- Exhibits79: Chart on APAC - Year-over-year growth 2023-2028 (%)
- Exhibits80: Data Table on APAC - Year-over-year growth 2023-2028 (%)
- Exhibits81: Chart on North America - Market size and forecast 2023-2028 ($ billion)
- Exhibits82: Data Table on North America - Market size and forecast 2023-2028 ($ billion)
- Exhibits83: Chart on North America - Year-over-year growth 2023-2028 (%)
- Exhibits84: Data Table on North America - Year-over-year growth 2023-2028 (%)
- Exhibits85: Chart on Europe - Market size and forecast 2023-2028 ($ billion)
- Exhibits86: Data Table on Europe - Market size and forecast 2023-2028 ($ billion)
- Exhibits87: Chart on Europe - Year-over-year growth 2023-2028 (%)
- Exhibits88: Data Table on Europe - Year-over-year growth 2023-2028 (%)
- Exhibits89: Chart on South America - Market size and forecast 2023-2028 ($ billion)
- Exhibits90: Data Table on South America - Market size and forecast 2023-2028 ($ billion)
- Exhibits91: Chart on South America - Year-over-year growth 2023-2028 (%)
- Exhibits92: Data Table on South America - Year-over-year growth 2023-2028 (%)
- Exhibits93: Chart on Middle East and Africa - Market size and forecast 2023-2028 ($ billion)
- Exhibits94: Data Table on Middle East and Africa - Market size and forecast 2023-2028 ($ billion)
- Exhibits95: Chart on Middle East and Africa - Year-over-year growth 2023-2028 (%)
- Exhibits96: Data Table on Middle East and Africa - Year-over-year growth 2023-2028 (%)
- Exhibits97: Chart on US - Market size and forecast 2023-2028 ($ billion)
- Exhibits98: Data Table on US - Market size and forecast 2023-2028 ($ billion)
- Exhibits99: Chart on US - Year-over-year growth 2023-2028 (%)
- Exhibits100: Data Table on US - Year-over-year growth 2023-2028 (%)
- Exhibits101: Chart on China - Market size and forecast 2023-2028 ($ billion)
- Exhibits102: Data Table on China - Market size and forecast 2023-2028 ($ billion)
- Exhibits103: Chart on China - Year-over-year growth 2023-2028 (%)
- Exhibits104: Data Table on China - Year-over-year growth 2023-2028 (%)
- Exhibits105: Chart on UK - Market size and forecast 2023-2028 ($ billion)
- Exhibits106: Data Table on UK - Market size and forecast 2023-2028 ($ billion)
- Exhibits107: Chart on UK - Year-over-year growth 2023-2028 (%)
- Exhibits108: Data Table on UK - Year-over-year growth 2023-2028 (%)
- Exhibits109: Chart on Germany - Market size and forecast 2023-2028 ($ billion)
- Exhibits110: Data Table on Germany - Market size and forecast 2023-2028 ($ billion)
- Exhibits111: Chart on Germany - Year-over-year growth 2023-2028 (%)
- Exhibits112: Data Table on Germany - Year-over-year growth 2023-2028 (%)
- Exhibits113: Chart on India - Market size and forecast 2023-2028 ($ billion)
- Exhibits114: Data Table on India - Market size and forecast 2023-2028 ($ billion)
- Exhibits115: Chart on India - Year-over-year growth 2023-2028 (%)
- Exhibits116: Data Table on India - Year-over-year growth 2023-2028 (%)
- Exhibits117: Market opportunity By Geographical Landscape($ billion)
- Exhibits118: Data Tables on Market opportunity By Geographical Landscape($ billion)
- Exhibits119: Impact of drivers and challenges in 2023 and 2028
- Exhibits120: Overview on criticality of inputs and factors of differentiation
- Exhibits121: Overview on factors of disruption
- Exhibits122: Impact of key risks on business
- Exhibits123: Companies covered
- Exhibits124: Matrix on companies position and classification
- Exhibits125: Archer Daniels Midland Co. - Overview
- Exhibits126: Archer Daniels Midland Co. - Business segments
- Exhibits127: Archer Daniels Midland Co. - Key news
- Exhibits128: Archer Daniels Midland Co. - Key offerings
- Exhibits129: Archer Daniels Midland Co. - Segment focus
- Exhibits130: Ardo Coordination Center NV - Overview
- Exhibits131: Ardo Coordination Center NV - Product / Service
- Exhibits132: Ardo Coordination Center NV - Key offerings
- Exhibits133: B and G Foods Inc. - Overview
- Exhibits134: B and G Foods Inc. - Product / Service
- Exhibits135: B and G Foods Inc. - Key offerings
- Exhibits136: Charoen Pokphand Foods PCL - Overview
- Exhibits137: Charoen Pokphand Foods PCL - Business segments
- Exhibits138: Charoen Pokphand Foods PCL - Key news
- Exhibits139: Charoen Pokphand Foods PCL - Key offerings
- Exhibits140: Charoen Pokphand Foods PCL - Segment focus
- Exhibits141: Conagra Brands Inc. - Overview
- Exhibits142: Conagra Brands Inc. - Business segments
- Exhibits143: Conagra Brands Inc. - Key news
- Exhibits144: Conagra Brands Inc. - Key offerings
- Exhibits145: Conagra Brands Inc. - Segment focus
- Exhibits146: Cooperatie Koninklijke Cosun UA - Overview
- Exhibits147: Cooperatie Koninklijke Cosun UA - Product / Service
- Exhibits148: Cooperatie Koninklijke Cosun UA - Key offerings
- Exhibits149: Dole plc - Overview
- Exhibits150: Dole plc - Business segments
- Exhibits151: Dole plc - Key offerings
- Exhibits152: Dole plc - Segment focus
- Exhibits153: Farmers Market Foods Inc. - Overview
- Exhibits154: Farmers Market Foods Inc. - Product / Service
- Exhibits155: Farmers Market Foods Inc. - Key offerings
- Exhibits156: J.D. Irving Ltd. - Overview
- Exhibits157: J.D. Irving Ltd. - Product / Service
- Exhibits158: J.D. Irving Ltd. - Key offerings
- Exhibits159: Libbys Brand Holding - Overview
- Exhibits160: Libbys Brand Holding - Product / Service
- Exhibits161: Libbys Brand Holding - Key offerings
- Exhibits162: Mitsubishi Corp. - Overview
- Exhibits163: Mitsubishi Corp. - Business segments
- Exhibits164: Mitsubishi Corp. - Key news
- Exhibits165: Mitsubishi Corp. - Key offerings
- Exhibits166: Mitsubishi Corp. - Segment focus
- Exhibits167: Ninos Fresh Cut Fruit and Veg LLC - Overview
- Exhibits168: Ninos Fresh Cut Fruit and Veg LLC - Product / Service
- Exhibits169: Ninos Fresh Cut Fruit and Veg LLC - Key offerings
- Exhibits170: NutriAsia Inc. - Overview
- Exhibits171: NutriAsia Inc. - Product / Service
- Exhibits172: NutriAsia Inc. - Key offerings
- Exhibits173: Sprouts Farmers Market Inc. - Overview
- Exhibits174: Sprouts Farmers Market Inc. - Product / Service
- Exhibits175: Sprouts Farmers Market Inc. - Key offerings
- Exhibits176: Sysco Corp. - Overview
- Exhibits177: Sysco Corp. - Business segments
- Exhibits178: Sysco Corp. - Key offerings
- Exhibits179: Sysco Corp. - Segment focus
- Exhibits180: Inclusions checklist
- Exhibits181: Exclusions checklist
- Exhibits182: Currency conversion rates for US$
- Exhibits183: Research methodology
- Exhibits184: Information sources
- Exhibits185: Data validation
- Exhibits186: Validation techniques employed for market sizing
- Exhibits187: Data synthesis
- Exhibits188: 360 degree market analysis
- Exhibits189: List of abbreviations
Technavio has been monitoring the processed vegetable market and is forecast to grow by USD 89.9 bn during 2023-2028, accelerating at a CAGR of 11.04% during the forecast period. Our report on the processed vegetable market provides a holistic analysis, market size and forecast, trends, growth drivers, and challenges, as well as vendor analysis covering around 25 vendors.
The report offers an up-to-date analysis regarding the current market scenario, the latest trends and drivers, and the overall market environment. The market is driven by increasing demand for processed vegetables, strong distribution network between processed vegetable manufacturers and retailers, and health benefits associated with intake of minimally processed vegetables.
Technavio's processed vegetable market is segmented as below:
| Market Scope | |
|---|---|
| Base Year | 2024 |
| End Year | 2028 |
| Series Year | 2024-2028 |
| Growth Momentum | Accelerate |
| YOY 2024 | 9.65% |
| CAGR | 11.04% |
| Incremental Value | $89.9bn |
By Product
- Canned vegetables
- Frozen vegetables
- Fresh-cut vegetables
By Distribution Channel
- Hypermarkets and supermarkets
- Independent retailers and convenience store
- Speciality food stores
- Online retailers
By Geography
- APAC
- North America
- Europe
- South America
- Middle East and Africa
This study identifies the processed vegetable manufacturers and distributors venturing into private-label marketplace as one of the prime reasons driving the processed vegetable market growth during the next few years. Also, increased offerings of processed vegetable under halal category and increasing online presence of processed vegetable vendors will lead to sizable demand in the market.
Technavio presents a detailed picture of the market by the way of study, synthesis, and summation of data from multiple sources by an analysis of key parameters. Our report on the processed vegetable market covers the following areas:
- Processed vegetable market sizing
- Processed vegetable market forecast
- Processed vegetable market industry analysis
Technavio's robust vendor analysis is designed to help clients improve their market position, and in line with this, this report provides a detailed analysis of several leading processed vegetable market vendors that include Amazon.com Inc., Archer Daniels Midland Co., Ardo Coordination Center NV, B and G Foods Inc., Charoen Pokphand Foods PCL, Conagra Brands Inc., Cooperatie Koninklijke Cosun UA, Dole plc, Farmers Market Foods Inc., J.D. Irving Ltd., Libbys Brand Holding, Mitsubishi Corp., Ninos Fresh Cut Fruit and Veg LLC, NutriAsia Inc., Del Monte Pacific Ltd., Seneca Foods Corp., Smith Frozen Foods Inc., Sprouts Farmers Market Inc., Sysco Corp., and The Fresh Gourmet Co.. Also, the processed vegetable market analysis report includes information on upcoming trends and challenges that will influence market growth. This is to help companies strategize and leverage all forthcoming growth opportunities.
The study was conducted using an objective combination of primary and secondary information including inputs from key participants in the industry. The report contains a comprehensive market and vendor landscape in addition to an analysis of the key vendors.
Technavio presents a detailed picture of the market by the way of study, synthesis, and summation of data from multiple sources by an analysis of key parameters such as profit, pricing, competition, and promotions. It presents various market facets by identifying the key industry influencers. The data presented is comprehensive, reliable, and a result of extensive research - both primary and secondary. Technavio's market research reports provide a complete competitive landscape and an in-depth vendor selection methodology and analysis using qualitative and quantitative research to forecast accurate market growth.
Table of Contents
1 Executive Summary
- 1.1 Market overview
- Executive Summary - Chart on Market Overview
- Executive Summary - Data Table on Market Overview
- Executive Summary - Chart on Global Market Characteristics
- Executive Summary - Chart on Market by Geography
- Executive Summary - Chart on Market Segmentation by Product
- Executive Summary - Chart on Market Segmentation by Distribution Channel
- Executive Summary - Chart on Incremental Growth
- Executive Summary - Data Table on Incremental Growth
- Executive Summary - Chart on Company Market Positioning
2 Market Landscape
- 2.1 Market ecosystem
- Parent Market
- Data Table on - Parent Market
- 2.2 Market characteristics
- Market characteristics analysis
- 2.3 Value chain analysis
- Value Chain Analysis
3 Market Sizing
- 3.1 Market definition
- Offerings of companies included in the market definition
- 3.2 Market segment analysis
- Market segments
- 3.3 Market size 2023
- 3.4 Market outlook: Forecast for 2023-2028
- Chart on Global - Market size and forecast 2023-2028 ($ billion)
- Data Table on Global - Market size and forecast 2023-2028 ($ billion)
- Chart on Global Market: Year-over-year growth 2023-2028 (%)
- Data Table on Global Market: Year-over-year growth 2023-2028 (%)
4 Historic Market Size
- 4.1 Global Processed Vegetable Market 2018 - 2022
- Historic Market Size - Data Table on Global Processed Vegetable Market 2018 - 2022 ($ billion)
- 4.2 Product segment analysis 2018 - 2022
- Historic Market Size - Product Segment 2018 - 2022 ($ billion)
- 4.3 Distribution Channel segment analysis 2018 - 2022
- Historic Market Size - Distribution Channel Segment 2018 - 2022 ($ billion)
- 4.4 Geography segment analysis 2018 - 2022
- Historic Market Size - Geography Segment 2018 - 2022 ($ billion)
- 4.5 Country segment analysis 2018 - 2022
- Historic Market Size - Country Segment 2018 - 2022 ($ billion)
5 Five Forces Analysis
- 5.1 Five forces summary
- Five forces analysis - Comparison between 2023 and 2028
- 5.2 Bargaining power of buyers
- Bargaining power of buyers - Impact of key factors 2023 and 2028
- 5.3 Bargaining power of suppliers
- Bargaining power of suppliers - Impact of key factors in 2023 and 2028
- 5.4 Threat of new entrants
- Threat of new entrants - Impact of key factors in 2023 and 2028
- 5.5 Threat of substitutes
- Threat of substitutes - Impact of key factors in 2023 and 2028
- 5.6 Threat of rivalry
- Threat of rivalry - Impact of key factors in 2023 and 2028
- 5.7 Market condition
- Chart on Market condition - Five forces 2023 and 2028
6 Market Segmentation by Product
- 6.1 Market segments
- Chart on Product - Market share 2023-2028 (%)
- Data Table on Product - Market share 2023-2028 (%)
- 6.2 Comparison by Product
- Chart on Comparison by Product
- Data Table on Comparison by Product
- 6.3 Canned vegetables - Market size and forecast 2023-2028
- Chart on Canned vegetables - Market size and forecast 2023-2028 ($ billion)
- Data Table on Canned vegetables - Market size and forecast 2023-2028 ($ billion)
- Chart on Canned vegetables - Year-over-year growth 2023-2028 (%)
- Data Table on Canned vegetables - Year-over-year growth 2023-2028 (%)
- 6.4 Frozen vegetables - Market size and forecast 2023-2028
- Chart on Frozen vegetables - Market size and forecast 2023-2028 ($ billion)
- Data Table on Frozen vegetables - Market size and forecast 2023-2028 ($ billion)
- Chart on Frozen vegetables - Year-over-year growth 2023-2028 (%)
- Data Table on Frozen vegetables - Year-over-year growth 2023-2028 (%)
- 6.5 Fresh-cut vegetables - Market size and forecast 2023-2028
- Chart on Fresh-cut vegetables - Market size and forecast 2023-2028 ($ billion)
- Data Table on Fresh-cut vegetables - Market size and forecast 2023-2028 ($ billion)
- Chart on Fresh-cut vegetables - Year-over-year growth 2023-2028 (%)
- Data Table on Fresh-cut vegetables - Year-over-year growth 2023-2028 (%)
- 6.6 Market opportunity by Product
- Market opportunity by Product ($ billion)
- Data Table on Market opportunity by Product ($ billion)
7 Market Segmentation by Distribution Channel
- 7.1 Market segments
- Chart on Distribution Channel - Market share 2023-2028 (%)
- Data Table on Distribution Channel - Market share 2023-2028 (%)
- 7.2 Comparison by Distribution Channel
- Chart on Comparison by Distribution Channel
- Data Table on Comparison by Distribution Channel
- 7.3 Hypermarkets and supermarkets - Market size and forecast 2023-2028
- Chart on Hypermarkets and supermarkets - Market size and forecast 2023-2028 ($ billion)
- Data Table on Hypermarkets and supermarkets - Market size and forecast 2023-2028 ($ billion)
- Chart on Hypermarkets and supermarkets - Year-over-year growth 2023-2028 (%)
- Data Table on Hypermarkets and supermarkets - Year-over-year growth 2023-2028 (%)
- 7.4 Independent retailers and convenience store - Market size and forecast 2023-2028
- Chart on Independent retailers and convenience store - Market size and forecast 2023-2028 ($ billion)
- Data Table on Independent retailers and convenience store - Market size and forecast 2023-2028 ($ billion)
- Chart on Independent retailers and convenience store - Year-over-year growth 2023-2028 (%)
- Data Table on Independent retailers and convenience store - Year-over-year growth 2023-2028 (%)
- 7.5 Speciality food stores - Market size and forecast 2023-2028
- Chart on Speciality food stores - Market size and forecast 2023-2028 ($ billion)
- Data Table on Speciality food stores - Market size and forecast 2023-2028 ($ billion)
- Chart on Speciality food stores - Year-over-year growth 2023-2028 (%)
- Data Table on Speciality food stores - Year-over-year growth 2023-2028 (%)
- 7.6 Online retailers - Market size and forecast 2023-2028
- Chart on Online retailers - Market size and forecast 2023-2028 ($ billion)
- Data Table on Online retailers - Market size and forecast 2023-2028 ($ billion)
- Chart on Online retailers - Year-over-year growth 2023-2028 (%)
- Data Table on Online retailers - Year-over-year growth 2023-2028 (%)
- 7.7 Market opportunity by Distribution Channel
- Market opportunity by Distribution Channel ($ billion)
- Data Table on Market opportunity by Distribution Channel ($ billion)
8 Customer Landscape
- 8.1 Customer landscape overview
- Analysis of price sensitivity, lifecycle, customer purchase basket, adoption rates, and purchase criteria
9 Geographic Landscape
- 9.1 Geographic segmentation
- Chart on Market share By Geographical Landscape2023-2028 (%)
- Data Table on Market share By Geographical Landscape2023-2028 (%)
- 9.2 Geographic comparison
- Chart on Geographic comparison
- Data Table on Geographic comparison
- 9.3 APAC - Market size and forecast 2023-2028
- Chart on APAC - Market size and forecast 2023-2028 ($ billion)
- Data Table on APAC - Market size and forecast 2023-2028 ($ billion)
- Chart on APAC - Year-over-year growth 2023-2028 (%)
- Data Table on APAC - Year-over-year growth 2023-2028 (%)
- 9.4 North America - Market size and forecast 2023-2028
- Chart on North America - Market size and forecast 2023-2028 ($ billion)
- Data Table on North America - Market size and forecast 2023-2028 ($ billion)
- Chart on North America - Year-over-year growth 2023-2028 (%)
- Data Table on North America - Year-over-year growth 2023-2028 (%)
- 9.5 Europe - Market size and forecast 2023-2028
- Chart on Europe - Market size and forecast 2023-2028 ($ billion)
- Data Table on Europe - Market size and forecast 2023-2028 ($ billion)
- Chart on Europe - Year-over-year growth 2023-2028 (%)
- Data Table on Europe - Year-over-year growth 2023-2028 (%)
- 9.6 South America - Market size and forecast 2023-2028
- Chart on South America - Market size and forecast 2023-2028 ($ billion)
- Data Table on South America - Market size and forecast 2023-2028 ($ billion)
- Chart on South America - Year-over-year growth 2023-2028 (%)
- Data Table on South America - Year-over-year growth 2023-2028 (%)
- 9.7 Middle East and Africa - Market size and forecast 2023-2028
- Chart on Middle East and Africa - Market size and forecast 2023-2028 ($ billion)
- Data Table on Middle East and Africa - Market size and forecast 2023-2028 ($ billion)
- Chart on Middle East and Africa - Year-over-year growth 2023-2028 (%)
- Data Table on Middle East and Africa - Year-over-year growth 2023-2028 (%)
- 9.8 US - Market size and forecast 2023-2028
- Chart on US - Market size and forecast 2023-2028 ($ billion)
- Data Table on US - Market size and forecast 2023-2028 ($ billion)
- Chart on US - Year-over-year growth 2023-2028 (%)
- Data Table on US - Year-over-year growth 2023-2028 (%)
- 9.9 China - Market size and forecast 2023-2028
- Chart on China - Market size and forecast 2023-2028 ($ billion)
- Data Table on China - Market size and forecast 2023-2028 ($ billion)
- Chart on China - Year-over-year growth 2023-2028 (%)
- Data Table on China - Year-over-year growth 2023-2028 (%)
- 9.10 UK - Market size and forecast 2023-2028
- Chart on UK - Market size and forecast 2023-2028 ($ billion)
- Data Table on UK - Market size and forecast 2023-2028 ($ billion)
- Chart on UK - Year-over-year growth 2023-2028 (%)
- Data Table on UK - Year-over-year growth 2023-2028 (%)
- 9.11 Germany - Market size and forecast 2023-2028
- Chart on Germany - Market size and forecast 2023-2028 ($ billion)
- Data Table on Germany - Market size and forecast 2023-2028 ($ billion)
- Chart on Germany - Year-over-year growth 2023-2028 (%)
- Data Table on Germany - Year-over-year growth 2023-2028 (%)
- 9.12 India - Market size and forecast 2023-2028
- Chart on India - Market size and forecast 2023-2028 ($ billion)
- Data Table on India - Market size and forecast 2023-2028 ($ billion)
- Chart on India - Year-over-year growth 2023-2028 (%)
- Data Table on India - Year-over-year growth 2023-2028 (%)
- 9.13 Market opportunity by geography
- Market opportunity By Geographical Landscape($ billion)
- Data Tables on Market opportunity By Geographical Landscape($ billion)
10 Drivers, Challenges, and Opportunity/Restraints
- 10.1 Market drivers
- 10.2 Market challenges
- 10.3 Impact of drivers and challenges
- Impact of drivers and challenges in 2023 and 2028
- 10.4 Market opportunities/restraints
11 Competitive Landscape
- 11.1 Overview
- 11.2 Competitive Landscape
- Overview on criticality of inputs and factors of differentiation
- 11.3 Landscape disruption
- Overview on factors of disruption
- 11.4 Industry risks
- Impact of key risks on business
12 Competitive Analysis
- 12.1 Companies profiled
- Companies covered
- 12.2 Market positioning of companies
- Matrix on companies position and classification
- 12.3 Archer Daniels Midland Co.
- Archer Daniels Midland Co. - Overview
- Archer Daniels Midland Co. - Business segments
- Archer Daniels Midland Co. - Key news
- Archer Daniels Midland Co. - Key offerings
- Archer Daniels Midland Co. - Segment focus
- 12.4 Ardo Coordination Center NV
- Ardo Coordination Center NV - Overview
- Ardo Coordination Center NV - Product / Service
- Ardo Coordination Center NV - Key offerings
- 12.5 B and G Foods Inc.
- B and G Foods Inc. - Overview
- B and G Foods Inc. - Product / Service
- B and G Foods Inc. - Key offerings
- 12.6 Charoen Pokphand Foods PCL
- Charoen Pokphand Foods PCL - Overview
- Charoen Pokphand Foods PCL - Business segments
- Charoen Pokphand Foods PCL - Key news
- Charoen Pokphand Foods PCL - Key offerings
- Charoen Pokphand Foods PCL - Segment focus
- 12.7 Conagra Brands Inc.
- Conagra Brands Inc. - Overview
- Conagra Brands Inc. - Business segments
- Conagra Brands Inc. - Key news
- Conagra Brands Inc. - Key offerings
- Conagra Brands Inc. - Segment focus
- 12.8 Cooperatie Koninklijke Cosun UA
- Cooperatie Koninklijke Cosun UA - Overview
- Cooperatie Koninklijke Cosun UA - Product / Service
- Cooperatie Koninklijke Cosun UA - Key offerings
- 12.9 Dole plc
- Dole plc - Overview
- Dole plc - Business segments
- Dole plc - Key offerings
- Dole plc - Segment focus
- 12.10 Farmers Market Foods Inc.
- Farmers Market Foods Inc. - Overview
- Farmers Market Foods Inc. - Product / Service
- Farmers Market Foods Inc. - Key offerings
- 12.11 J.D. Irving Ltd.
- J.D. Irving Ltd. - Overview
- J.D. Irving Ltd. - Product / Service
- J.D. Irving Ltd. - Key offerings
- 12.12 Libbys Brand Holding
- Libbys Brand Holding - Overview
- Libbys Brand Holding - Product / Service
- Libbys Brand Holding - Key offerings
- 12.13 Mitsubishi Corp.
- Mitsubishi Corp. - Overview
- Mitsubishi Corp. - Business segments
- Mitsubishi Corp. - Key news
- Mitsubishi Corp. - Key offerings
- Mitsubishi Corp. - Segment focus
- 12.14 Ninos Fresh Cut Fruit and Veg LLC
- Ninos Fresh Cut Fruit and Veg LLC - Overview
- Ninos Fresh Cut Fruit and Veg LLC - Product / Service
- Ninos Fresh Cut Fruit and Veg LLC - Key offerings
- 12.15 NutriAsia Inc.
- NutriAsia Inc. - Overview
- NutriAsia Inc. - Product / Service
- NutriAsia Inc. - Key offerings
- 12.16 Sprouts Farmers Market Inc.
- Sprouts Farmers Market Inc. - Overview
- Sprouts Farmers Market Inc. - Product / Service
- Sprouts Farmers Market Inc. - Key offerings
- 12.17 Sysco Corp.
- Sysco Corp. - Overview
- Sysco Corp. - Business segments
- Sysco Corp. - Key offerings
- Sysco Corp. - Segment focus
13 Appendix
- 13.1 Scope of the report
- 13.2 Inclusions and exclusions checklist
- Inclusions checklist
- Exclusions checklist
- 13.3 Currency conversion rates for US$
- Currency conversion rates for US$
- 13.4 Research methodology
- Research methodology
- 13.5 Data procurement
- Information sources
- 13.6 Data validation
- Data validation
- 13.7 Validation techniques employed for market sizing
- Validation techniques employed for market sizing
- 13.8 Data synthesis
- Data synthesis
- 13.9 360 degree market analysis
- 360 degree market analysis
- 13.10 List of abbreviations
- List of abbreviations

