|
|
市場調査レポート
商品コード
1502427
レジオネラ菌検査の世界市場 2024-2028Global legionella testing market 2024-2028 |
||||||
|
|||||||
カスタマイズ可能
|
|||||||


| レジオネラ菌検査の世界市場 2024-2028 |
|
出版日: 2024年05月20日
発行: TechNavio
ページ情報: 英文 168 Pages
納期: 即納可能
|

全表示
- 概要
- 図表
- 目次
Technavio社は、レジオネラ菌検査市場をモニターしており、2023年から2028年にかけて1億6,730万米ドル、予測期間中のCAGRは8.09%で成長すると予測しています。
当レポートでは、レジオネラ菌検査市場の全体的な分析、市場規模・予測、動向、成長促進要因、課題、約25のベンダーを網羅したベンダー分析などを掲載しています。
現在の市場シナリオ、最新動向と促進要因、市場環境全体に関する最新分析を提供しています。市場は、高齢者人口の増加、呼吸器疾患に対する意識の高まり、食品安全に対する懸念の高まりによって牽引されています。
| 市場範囲 | |
|---|---|
| 基準年 | 2024 |
| 終了年 | 2028 |
| 予測期間 | 2024-2028 |
| 成長モメンタム | 加速 |
| 前年比2024年 | 7.33% |
| CAGR | 8.09% |
| 増分額 | 1億6,730万米ドル |
本調査では、今後数年間のレジオネラ菌検査市場成長を牽引する主要因の1つとして、新たな感染症の出現を挙げています。また、呼吸モニタリングデバイスの技術的進歩や感染症の迅速診断への取り組みの増加が、市場の大きな需要につながります。
目次
第1章 エグゼクティブサマリー
- 市場概要
第2章 市場情勢
- 市場エコシステム
- 市場の特徴
- バリューチェーン分析
第3章 市場規模の評価
- 市場の定義
- 市場セグメント分析
- 市場規模 2023
- 市場の見通し 2023-2028
第4章 市場規模実績
- 世界レジオネラ菌検査市場 2018-2022
- 用途別セグメント分析 2018-2022
- エンドユーザー別セグメント分析 2018-2022
- 地域別セグメント分析 2018-2022
- 国別セグメント分析 2018-2022
第5章 ファイブフォース分析
- ファイブフォースの要約
- 買い手の交渉力
- 供給企業の交渉力
- 新規参入業者の脅威
- 代替品の脅威
- 競争の脅威
- 市況
第6章 市場セグメンテーション:用途別
- 市場セグメンテーション
- 比較:用途別
- 臨床試験:市場規模と予測 2023-2028
- 環境試験:市場規模と予測 2023-2028
- 市場機会:用途別
第7章 市場セグメンテーション:エンドユーザー別
- 市場セグメンテーション
- 比較:エンドユーザー別
- 病院と診療所:市場規模と予測 2023-2028
- 診断検査室:市場規模と予測 2023-2028
- 市場機会:エンドユーザー別
第8章 顧客情勢
- 顧客情勢の概要
第9章 地域別情勢
- 地域別セグメンテーション
- 地域別比較
- 北米:市場規模と予測 2023-2028
- 欧州:市場規模と予測 2023-2028
- アジア:市場規模と予測 2023-2028
- 世界のその他の地域:市場規模と予測 2023-2028
- 米国:市場規模と予測 2023-2028
- 英国:市場規模と予測 2023-2028
- フランス:市場規模と予測 2023-2028
- ドイツ:市場規模と予測 2023-2028
- 中国:市場規模と予測 2023-2028
- 市場機会:地域別
第10章 促進要因・課題・機会・抑制要因
- 市場促進要因
- 市場の課題
- 促進要因と課題の影響
- 市場の機会・抑制要因
第11章 競合情勢
- 概要
- 競合情勢
- 混乱の状況
- 業界のリスク
第12章 競合分析
- 企業プロファイル
- 企業の市場ポジショニング
- Aquacert Ltd.
- Becton Dickinson and Co.
- Bio Rad Laboratories Inc.
- bioMerieux SA
- Eiken Chemical Co. Ltd.
- Element Materials Technology Group Ltd.
- Eurofins Scientific SE
- IDEXX LABORATORIES INC.
- Intertek Group Plc
- Pro Lab Diagnostics Inc.
- Quidelortho Corp.
- SGS SA
- Thermo Fisher Scientific Inc.
- TUV NORD AG
- UL Solutions Inc.
第13章 付録
Exhibits:
- Exhibits1: Executive Summary - Chart on Market Overview
- Exhibits2: Executive Summary - Data Table on Market Overview
- Exhibits3: Executive Summary - Chart on Global Market Characteristics
- Exhibits4: Executive Summary - Chart on Market by Geography
- Exhibits5: Executive Summary - Chart on Market Segmentation by Application
- Exhibits6: Executive Summary - Chart on Market Segmentation by End-user
- Exhibits7: Executive Summary - Chart on Incremental Growth
- Exhibits8: Executive Summary - Data Table on Incremental Growth
- Exhibits9: Executive Summary - Chart on Company Market Positioning
- Exhibits10: Parent Market
- Exhibits11: Data Table on - Parent Market
- Exhibits12: Market characteristics analysis
- Exhibits13: Value Chain Analysis
- Exhibits14: Offerings of companies included in the market definition
- Exhibits15: Market segments
- Exhibits16: Chart on Global - Market size and forecast 2023-2028 ($ million)
- Exhibits17: Data Table on Global - Market size and forecast 2023-2028 ($ million)
- Exhibits18: Chart on Global Market: Year-over-year growth 2023-2028 (%)
- Exhibits19: Data Table on Global Market: Year-over-year growth 2023-2028 (%)
- Exhibits20: Historic Market Size - Data Table on Global Legionella Testing Market 2018 - 2022 ($ million)
- Exhibits21: Historic Market Size - Application Segment 2018 - 2022 ($ million)
- Exhibits22: Historic Market Size - End-user Segment 2018 - 2022 ($ million)
- Exhibits23: Historic Market Size - Geography Segment 2018 - 2022 ($ million)
- Exhibits24: Historic Market Size - Country Segment 2018 - 2022 ($ million)
- Exhibits25: Five forces analysis - Comparison between 2023 and 2028
- Exhibits26: Bargaining power of buyers - Impact of key factors 2023 and 2028
- Exhibits27: Bargaining power of suppliers - Impact of key factors in 2023 and 2028
- Exhibits28: Threat of new entrants - Impact of key factors in 2023 and 2028
- Exhibits29: Threat of substitutes - Impact of key factors in 2023 and 2028
- Exhibits30: Threat of rivalry - Impact of key factors in 2023 and 2028
- Exhibits31: Chart on Market condition - Five forces 2023 and 2028
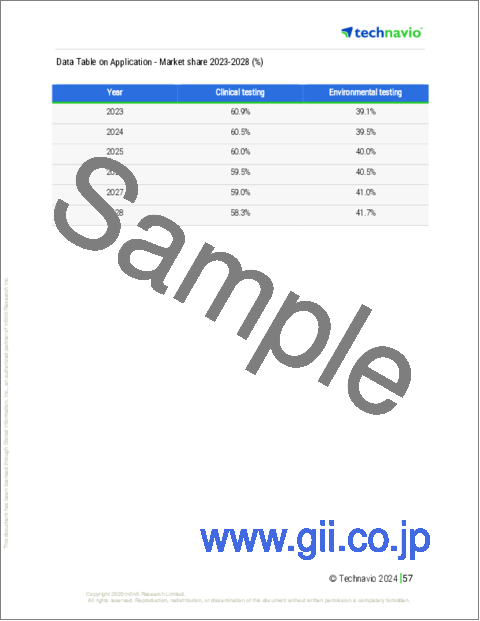
- Exhibits32: Chart on Application - Market share 2023-2028 (%)
- Exhibits33: Data Table on Application - Market share 2023-2028 (%)
- Exhibits34: Chart on Comparison by Application
- Exhibits35: Data Table on Comparison by Application
- Exhibits36: Chart on Clinical testing - Market size and forecast 2023-2028 ($ million)
- Exhibits37: Data Table on Clinical testing - Market size and forecast 2023-2028 ($ million)
- Exhibits38: Chart on Clinical testing - Year-over-year growth 2023-2028 (%)
- Exhibits39: Data Table on Clinical testing - Year-over-year growth 2023-2028 (%)
- Exhibits40: Chart on Environmental testing - Market size and forecast 2023-2028 ($ million)
- Exhibits41: Data Table on Environmental testing - Market size and forecast 2023-2028 ($ million)
- Exhibits42: Chart on Environmental testing - Year-over-year growth 2023-2028 (%)
- Exhibits43: Data Table on Environmental testing - Year-over-year growth 2023-2028 (%)
- Exhibits44: Market opportunity by Application ($ million)
- Exhibits45: Data Table on Market opportunity by Application ($ million)
- Exhibits46: Chart on End-user - Market share 2023-2028 (%)
- Exhibits47: Data Table on End-user - Market share 2023-2028 (%)
- Exhibits48: Chart on Comparison by End-user
- Exhibits49: Data Table on Comparison by End-user
- Exhibits50: Chart on Hospitals and clinics - Market size and forecast 2023-2028 ($ million)
- Exhibits51: Data Table on Hospitals and clinics - Market size and forecast 2023-2028 ($ million)
- Exhibits52: Chart on Hospitals and clinics - Year-over-year growth 2023-2028 (%)
- Exhibits53: Data Table on Hospitals and clinics - Year-over-year growth 2023-2028 (%)
- Exhibits54: Chart on Diagnostic laboratories - Market size and forecast 2023-2028 ($ million)
- Exhibits55: Data Table on Diagnostic laboratories - Market size and forecast 2023-2028 ($ million)
- Exhibits56: Chart on Diagnostic laboratories - Year-over-year growth 2023-2028 (%)
- Exhibits57: Data Table on Diagnostic laboratories - Year-over-year growth 2023-2028 (%)
- Exhibits58: Market opportunity by End-user ($ million)
- Exhibits59: Data Table on Market opportunity by End-user ($ million)
- Exhibits60: Analysis of price sensitivity, lifecycle, customer purchase basket, adoption rates, and purchase criteria
- Exhibits61: Chart on Market share By Geographical Landscape2023-2028 (%)
- Exhibits62: Data Table on Market share By Geographical Landscape2023-2028 (%)
- Exhibits63: Chart on Geographic comparison
- Exhibits64: Data Table on Geographic comparison
- Exhibits65: Chart on North America - Market size and forecast 2023-2028 ($ million)
- Exhibits66: Data Table on North America - Market size and forecast 2023-2028 ($ million)
- Exhibits67: Chart on North America - Year-over-year growth 2023-2028 (%)
- Exhibits68: Data Table on North America - Year-over-year growth 2023-2028 (%)
- Exhibits69: Chart on Europe - Market size and forecast 2023-2028 ($ million)
- Exhibits70: Data Table on Europe - Market size and forecast 2023-2028 ($ million)
- Exhibits71: Chart on Europe - Year-over-year growth 2023-2028 (%)
- Exhibits72: Data Table on Europe - Year-over-year growth 2023-2028 (%)
- Exhibits73: Chart on Asia - Market size and forecast 2023-2028 ($ million)
- Exhibits74: Data Table on Asia - Market size and forecast 2023-2028 ($ million)
- Exhibits75: Chart on Asia - Year-over-year growth 2023-2028 (%)
- Exhibits76: Data Table on Asia - Year-over-year growth 2023-2028 (%)
- Exhibits77: Chart on Rest of World (ROW) - Market size and forecast 2023-2028 ($ million)
- Exhibits78: Data Table on Rest of World (ROW) - Market size and forecast 2023-2028 ($ million)
- Exhibits79: Chart on Rest of World (ROW) - Year-over-year growth 2023-2028 (%)
- Exhibits80: Data Table on Rest of World (ROW) - Year-over-year growth 2023-2028 (%)
- Exhibits81: Chart on US - Market size and forecast 2023-2028 ($ million)
- Exhibits82: Data Table on US - Market size and forecast 2023-2028 ($ million)
- Exhibits83: Chart on US - Year-over-year growth 2023-2028 (%)
- Exhibits84: Data Table on US - Year-over-year growth 2023-2028 (%)
- Exhibits85: Chart on UK - Market size and forecast 2023-2028 ($ million)
- Exhibits86: Data Table on UK - Market size and forecast 2023-2028 ($ million)
- Exhibits87: Chart on UK - Year-over-year growth 2023-2028 (%)
- Exhibits88: Data Table on UK - Year-over-year growth 2023-2028 (%)
- Exhibits89: Chart on France - Market size and forecast 2023-2028 ($ million)
- Exhibits90: Data Table on France - Market size and forecast 2023-2028 ($ million)
- Exhibits91: Chart on France - Year-over-year growth 2023-2028 (%)
- Exhibits92: Data Table on France - Year-over-year growth 2023-2028 (%)
- Exhibits93: Chart on Germany - Market size and forecast 2023-2028 ($ million)
- Exhibits94: Data Table on Germany - Market size and forecast 2023-2028 ($ million)
- Exhibits95: Chart on Germany - Year-over-year growth 2023-2028 (%)
- Exhibits96: Data Table on Germany - Year-over-year growth 2023-2028 (%)
- Exhibits97: Chart on China - Market size and forecast 2023-2028 ($ million)
- Exhibits98: Data Table on China - Market size and forecast 2023-2028 ($ million)
- Exhibits99: Chart on China - Year-over-year growth 2023-2028 (%)
- Exhibits100: Data Table on China - Year-over-year growth 2023-2028 (%)
- Exhibits101: Market opportunity By Geographical Landscape($ million)
- Exhibits102: Data Tables on Market opportunity By Geographical Landscape($ million)
- Exhibits103: Impact of drivers and challenges in 2023 and 2028
- Exhibits104: Overview on criticality of inputs and factors of differentiation
- Exhibits105: Overview on factors of disruption
- Exhibits106: Impact of key risks on business
- Exhibits107: Companies covered
- Exhibits108: Matrix on companies position and classification
- Exhibits109: Aquacert Ltd. - Overview
- Exhibits110: Aquacert Ltd. - Product / Service
- Exhibits111: Aquacert Ltd. - Key offerings
- Exhibits112: Becton Dickinson and Co. - Overview
- Exhibits113: Becton Dickinson and Co. - Business segments
- Exhibits114: Becton Dickinson and Co. - Key news
- Exhibits115: Becton Dickinson and Co. - Key offerings
- Exhibits116: Becton Dickinson and Co. - Segment focus
- Exhibits117: Bio Rad Laboratories Inc. - Overview
- Exhibits118: Bio Rad Laboratories Inc. - Business segments
- Exhibits119: Bio Rad Laboratories Inc. - Key news
- Exhibits120: Bio Rad Laboratories Inc. - Key offerings
- Exhibits121: Bio Rad Laboratories Inc. - Segment focus
- Exhibits122: bioMerieux SA - Overview
- Exhibits123: bioMerieux SA - Product / Service
- Exhibits124: bioMerieux SA - Key news
- Exhibits125: bioMerieux SA - Key offerings
- Exhibits126: Eiken Chemical Co. Ltd. - Overview
- Exhibits127: Eiken Chemical Co. Ltd. - Product / Service
- Exhibits128: Eiken Chemical Co. Ltd. - Key offerings
- Exhibits129: Element Materials Technology Group Ltd. - Overview
- Exhibits130: Element Materials Technology Group Ltd. - Product / Service
- Exhibits131: Element Materials Technology Group Ltd. - Key offerings
- Exhibits132: Eurofins Scientific SE - Overview
- Exhibits133: Eurofins Scientific SE - Business segments
- Exhibits134: Eurofins Scientific SE - Key news
- Exhibits135: Eurofins Scientific SE - Key offerings
- Exhibits136: Eurofins Scientific SE - Segment focus
- Exhibits137: IDEXX LABORATORIES INC. - Overview
- Exhibits138: IDEXX LABORATORIES INC. - Business segments
- Exhibits139: IDEXX LABORATORIES INC. - Key news
- Exhibits140: IDEXX LABORATORIES INC. - Key offerings
- Exhibits141: IDEXX LABORATORIES INC. - Segment focus
- Exhibits142: Intertek Group Plc - Overview
- Exhibits143: Intertek Group Plc - Business segments
- Exhibits144: Intertek Group Plc - Key offerings
- Exhibits145: Intertek Group Plc - Segment focus
- Exhibits146: Pro Lab Diagnostics Inc. - Overview
- Exhibits147: Pro Lab Diagnostics Inc. - Product / Service
- Exhibits148: Pro Lab Diagnostics Inc. - Key offerings
- Exhibits149: Quidelortho Corp. - Overview
- Exhibits150: Quidelortho Corp. - Product / Service
- Exhibits151: Quidelortho Corp. - Key news
- Exhibits152: Quidelortho Corp. - Key offerings
- Exhibits153: SGS SA - Overview
- Exhibits154: SGS SA - Business segments
- Exhibits155: SGS SA - Key news
- Exhibits156: SGS SA - Key offerings
- Exhibits157: SGS SA - Segment focus
- Exhibits158: Thermo Fisher Scientific Inc. - Overview
- Exhibits159: Thermo Fisher Scientific Inc. - Business segments
- Exhibits160: Thermo Fisher Scientific Inc. - Key news
- Exhibits161: Thermo Fisher Scientific Inc. - Key offerings
- Exhibits162: Thermo Fisher Scientific Inc. - Segment focus
- Exhibits163: TUV NORD AG - Overview
- Exhibits164: TUV NORD AG - Business segments
- Exhibits165: TUV NORD AG - Key offerings
- Exhibits166: TUV NORD AG - Segment focus
- Exhibits167: UL Solutions Inc. - Overview
- Exhibits168: UL Solutions Inc. - Product / Service
- Exhibits169: UL Solutions Inc. - Key offerings
- Exhibits170: Inclusions checklist
- Exhibits171: Exclusions checklist
- Exhibits172: Currency conversion rates for US$
- Exhibits173: Research methodology
- Exhibits174: Information sources
- Exhibits175: Data validation
- Exhibits176: Validation techniques employed for market sizing
- Exhibits177: Data synthesis
- Exhibits178: 360 degree market analysis
- Exhibits179: List of abbreviations
Technavio has been monitoring the legionella testing market and is forecast to grow by USD 167.3 mn during 2023-2028, accelerating at a CAGR of 8.09% during the forecast period. Our report on the legionella testing market provides a holistic analysis, market size and forecast, trends, growth drivers, and challenges, as well as vendor analysis covering around 25 vendors.
The report offers an up-to-date analysis regarding the current market scenario, the latest trends and drivers, and the overall market environment. The market is driven by rise in geriatric population, growing awareness about respiratory disorders, and rise in food safety concerns.
Technavio's legionella testing market is segmented as below:
| Market Scope | |
|---|---|
| Base Year | 2024 |
| End Year | 2028 |
| Series Year | 2024-2028 |
| Growth Momentum | Accelerate |
| YOY 2024 | 7.33% |
| CAGR | 8.09% |
| Incremental Value | $167.3mn |
By Application
- Clinical testing
- Environmental testing
By End-user
- Hospitals and clinics
- Diagnostic laboratories
By Geography
- North America
- Europe
- Asia
- Rest of World (ROW)
This study identifies the emergence of new infectious diseases as one of the prime reasons driving the legionella testing market growth during the next few years. Also, technological advances in respiratory monitoring devices and increasing initiatives for rapid diagnostics of infectious diseases will lead to sizable demand in the market.
Technavio presents a detailed picture of the market by the way of study, synthesis, and summation of data from multiple sources by an analysis of key parameters. Our report on the legionella testing market covers the following areas:
- Legionella testing market sizing
- Legionella testing market forecast
- Legionella testing market industry analysis
Technavio's robust vendor analysis is designed to help clients improve their market position, and in line with this, this report provides a detailed analysis of several leading legionella testing market vendors that include AEMTEK Inc., Aerobiology Laboratory Associates Inc., Aquacert Ltd., Becton Dickinson and Co., Bio Rad Laboratories Inc., bioMerieux SA, Eiken Chemical Co. Ltd., Element Materials Technology Group Ltd., EMSL Analytical Inc., Eurofins Scientific SE, IDEXX LABORATORIES INC., Intertek Group Plc, Pace Analytical Services LLC, PDC Laboratories LLC, Pro Lab Diagnostics Inc., Quidelortho Corp., SGS SA, Thermo Fisher Scientific Inc., TUV NORD AG, and UL Solutions Inc.. Also, the legionella testing market analysis report includes information on upcoming trends and challenges that will influence market growth. This is to help companies strategize and leverage all forthcoming growth opportunities.
The study was conducted using an objective combination of primary and secondary information including inputs from key participants in the industry. The report contains a comprehensive market and vendor landscape in addition to an analysis of the key vendors.
Technavio presents a detailed picture of the market by the way of study, synthesis, and summation of data from multiple sources by an analysis of key parameters such as profit, pricing, competition, and promotions. It presents various market facets by identifying the key industry influencers. The data presented is comprehensive, reliable, and a result of extensive research - both primary and secondary. Technavio's market research reports provide a complete competitive landscape and an in-depth vendor selection methodology and analysis using qualitative and quantitative research to forecast accurate market growth.
Table of Contents
1 Executive Summary
- 1.1 Market overview
- Executive Summary - Chart on Market Overview
- Executive Summary - Data Table on Market Overview
- Executive Summary - Chart on Global Market Characteristics
- Executive Summary - Chart on Market by Geography
- Executive Summary - Chart on Market Segmentation by Application
- Executive Summary - Chart on Market Segmentation by End-user
- Executive Summary - Chart on Incremental Growth
- Executive Summary - Data Table on Incremental Growth
- Executive Summary - Chart on Company Market Positioning
2 Market Landscape
- 2.1 Market ecosystem
- Parent Market
- Data Table on - Parent Market
- 2.2 Market characteristics
- Market characteristics analysis
- 2.3 Value chain analysis
- Value Chain Analysis
3 Market Sizing
- 3.1 Market definition
- Offerings of companies included in the market definition
- 3.2 Market segment analysis
- Market segments
- 3.3 Market size 2023
- 3.4 Market outlook: Forecast for 2023-2028
- Chart on Global - Market size and forecast 2023-2028 ($ million)
- Data Table on Global - Market size and forecast 2023-2028 ($ million)
- Chart on Global Market: Year-over-year growth 2023-2028 (%)
- Data Table on Global Market: Year-over-year growth 2023-2028 (%)
4 Historic Market Size
- 4.1 Global Legionella Testing Market 2018 - 2022
- Historic Market Size - Data Table on Global Legionella Testing Market 2018 - 2022 ($ million)
- 4.2 Application segment analysis 2018 - 2022
- Historic Market Size - Application Segment 2018 - 2022 ($ million)
- 4.3 End-user segment analysis 2018 - 2022
- Historic Market Size - End-user Segment 2018 - 2022 ($ million)
- 4.4 Geography segment analysis 2018 - 2022
- Historic Market Size - Geography Segment 2018 - 2022 ($ million)
- 4.5 Country segment analysis 2018 - 2022
- Historic Market Size - Country Segment 2018 - 2022 ($ million)
5 Five Forces Analysis
- 5.1 Five forces summary
- Five forces analysis - Comparison between 2023 and 2028
- 5.2 Bargaining power of buyers
- Bargaining power of buyers - Impact of key factors 2023 and 2028
- 5.3 Bargaining power of suppliers
- Bargaining power of suppliers - Impact of key factors in 2023 and 2028
- 5.4 Threat of new entrants
- Threat of new entrants - Impact of key factors in 2023 and 2028
- 5.5 Threat of substitutes
- Threat of substitutes - Impact of key factors in 2023 and 2028
- 5.6 Threat of rivalry
- Threat of rivalry - Impact of key factors in 2023 and 2028
- 5.7 Market condition
- Chart on Market condition - Five forces 2023 and 2028
6 Market Segmentation by Application
- 6.1 Market segments
- Chart on Application - Market share 2023-2028 (%)
- Data Table on Application - Market share 2023-2028 (%)
- 6.2 Comparison by Application
- Chart on Comparison by Application
- Data Table on Comparison by Application
- 6.3 Clinical testing - Market size and forecast 2023-2028
- Chart on Clinical testing - Market size and forecast 2023-2028 ($ million)
- Data Table on Clinical testing - Market size and forecast 2023-2028 ($ million)
- Chart on Clinical testing - Year-over-year growth 2023-2028 (%)
- Data Table on Clinical testing - Year-over-year growth 2023-2028 (%)
- 6.4 Environmental testing - Market size and forecast 2023-2028
- Chart on Environmental testing - Market size and forecast 2023-2028 ($ million)
- Data Table on Environmental testing - Market size and forecast 2023-2028 ($ million)
- Chart on Environmental testing - Year-over-year growth 2023-2028 (%)
- Data Table on Environmental testing - Year-over-year growth 2023-2028 (%)
- 6.5 Market opportunity by Application
- Market opportunity by Application ($ million)
- Data Table on Market opportunity by Application ($ million)
7 Market Segmentation by End-user
- 7.1 Market segments
- Chart on End-user - Market share 2023-2028 (%)
- Data Table on End-user - Market share 2023-2028 (%)
- 7.2 Comparison by End-user
- Chart on Comparison by End-user
- Data Table on Comparison by End-user
- 7.3 Hospitals and clinics - Market size and forecast 2023-2028
- Chart on Hospitals and clinics - Market size and forecast 2023-2028 ($ million)
- Data Table on Hospitals and clinics - Market size and forecast 2023-2028 ($ million)
- Chart on Hospitals and clinics - Year-over-year growth 2023-2028 (%)
- Data Table on Hospitals and clinics - Year-over-year growth 2023-2028 (%)
- 7.4 Diagnostic laboratories - Market size and forecast 2023-2028
- Chart on Diagnostic laboratories - Market size and forecast 2023-2028 ($ million)
- Data Table on Diagnostic laboratories - Market size and forecast 2023-2028 ($ million)
- Chart on Diagnostic laboratories - Year-over-year growth 2023-2028 (%)
- Data Table on Diagnostic laboratories - Year-over-year growth 2023-2028 (%)
- 7.5 Market opportunity by End-user
- Market opportunity by End-user ($ million)
- Data Table on Market opportunity by End-user ($ million)
8 Customer Landscape
- 8.1 Customer landscape overview
- Analysis of price sensitivity, lifecycle, customer purchase basket, adoption rates, and purchase criteria
9 Geographic Landscape
- 9.1 Geographic segmentation
- Chart on Market share By Geographical Landscape2023-2028 (%)
- Data Table on Market share By Geographical Landscape2023-2028 (%)
- 9.2 Geographic comparison
- Chart on Geographic comparison
- Data Table on Geographic comparison
- 9.3 North America - Market size and forecast 2023-2028
- Chart on North America - Market size and forecast 2023-2028 ($ million)
- Data Table on North America - Market size and forecast 2023-2028 ($ million)
- Chart on North America - Year-over-year growth 2023-2028 (%)
- Data Table on North America - Year-over-year growth 2023-2028 (%)
- 9.4 Europe - Market size and forecast 2023-2028
- Chart on Europe - Market size and forecast 2023-2028 ($ million)
- Data Table on Europe - Market size and forecast 2023-2028 ($ million)
- Chart on Europe - Year-over-year growth 2023-2028 (%)
- Data Table on Europe - Year-over-year growth 2023-2028 (%)
- 9.5 Asia - Market size and forecast 2023-2028
- Chart on Asia - Market size and forecast 2023-2028 ($ million)
- Data Table on Asia - Market size and forecast 2023-2028 ($ million)
- Chart on Asia - Year-over-year growth 2023-2028 (%)
- Data Table on Asia - Year-over-year growth 2023-2028 (%)
- 9.6 Rest of World (ROW) - Market size and forecast 2023-2028
- Chart on Rest of World (ROW) - Market size and forecast 2023-2028 ($ million)
- Data Table on Rest of World (ROW) - Market size and forecast 2023-2028 ($ million)
- Chart on Rest of World (ROW) - Year-over-year growth 2023-2028 (%)
- Data Table on Rest of World (ROW) - Year-over-year growth 2023-2028 (%)
- 9.7 US - Market size and forecast 2023-2028
- Chart on US - Market size and forecast 2023-2028 ($ million)
- Data Table on US - Market size and forecast 2023-2028 ($ million)
- Chart on US - Year-over-year growth 2023-2028 (%)
- Data Table on US - Year-over-year growth 2023-2028 (%)
- 9.8 UK - Market size and forecast 2023-2028
- Chart on UK - Market size and forecast 2023-2028 ($ million)
- Data Table on UK - Market size and forecast 2023-2028 ($ million)
- Chart on UK - Year-over-year growth 2023-2028 (%)
- Data Table on UK - Year-over-year growth 2023-2028 (%)
- 9.9 France - Market size and forecast 2023-2028
- Chart on France - Market size and forecast 2023-2028 ($ million)
- Data Table on France - Market size and forecast 2023-2028 ($ million)
- Chart on France - Year-over-year growth 2023-2028 (%)
- Data Table on France - Year-over-year growth 2023-2028 (%)
- 9.10 Germany - Market size and forecast 2023-2028
- Chart on Germany - Market size and forecast 2023-2028 ($ million)
- Data Table on Germany - Market size and forecast 2023-2028 ($ million)
- Chart on Germany - Year-over-year growth 2023-2028 (%)
- Data Table on Germany - Year-over-year growth 2023-2028 (%)
- 9.11 China - Market size and forecast 2023-2028
- Chart on China - Market size and forecast 2023-2028 ($ million)
- Data Table on China - Market size and forecast 2023-2028 ($ million)
- Chart on China - Year-over-year growth 2023-2028 (%)
- Data Table on China - Year-over-year growth 2023-2028 (%)
- 9.12 Market opportunity by geography
- Market opportunity By Geographical Landscape($ million)
- Data Tables on Market opportunity By Geographical Landscape($ million)
10 Drivers, Challenges, and Opportunity/Restraints
- 10.1 Market drivers
- 10.2 Market challenges
- 10.3 Impact of drivers and challenges
- Impact of drivers and challenges in 2023 and 2028
- 10.4 Market opportunities/restraints
11 Competitive Landscape
- 11.1 Overview
- 11.2 Competitive Landscape
- Overview on criticality of inputs and factors of differentiation
- 11.3 Landscape disruption
- Overview on factors of disruption
- 11.4 Industry risks
- Impact of key risks on business
12 Competitive Analysis
- 12.1 Companies profiled
- Companies covered
- 12.2 Market positioning of companies
- Matrix on companies position and classification
- 12.3 Aquacert Ltd.
- Aquacert Ltd. - Overview
- Aquacert Ltd. - Product / Service
- Aquacert Ltd. - Key offerings
- 12.4 Becton Dickinson and Co.
- Becton Dickinson and Co. - Overview
- Becton Dickinson and Co. - Business segments
- Becton Dickinson and Co. - Key news
- Becton Dickinson and Co. - Key offerings
- Becton Dickinson and Co. - Segment focus
- 12.5 Bio Rad Laboratories Inc.
- Bio Rad Laboratories Inc. - Overview
- Bio Rad Laboratories Inc. - Business segments
- Bio Rad Laboratories Inc. - Key news
- Bio Rad Laboratories Inc. - Key offerings
- Bio Rad Laboratories Inc. - Segment focus
- 12.6 bioMerieux SA
- bioMerieux SA - Overview
- bioMerieux SA - Product / Service
- bioMerieux SA - Key news
- bioMerieux SA - Key offerings
- 12.7 Eiken Chemical Co. Ltd.
- Eiken Chemical Co. Ltd. - Overview
- Eiken Chemical Co. Ltd. - Product / Service
- Eiken Chemical Co. Ltd. - Key offerings
- 12.8 Element Materials Technology Group Ltd.
- Element Materials Technology Group Ltd. - Overview
- Element Materials Technology Group Ltd. - Product / Service
- Element Materials Technology Group Ltd. - Key offerings
- 12.9 Eurofins Scientific SE
- Eurofins Scientific SE - Overview
- Eurofins Scientific SE - Business segments
- Eurofins Scientific SE - Key news
- Eurofins Scientific SE - Key offerings
- Eurofins Scientific SE - Segment focus
- 12.10 IDEXX LABORATORIES INC.
- IDEXX LABORATORIES INC. - Overview
- IDEXX LABORATORIES INC. - Business segments
- IDEXX LABORATORIES INC. - Key news
- IDEXX LABORATORIES INC. - Key offerings
- IDEXX LABORATORIES INC. - Segment focus
- 12.11 Intertek Group Plc
- Intertek Group Plc - Overview
- Intertek Group Plc - Business segments
- Intertek Group Plc - Key offerings
- Intertek Group Plc - Segment focus
- 12.12 Pro Lab Diagnostics Inc.
- Pro Lab Diagnostics Inc. - Overview
- Pro Lab Diagnostics Inc. - Product / Service
- Pro Lab Diagnostics Inc. - Key offerings
- 12.13 Quidelortho Corp.
- Quidelortho Corp. - Overview
- Quidelortho Corp. - Product / Service
- Quidelortho Corp. - Key news
- Quidelortho Corp. - Key offerings
- 12.14 SGS SA
- SGS SA - Overview
- SGS SA - Business segments
- SGS SA - Key news
- SGS SA - Key offerings
- SGS SA - Segment focus
- 12.15 Thermo Fisher Scientific Inc.
- Thermo Fisher Scientific Inc. - Overview
- Thermo Fisher Scientific Inc. - Business segments
- Thermo Fisher Scientific Inc. - Key news
- Thermo Fisher Scientific Inc. - Key offerings
- Thermo Fisher Scientific Inc. - Segment focus
- 12.16 TUV NORD AG
- TUV NORD AG - Overview
- TUV NORD AG - Business segments
- TUV NORD AG - Key offerings
- TUV NORD AG - Segment focus
- 12.17 UL Solutions Inc.
- UL Solutions Inc. - Overview
- UL Solutions Inc. - Product / Service
- UL Solutions Inc. - Key offerings
13 Appendix
- 13.1 Scope of the report
- 13.2 Inclusions and exclusions checklist
- Inclusions checklist
- Exclusions checklist
- 13.3 Currency conversion rates for US$
- Currency conversion rates for US$
- 13.4 Research methodology
- Research methodology
- 13.5 Data procurement
- Information sources
- 13.6 Data validation
- Data validation
- 13.7 Validation techniques employed for market sizing
- Validation techniques employed for market sizing
- 13.8 Data synthesis
- Data synthesis
- 13.9 market analysis
- market analysis
- 13.10 List of abbreviations
- List of abbreviations

