|
|
市場調査レポート
商品コード
1525052
動物の腸内健康の世界市場 2024-2028Global animal intestinal health market 2024-2028 |
||||||
|
|||||||
カスタマイズ可能
|
|||||||


| 動物の腸内健康の世界市場 2024-2028 |
|
出版日: 2024年07月12日
発行: TechNavio
ページ情報: 英文 162 Pages
納期: 即納可能
|

全表示
- 概要
- 図表
- 目次
動物の腸内健康市場は2023-2028年に17億4,500万米ドル、予測期間中のCAGRは8.24%で成長すると予測されます。
当レポートでは、動物の腸内健康市場の全体的な分析、市場規模・予測、動向、成長促進要因、課題、約25のベンダーを網羅したベンダー分析などを掲載しています。
現在の市場シナリオ、最新動向と促進要因、市場環境全体に関する最新分析を提供しています。市場は、動物の腸の健康に関する意識の高まり、動物加工製品の工業化の増加、飼料サプリメントへのニーズの高まりによって牽引されています。
| 市場範囲 | |
|---|---|
| 基準年 | 2024 |
| 終了年 | 2028 |
| 予測期間 | 2024-2028 |
| 成長モメンタム | 加速 |
| 前年比2024年 | 7.68% |
| CAGR | 8.24% |
| 増分額 | 17億4,500万米ドル |
本調査では、今後数年間の動物の腸内健康市場成長を促進する主な理由の1つとして、天然成長促進剤の採用増加を挙げています。また、研究資金の増加やプレバイオティクスの使用に関連する健康上の利点に関する意識の高まりは、市場の大きな需要につながります。
目次
第1章 エグゼクティブサマリー
- 市場概要
第2章 市場情勢
- 市場エコシステム
- 市場の特徴
- バリューチェーン分析
第3章 市場規模の評価
- 市場の定義
- 市場セグメント分析
- 市場規模 2023
- 市場の見通し 2023-2028
第4章 市場規模実績
- 世界動物の腸内健康市場 2018-2022
- タイプ別セグメント分析 2018-2022
- ソース別セグメント分析 2018-2022
- 地域別セグメント分析 2018-2022
- 国別セグメント分析 2018-2022
第5章 ファイブフォース分析
- ファイブフォースの要約
- 買い手の交渉力
- 供給企業の交渉力
- 新規参入業者の脅威
- 代替品の脅威
- 競争の脅威
- 市況
第6章 市場セグメンテーション:タイプ別
- 市場セグメンテーション
- 比較:タイプ別
- プロバイオティクス:市場規模と予測 2023-2028
- 植物由来成分:市場規模と予測 2023-2028
- プレバイオティクス:市場規模と予測 2023-2028
- 免疫増強薬:市場規模と予測 2023-2028
- 市場機会:タイプ別
第7章 市場セグメンテーション:ソース別
- 市場セグメンテーション
- 比較:ソース別
- 植物由来:市場規模と予測 2023-2028
- 微生物由来:市場規模と予測 2023-2028
- 市場機会:ソース別
第8章 顧客情勢
- 顧客情勢の概要
第9章 地域別情勢
- 地域別セグメンテーション
- 地域別比較
- アジア:市場規模と予測 2023-2028
- 北米:市場規模と予測 2023-2028
- 欧州:市場規模と予測 2023-2028
- 世界のその他の地域:市場規模と予測 2023-2028
- 米国:市場規模と予測 2023-2028
- 中国:市場規模と予測 2023-2028
- インド:市場規模と予測 2023-2028
- ドイツ:市場規模と予測 2023-2028
- 日本:市場規模と予測 2023-2028
- 市場機会:地域情勢別
第10章 促進要因・課題・機会・抑制要因
- 市場促進要因
- 市場の課題
- 促進要因と課題の影響
- 市場の機会・抑制要因
第11章 競合情勢
- 概要
- 競合情勢
- 混乱の状況
- 業界のリスク
第12章 競合分析
- 企業プロファイル
- 企業の市場ポジショニング
- AB Agri Ltd.
- Adisseo Co.
- Agrihealth Ltd.
- Alltech Inc.
- Anco Animal Nutrition Competence
- Archer Daniels Midland Co.
- Arm and Hammer Animal and Food
- Beneo GmbH
- Cargill Inc.
- Chr Hansen Holding AS
- Evonik Industries AG
- International Flavors and Fragrances Inc.
- Koninklijke DSM NV
- Novozymes AS
- Nutreco N.V.
第13章 付録
Exhibits:
- Exhibits1: Executive Summary - Chart on Market Overview
- Exhibits2: Executive Summary - Data Table on Market Overview
- Exhibits3: Executive Summary - Chart on Global Market Characteristics
- Exhibits4: Executive Summary - Chart on Market By Geographical Landscape
- Exhibits5: Executive Summary - Chart on Market Segmentation by Type
- Exhibits6: Executive Summary - Chart on Market Segmentation by Source
- Exhibits7: Executive Summary - Chart on Incremental Growth
- Exhibits8: Executive Summary - Data Table on Incremental Growth
- Exhibits9: Executive Summary - Chart on Company Market Positioning
- Exhibits10: Parent Market
- Exhibits11: Data Table on - Parent Market
- Exhibits12: Market characteristics analysis
- Exhibits13: Value Chain Analysis
- Exhibits14: Offerings of companies included in the market definition
- Exhibits15: Market segments
- Exhibits16: Chart on Global - Market size and forecast 2023-2028 ($ million)
- Exhibits17: Data Table on Global - Market size and forecast 2023-2028 ($ million)
- Exhibits18: Chart on Global Market: Year-over-year growth 2023-2028 (%)
- Exhibits19: Data Table on Global Market: Year-over-year growth 2023-2028 (%)
- Exhibits20: Historic Market Size - Data Table on Global Animal Intestinal Health Market 2018 - 2022 ($ million)
- Exhibits21: Historic Market Size - Type Segment 2018 - 2022 ($ million)
- Exhibits22: Historic Market Size - Source Segment 2018 - 2022 ($ million)
- Exhibits23: Historic Market Size - Geography Segment 2018 - 2022 ($ million)
- Exhibits24: Historic Market Size - Country Segment 2018 - 2022 ($ million)
- Exhibits25: Five forces analysis - Comparison between 2023 and 2028
- Exhibits26: Bargaining power of buyers - Impact of key factors 2023 and 2028
- Exhibits27: Bargaining power of suppliers - Impact of key factors in 2023 and 2028
- Exhibits28: Threat of new entrants - Impact of key factors in 2023 and 2028
- Exhibits29: Threat of substitutes - Impact of key factors in 2023 and 2028
- Exhibits30: Threat of rivalry - Impact of key factors in 2023 and 2028
- Exhibits31: Chart on Market condition - Five forces 2023 and 2028
- Exhibits32: Chart on Type - Market share 2023-2028 (%)
- Exhibits33: Data Table on Type - Market share 2023-2028 (%)
- Exhibits34: Chart on Comparison by Type
- Exhibits35: Data Table on Comparison by Type
- Exhibits36: Chart on Probiotics - Market size and forecast 2023-2028 ($ million)
- Exhibits37: Data Table on Probiotics - Market size and forecast 2023-2028 ($ million)
- Exhibits38: Chart on Probiotics - Year-over-year growth 2023-2028 (%)
- Exhibits39: Data Table on Probiotics - Year-over-year growth 2023-2028 (%)
- Exhibits40: Chart on Phytogenics - Market size and forecast 2023-2028 ($ million)
- Exhibits41: Data Table on Phytogenics - Market size and forecast 2023-2028 ($ million)
- Exhibits42: Chart on Phytogenics - Year-over-year growth 2023-2028 (%)
- Exhibits43: Data Table on Phytogenics - Year-over-year growth 2023-2028 (%)
- Exhibits44: Chart on Prebiotics - Market size and forecast 2023-2028 ($ million)
- Exhibits45: Data Table on Prebiotics - Market size and forecast 2023-2028 ($ million)
- Exhibits46: Chart on Prebiotics - Year-over-year growth 2023-2028 (%)
- Exhibits47: Data Table on Prebiotics - Year-over-year growth 2023-2028 (%)
- Exhibits48: Chart on Immunostimulants - Market size and forecast 2023-2028 ($ million)
- Exhibits49: Data Table on Immunostimulants - Market size and forecast 2023-2028 ($ million)
- Exhibits50: Chart on Immunostimulants - Year-over-year growth 2023-2028 (%)
- Exhibits51: Data Table on Immunostimulants - Year-over-year growth 2023-2028 (%)
- Exhibits52: Market opportunity by Type ($ million)
- Exhibits53: Data Table on Market opportunity by Type ($ million)
- Exhibits54: Chart on Source - Market share 2023-2028 (%)
- Exhibits55: Data Table on Source - Market share 2023-2028 (%)
- Exhibits56: Chart on Comparison by Source
- Exhibits57: Data Table on Comparison by Source
- Exhibits58: Chart on Plant based - Market size and forecast 2023-2028 ($ million)
- Exhibits59: Data Table on Plant based - Market size and forecast 2023-2028 ($ million)
- Exhibits60: Chart on Plant based - Year-over-year growth 2023-2028 (%)
- Exhibits61: Data Table on Plant based - Year-over-year growth 2023-2028 (%)
- Exhibits62: Chart on Microbial - Market size and forecast 2023-2028 ($ million)
- Exhibits63: Data Table on Microbial - Market size and forecast 2023-2028 ($ million)
- Exhibits64: Chart on Microbial - Year-over-year growth 2023-2028 (%)
- Exhibits65: Data Table on Microbial - Year-over-year growth 2023-2028 (%)
- Exhibits66: Market opportunity by Source ($ million)
- Exhibits67: Data Table on Market opportunity by Source ($ million)
- Exhibits68: Analysis of price sensitivity, lifecycle, customer purchase basket, adoption rates, and purchase criteria
- Exhibits69: Chart on Market share By Geographical Landscape 2023-2028 (%)
- Exhibits70: Data Table on Market share By Geographical Landscape 2023-2028 (%)
- Exhibits71: Chart on Geographic comparison
- Exhibits72: Data Table on Geographic comparison
- Exhibits73: Chart on Asia - Market size and forecast 2023-2028 ($ million)
- Exhibits74: Data Table on Asia - Market size and forecast 2023-2028 ($ million)
- Exhibits75: Chart on Asia - Year-over-year growth 2023-2028 (%)
- Exhibits76: Data Table on Asia - Year-over-year growth 2023-2028 (%)
- Exhibits77: Chart on North America - Market size and forecast 2023-2028 ($ million)
- Exhibits78: Data Table on North America - Market size and forecast 2023-2028 ($ million)
- Exhibits79: Chart on North America - Year-over-year growth 2023-2028 (%)
- Exhibits80: Data Table on North America - Year-over-year growth 2023-2028 (%)
- Exhibits81: Chart on Europe - Market size and forecast 2023-2028 ($ million)
- Exhibits82: Data Table on Europe - Market size and forecast 2023-2028 ($ million)
- Exhibits83: Chart on Europe - Year-over-year growth 2023-2028 (%)
- Exhibits84: Data Table on Europe - Year-over-year growth 2023-2028 (%)
- Exhibits85: Chart on Rest of World (ROW) - Market size and forecast 2023-2028 ($ million)
- Exhibits86: Data Table on Rest of World (ROW) - Market size and forecast 2023-2028 ($ million)
- Exhibits87: Chart on Rest of World (ROW) - Year-over-year growth 2023-2028 (%)
- Exhibits88: Data Table on Rest of World (ROW) - Year-over-year growth 2023-2028 (%)
- Exhibits89: Chart on US - Market size and forecast 2023-2028 ($ million)
- Exhibits90: Data Table on US - Market size and forecast 2023-2028 ($ million)
- Exhibits91: Chart on US - Year-over-year growth 2023-2028 (%)
- Exhibits92: Data Table on US - Year-over-year growth 2023-2028 (%)
- Exhibits93: Chart on China - Market size and forecast 2023-2028 ($ million)
- Exhibits94: Data Table on China - Market size and forecast 2023-2028 ($ million)
- Exhibits95: Chart on China - Year-over-year growth 2023-2028 (%)
- Exhibits96: Data Table on China - Year-over-year growth 2023-2028 (%)
- Exhibits97: Chart on India - Market size and forecast 2023-2028 ($ million)
- Exhibits98: Data Table on India - Market size and forecast 2023-2028 ($ million)
- Exhibits99: Chart on India - Year-over-year growth 2023-2028 (%)
- Exhibits100: Data Table on India - Year-over-year growth 2023-2028 (%)
- Exhibits101: Chart on Germany - Market size and forecast 2023-2028 ($ million)
- Exhibits102: Data Table on Germany - Market size and forecast 2023-2028 ($ million)
- Exhibits103: Chart on Germany - Year-over-year growth 2023-2028 (%)
- Exhibits104: Data Table on Germany - Year-over-year growth 2023-2028 (%)
- Exhibits105: Chart on Japan - Market size and forecast 2023-2028 ($ million)
- Exhibits106: Data Table on Japan - Market size and forecast 2023-2028 ($ million)
- Exhibits107: Chart on Japan - Year-over-year growth 2023-2028 (%)
- Exhibits108: Data Table on Japan - Year-over-year growth 2023-2028 (%)
- Exhibits109: Market opportunity By Geographical Landscape ($ million)
- Exhibits110: Data Tables on Market opportunity By Geographical Landscape ($ million)
- Exhibits111: Impact of drivers and challenges in 2023 and 2028
- Exhibits112: Overview on criticality of inputs and factors of differentiation
- Exhibits113: Overview on factors of disruption
- Exhibits114: Impact of key risks on business
- Exhibits115: Companies covered
- Exhibits116: Matrix on companies position and classification
- Exhibits117: AB Agri Ltd. - Overview
- Exhibits118: AB Agri Ltd. - Product / Service
- Exhibits119: AB Agri Ltd. - Key offerings
- Exhibits120: Adisseo Co. - Overview
- Exhibits121: Adisseo Co. - Product / Service
- Exhibits122: Adisseo Co. - Key news
- Exhibits123: Adisseo Co. - Key offerings
- Exhibits124: Agrihealth Ltd. - Overview
- Exhibits125: Agrihealth Ltd. - Product / Service
- Exhibits126: Agrihealth Ltd. - Key offerings
- Exhibits127: Alltech Inc. - Overview
- Exhibits128: Alltech Inc. - Product / Service
- Exhibits129: Alltech Inc. - Key news
- Exhibits130: Alltech Inc. - Key offerings
- Exhibits131: Anco Animal Nutrition Competence - Overview
- Exhibits132: Anco Animal Nutrition Competence - Product / Service
- Exhibits133: Anco Animal Nutrition Competence - Key offerings
- Exhibits134: Archer Daniels Midland Co. - Overview
- Exhibits135: Archer Daniels Midland Co. - Business segments
- Exhibits136: Archer Daniels Midland Co. - Key news
- Exhibits137: Archer Daniels Midland Co. - Key offerings
- Exhibits138: Archer Daniels Midland Co. - Segment focus
- Exhibits139: Arm and Hammer Animal and Food - Overview
- Exhibits140: Arm and Hammer Animal and Food - Product / Service
- Exhibits141: Arm and Hammer Animal and Food - Key offerings
- Exhibits142: Beneo GmbH - Overview
- Exhibits143: Beneo GmbH - Product / Service
- Exhibits144: Beneo GmbH - Key news
- Exhibits145: Beneo GmbH - Key offerings
- Exhibits146: Cargill Inc. - Overview
- Exhibits147: Cargill Inc. - Product / Service
- Exhibits148: Cargill Inc. - Key news
- Exhibits149: Cargill Inc. - Key offerings
- Exhibits150: Chr Hansen Holding AS - Overview
- Exhibits151: Chr Hansen Holding AS - Business segments
- Exhibits152: Chr Hansen Holding AS - Key news
- Exhibits153: Chr Hansen Holding AS - Key offerings
- Exhibits154: Chr Hansen Holding AS - Segment focus
- Exhibits155: Evonik Industries AG - Overview
- Exhibits156: Evonik Industries AG - Business segments
- Exhibits157: Evonik Industries AG - Key news
- Exhibits158: Evonik Industries AG - Key offerings
- Exhibits159: Evonik Industries AG - Segment focus
- Exhibits160: International Flavors and Fragrances Inc. - Overview
- Exhibits161: International Flavors and Fragrances Inc. - Business segments
- Exhibits162: International Flavors and Fragrances Inc. - Key news
- Exhibits163: International Flavors and Fragrances Inc. - Key offerings
- Exhibits164: International Flavors and Fragrances Inc. - Segment focus
- Exhibits165: Koninklijke DSM NV - Overview
- Exhibits166: Koninklijke DSM NV - Business segments
- Exhibits167: Koninklijke DSM NV - Key news
- Exhibits168: Koninklijke DSM NV - Key offerings
- Exhibits169: Koninklijke DSM NV - Segment focus
- Exhibits170: Novozymes AS - Overview
- Exhibits171: Novozymes AS - Product / Service
- Exhibits172: Novozymes AS - Key offerings
- Exhibits173: Nutreco N.V. - Overview
- Exhibits174: Nutreco N.V. - Product / Service
- Exhibits175: Nutreco N.V. - Key offerings
- Exhibits176: Inclusions checklist
- Exhibits177: Exclusions checklist
- Exhibits178: Currency conversion rates for US$
- Exhibits179: Research methodology
- Exhibits180: Information sources
- Exhibits181: Data validation
- Exhibits182: Validation techniques employed for market sizing
- Exhibits183: Data synthesis
- Exhibits184: 360 degree market analysis
- Exhibits185: List of abbreviations
The animal intestinal health market is forecasted to grow by USD 1745 mn during 2023-2028, accelerating at a CAGR of 8.24% during the forecast period. The report on the animal intestinal health market provides a holistic analysis, market size and forecast, trends, growth drivers, and challenges, as well as vendor analysis covering around 25 vendors.
The report offers an up-to-date analysis regarding the current market scenario, the latest trends and drivers, and the overall market environment. The market is driven by rising awareness regarding animals intestinal health, increase in industrialization of animal-processed products, and increasing need for feed supplements.
Technavio's animal intestinal health market is segmented as below:
| Market Scope | |
|---|---|
| Base Year | 2024 |
| End Year | 2028 |
| Series Year | 2024-2028 |
| Growth Momentum | Accelerate |
| YOY 2024 | 7.68% |
| CAGR | 8.24% |
| Incremental Value | $1745mn |
By Type
- Probiotics
- Phytogenics
- Prebiotics
- Immunostimulants
By Source
- Plant based
- Microbial
By Geographical Landscape
- Asia
- North America
- Europe
- Rest of World (ROW)
This study identifies the rise in adoption of natural growth promoters as one of the prime reasons driving the animal intestinal health market growth during the next few years. Also, increase in research funding and increasing awareness regarding health benefits associated with prebiotic use will lead to sizable demand in the market.
The report on the animal intestinal health market covers the following areas:
- Animal intestinal health market sizing
- Animal intestinal health market forecast
- Animal intestinal health market industry analysis
The robust vendor analysis is designed to help clients improve their market position, and in line with this, this report provides a detailed analysis of several leading animal intestinal health market vendors that include AB Agri Ltd., Adisseo Co., Agrihealth Ltd., Alltech Inc., Anco Animal Nutrition Competence, Archer Daniels Midland Co., Arm and Hammer Animal and Food, Beneo GmbH, Cargill Inc., Chr Hansen Holding AS, DR. Eckel Animal Nutrition, Evonik Industries AG, International Flavors and Fragrances Inc., Kemin Industries Inc., Koninklijke DSM NV, Land O Lakes Inc., Lesaffre and Cie, Novozymes AS, Nutreco N.V., and Unique Biotech Ltd.. Also, the animal intestinal health market analysis report includes information on upcoming trends and challenges that will influence market growth. This is to help companies strategize and leverage all forthcoming growth opportunities.
The study was conducted using an objective combination of primary and secondary information including inputs from key participants in the industry. The report contains a comprehensive market and vendor landscape in addition to an analysis of the key vendors.
The publisher presents a detailed picture of the market by the way of study, synthesis, and summation of data from multiple sources by an analysis of key parameters such as profit, pricing, competition, and promotions. It presents various market facets by identifying the key industry influencers. The data presented is comprehensive, reliable, and a result of extensive research - both primary and secondary. The market research reports provide a complete competitive landscape and an in-depth vendor selection methodology and analysis using qualitative and quantitative research to forecast the accurate market growth.
Table of Contents
1 Executive Summary
- 1.1 Market overview
- Executive Summary - Chart on Market Overview
- Executive Summary - Data Table on Market Overview
- Executive Summary - Chart on Global Market Characteristics
- Executive Summary - Chart on Market By Geographical Landscape
- Executive Summary - Chart on Market Segmentation by Type
- Executive Summary - Chart on Market Segmentation by Source
- Executive Summary - Chart on Incremental Growth
- Executive Summary - Data Table on Incremental Growth
- Executive Summary - Chart on Company Market Positioning
2 Market Landscape
- 2.1 Market ecosystem
- Parent Market
- Data Table on - Parent Market
- 2.2 Market characteristics
- Market characteristics analysis
- 2.3 Value chain analysis
- Value Chain Analysis
3 Market Sizing
- 3.1 Market definition
- Offerings of companies included in the market definition
- 3.2 Market segment analysis
- Market segments
- 3.3 Market size 2023
- 3.4 Market outlook: Forecast for 2023-2028
- Chart on Global - Market size and forecast 2023-2028 ($ million)
- Data Table on Global - Market size and forecast 2023-2028 ($ million)
- Chart on Global Market: Year-over-year growth 2023-2028 (%)
- Data Table on Global Market: Year-over-year growth 2023-2028 (%)
4 Historic Market Size
- 4.1 Global Animal Intestinal Health Market 2018 - 2022
- Historic Market Size - Data Table on Global Animal Intestinal Health Market 2018 - 2022 ($ million)
- 4.2 Type segment analysis 2018 - 2022
- Historic Market Size - Type Segment 2018 - 2022 ($ million)
- 4.3 Source segment analysis 2018 - 2022
- Historic Market Size - Source Segment 2018 - 2022 ($ million)
- 4.4 Geography segment analysis 2018 - 2022
- Historic Market Size - Geography Segment 2018 - 2022 ($ million)
- 4.5 Country segment analysis 2018 - 2022
- Historic Market Size - Country Segment 2018 - 2022 ($ million)
5 Five Forces Analysis
- 5.1 Five forces summary
- Five forces analysis - Comparison between 2023 and 2028
- 5.2 Bargaining power of buyers
- Bargaining power of buyers - Impact of key factors 2023 and 2028
- 5.3 Bargaining power of suppliers
- Bargaining power of suppliers - Impact of key factors in 2023 and 2028
- 5.4 Threat of new entrants
- Threat of new entrants - Impact of key factors in 2023 and 2028
- 5.5 Threat of substitutes
- Threat of substitutes - Impact of key factors in 2023 and 2028
- 5.6 Threat of rivalry
- Threat of rivalry - Impact of key factors in 2023 and 2028
- 5.7 Market condition
- Chart on Market condition - Five forces 2023 and 2028
6 Market Segmentation by Type
- 6.1 Market segments
- Chart on Type - Market share 2023-2028 (%)
- Data Table on Type - Market share 2023-2028 (%)
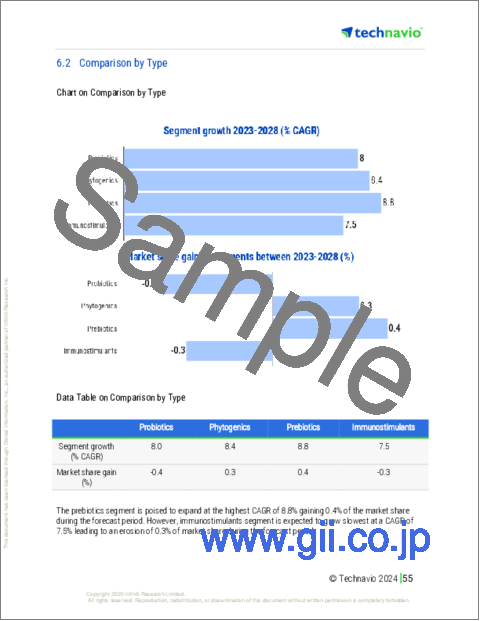
- 6.2 Comparison by Type
- Chart on Comparison by Type
- Data Table on Comparison by Type
- 6.3 Probiotics - Market size and forecast 2023-2028
- Chart on Probiotics - Market size and forecast 2023-2028 ($ million)
- Data Table on Probiotics - Market size and forecast 2023-2028 ($ million)
- Chart on Probiotics - Year-over-year growth 2023-2028 (%)
- Data Table on Probiotics - Year-over-year growth 2023-2028 (%)
- 6.4 Phytogenics - Market size and forecast 2023-2028
- Chart on Phytogenics - Market size and forecast 2023-2028 ($ million)
- Data Table on Phytogenics - Market size and forecast 2023-2028 ($ million)
- Chart on Phytogenics - Year-over-year growth 2023-2028 (%)
- Data Table on Phytogenics - Year-over-year growth 2023-2028 (%)
- 6.5 Prebiotics - Market size and forecast 2023-2028
- Chart on Prebiotics - Market size and forecast 2023-2028 ($ million)
- Data Table on Prebiotics - Market size and forecast 2023-2028 ($ million)
- Chart on Prebiotics - Year-over-year growth 2023-2028 (%)
- Data Table on Prebiotics - Year-over-year growth 2023-2028 (%)
- 6.6 Immunostimulants - Market size and forecast 2023-2028
- Chart on Immunostimulants - Market size and forecast 2023-2028 ($ million)
- Data Table on Immunostimulants - Market size and forecast 2023-2028 ($ million)
- Chart on Immunostimulants - Year-over-year growth 2023-2028 (%)
- Data Table on Immunostimulants - Year-over-year growth 2023-2028 (%)
- 6.7 Market opportunity by Type
- Market opportunity by Type ($ million)
- Data Table on Market opportunity by Type ($ million)
7 Market Segmentation by Source
- 7.1 Market segments
- Chart on Source - Market share 2023-2028 (%)
- Data Table on Source - Market share 2023-2028 (%)
- 7.2 Comparison by Source
- Chart on Comparison by Source
- Data Table on Comparison by Source
- 7.3 Plant based - Market size and forecast 2023-2028
- Chart on Plant based - Market size and forecast 2023-2028 ($ million)
- Data Table on Plant based - Market size and forecast 2023-2028 ($ million)
- Chart on Plant based - Year-over-year growth 2023-2028 (%)
- Data Table on Plant based - Year-over-year growth 2023-2028 (%)
- 7.4 Microbial - Market size and forecast 2023-2028
- Chart on Microbial - Market size and forecast 2023-2028 ($ million)
- Data Table on Microbial - Market size and forecast 2023-2028 ($ million)
- Chart on Microbial - Year-over-year growth 2023-2028 (%)
- Data Table on Microbial - Year-over-year growth 2023-2028 (%)
- 7.5 Market opportunity by Source
- Market opportunity by Source ($ million)
- Data Table on Market opportunity by Source ($ million)
8 Customer Landscape
- 8.1 Customer landscape overview
- Analysis of price sensitivity, lifecycle, customer purchase basket, adoption rates, and purchase criteria
9 Geographic Landscape
- 9.1 Geographic segmentation
- Chart on Market share By Geographical Landscape 2023-2028 (%)
- Data Table on Market share By Geographical Landscape 2023-2028 (%)
- 9.2 Geographic comparison
- Chart on Geographic comparison
- Data Table on Geographic comparison
- 9.3 Asia - Market size and forecast 2023-2028
- Chart on Asia - Market size and forecast 2023-2028 ($ million)
- Data Table on Asia - Market size and forecast 2023-2028 ($ million)
- Chart on Asia - Year-over-year growth 2023-2028 (%)
- Data Table on Asia - Year-over-year growth 2023-2028 (%)
- 9.4 North America - Market size and forecast 2023-2028
- Chart on North America - Market size and forecast 2023-2028 ($ million)
- Data Table on North America - Market size and forecast 2023-2028 ($ million)
- Chart on North America - Year-over-year growth 2023-2028 (%)
- Data Table on North America - Year-over-year growth 2023-2028 (%)
- 9.5 Europe - Market size and forecast 2023-2028
- Chart on Europe - Market size and forecast 2023-2028 ($ million)
- Data Table on Europe - Market size and forecast 2023-2028 ($ million)
- Chart on Europe - Year-over-year growth 2023-2028 (%)
- Data Table on Europe - Year-over-year growth 2023-2028 (%)
- 9.6 Rest of World (ROW) - Market size and forecast 2023-2028
- Chart on Rest of World (ROW) - Market size and forecast 2023-2028 ($ million)
- Data Table on Rest of World (ROW) - Market size and forecast 2023-2028 ($ million)
- Chart on Rest of World (ROW) - Year-over-year growth 2023-2028 (%)
- Data Table on Rest of World (ROW) - Year-over-year growth 2023-2028 (%)
- 9.7 US - Market size and forecast 2023-2028
- Chart on US - Market size and forecast 2023-2028 ($ million)
- Data Table on US - Market size and forecast 2023-2028 ($ million)
- Chart on US - Year-over-year growth 2023-2028 (%)
- Data Table on US - Year-over-year growth 2023-2028 (%)
- 9.8 China - Market size and forecast 2023-2028
- Chart on China - Market size and forecast 2023-2028 ($ million)
- Data Table on China - Market size and forecast 2023-2028 ($ million)
- Chart on China - Year-over-year growth 2023-2028 (%)
- Data Table on China - Year-over-year growth 2023-2028 (%)
- 9.9 India - Market size and forecast 2023-2028
- Chart on India - Market size and forecast 2023-2028 ($ million)
- Data Table on India - Market size and forecast 2023-2028 ($ million)
- Chart on India - Year-over-year growth 2023-2028 (%)
- Data Table on India - Year-over-year growth 2023-2028 (%)
- 9.10 Germany - Market size and forecast 2023-2028
- Chart on Germany - Market size and forecast 2023-2028 ($ million)
- Data Table on Germany - Market size and forecast 2023-2028 ($ million)
- Chart on Germany - Year-over-year growth 2023-2028 (%)
- Data Table on Germany - Year-over-year growth 2023-2028 (%)
- 9.11 Japan - Market size and forecast 2023-2028
- Chart on Japan - Market size and forecast 2023-2028 ($ million)
- Data Table on Japan - Market size and forecast 2023-2028 ($ million)
- Chart on Japan - Year-over-year growth 2023-2028 (%)
- Data Table on Japan - Year-over-year growth 2023-2028 (%)
- 9.12 Market opportunity By Geographical Landscape
- Market opportunity By Geographical Landscape ($ million)
- Data Tables on Market opportunity By Geographical Landscape ($ million)
10 Drivers, Challenges, and Opportunity/Restraints
- 10.1 Market drivers
- 10.2 Market challenges
- 10.3 Impact of drivers and challenges
- Impact of drivers and challenges in 2023 and 2028
- 10.4 Market opportunities/restraints
11 Competitive Landscape
- 11.1 Overview
- 11.2 Competitive Landscape
- Overview on criticality of inputs and factors of differentiation
- 11.3 Landscape disruption
- Overview on factors of disruption
- 11.4 Industry risks
- Impact of key risks on business
12 Competitive Analysis
- 12.1 Companies profiled
- Companies covered
- 12.2 Market positioning of companies
- Matrix on companies position and classification
- 12.3 AB Agri Ltd.
- AB Agri Ltd. - Overview
- AB Agri Ltd. - Product / Service
- AB Agri Ltd. - Key offerings
- 12.4 Adisseo Co.
- Adisseo Co. - Overview
- Adisseo Co. - Product / Service
- Adisseo Co. - Key news
- Adisseo Co. - Key offerings
- 12.5 Agrihealth Ltd.
- Agrihealth Ltd. - Overview
- Agrihealth Ltd. - Product / Service
- Agrihealth Ltd. - Key offerings
- 12.6 Alltech Inc.
- Alltech Inc. - Overview
- Alltech Inc. - Product / Service
- Alltech Inc. - Key news
- Alltech Inc. - Key offerings
- 12.7 Anco Animal Nutrition Competence
- Anco Animal Nutrition Competence - Overview
- Anco Animal Nutrition Competence - Product / Service
- Anco Animal Nutrition Competence - Key offerings
- 12.8 Archer Daniels Midland Co.
- Archer Daniels Midland Co. - Overview
- Archer Daniels Midland Co. - Business segments
- Archer Daniels Midland Co. - Key news
- Archer Daniels Midland Co. - Key offerings
- Archer Daniels Midland Co. - Segment focus
- 12.9 Arm and Hammer Animal and Food
- Arm and Hammer Animal and Food - Overview
- Arm and Hammer Animal and Food - Product / Service
- Arm and Hammer Animal and Food - Key offerings
- 12.10 Beneo GmbH
- Beneo GmbH - Overview
- Beneo GmbH - Product / Service
- Beneo GmbH - Key news
- Beneo GmbH - Key offerings
- 12.11 Cargill Inc.
- Cargill Inc. - Overview
- Cargill Inc. - Product / Service
- Cargill Inc. - Key news
- Cargill Inc. - Key offerings
- 12.12 Chr Hansen Holding AS
- Chr Hansen Holding AS - Overview
- Chr Hansen Holding AS - Business segments
- Chr Hansen Holding AS - Key news
- Chr Hansen Holding AS - Key offerings
- Chr Hansen Holding AS - Segment focus
- 12.13 Evonik Industries AG
- Evonik Industries AG - Overview
- Evonik Industries AG - Business segments
- Evonik Industries AG - Key news
- Evonik Industries AG - Key offerings
- Evonik Industries AG - Segment focus
- 12.14 International Flavors and Fragrances Inc.
- International Flavors and Fragrances Inc. - Overview
- International Flavors and Fragrances Inc. - Business segments
- International Flavors and Fragrances Inc. - Key news
- International Flavors and Fragrances Inc. - Key offerings
- International Flavors and Fragrances Inc. - Segment focus
- 12.15 Koninklijke DSM NV
- Koninklijke DSM NV - Overview
- Koninklijke DSM NV - Business segments
- Koninklijke DSM NV - Key news
- Koninklijke DSM NV - Key offerings
- Koninklijke DSM NV - Segment focus
- 12.16 Novozymes AS
- Novozymes AS - Overview
- Novozymes AS - Product / Service
- Novozymes AS - Key offerings
- 12.17 Nutreco N.V.
- Nutreco N.V. - Overview
- Nutreco N.V. - Product / Service
- Nutreco N.V. - Key offerings
13 Appendix
- 13.1 Scope of the report
- 13.2 Inclusions and exclusions checklist
- Inclusions checklist
- Exclusions checklist
- 13.3 Currency conversion rates for US$
- Currency conversion rates for US$
- 13.4 Research methodology
- Research methodology
- 13.5 Data procurement
- Information sources
- 13.6 Data validation
- Data validation
- 13.7 Validation techniques employed for market sizing
- Validation techniques employed for market sizing
- 13.8 Data synthesis
- Data synthesis
- 13.9 360 degree market analysis
- 360 degree market analysis
- 13.10 List of abbreviations
- List of abbreviations

