|
|
市場調査レポート
商品コード
1144433
リン化インジウム(InP)ウエハーの世界市場 2022-2026Global Indium Phosphide (InP) Wafers Market 2022-2026 |
||||||
|
|
|||||||
|
● お客様のご希望に応じて、既存データの加工や未掲載情報(例:国別セグメント)の追加などの対応が可能です。 詳細はお問い合わせください。 |
|||||||


| リン化インジウム(InP)ウエハーの世界市場 2022-2026 |
|
出版日: 2022年09月30日
発行: TechNavio
ページ情報: 英文 120 Pages
納期: 即納可能
|
- 全表示
- 概要
- 図表
- 目次
当レポートではリン化インジウム(InP)ウエハーの市場規模は、2022年から2026年の間に1億690万米ドルの増加が見込まれ、予測期間中に13.57%のCAGRで成長すると予測しています。当レポートでは、リン化インジウム(InP)ウエハー市場の全体分析、市場規模と予測、動向、成長促進要因・課題、約25社のベンダーを網羅したベンダー分析を行っています。
現在の世界の市場動向と促進要因、市場環境全体に関する最新の分析を提供しています。
市場は、スマートフォンやタブレットの普及、民生用電子製品の売上の急増、車載用レーザーイメージング・検出・測距(LiDAR)、3Dセンシング、民生用ウェアラブルの製造におけるINPウエハーの採用増加によって活性化されています。
本調査では、今後数年間のリン化インジウム(InP)ウエハー市場の成長を促進する主要な理由の一つとして、ファブレス半導体企業の増加やM&Aを挙げています。また、5Gの登場とデータコム産業の継続的拡大、高度なオプトエレクトロニクスデバイスと光ファイバー通信の利用が、市場の大きな需要につながると考えています。
目次
第1章 エグゼクティブサマリー
- 市場概要
第2章 市場情勢
- 市場エコシステム
第3章 市場規模
- 市場の定義
- 市場セグメント分析
- 市場規模 2021
- 市場の見通し:2021-2026年の予測
第4章 ファイブフォース分析
- ファイブフォースの要約
- 買い手の交渉力
- 供給企業の交渉力
- 新規参入業者の脅威
- 代替品の脅威
- 競争の脅威
- 市況
第5章 用途別の市場セグメンテーション
- 市場内訳
- 用途別比較
- 通信 - 市場規模と予測 2021-2026
- ヘルスケア - 市場規模と予測 2021-2026
- 医薬品 - 市場規模と予測 2021-2026
- 軍事および防衛 - 市場規模と予測 2021-2026
- その他 - 市場規模と予測 2021-2026
- 用途別の市場機会
第6章 タイプ別の市場セグメンテーション
- 市場内訳
- タイプ別比較
- 100 mmまたは4インチ以上 - 市場規模と予測 2021-2026
- 76.2 mmまたは3インチ - 市場規模と予測 2021-2026
- 50.8 mmまたは2インチ - 市場規模と予測 2021-2026
- タイプ別の市場機会
第7章 顧客情勢
- 顧客情勢の概要
第8章 地域別情勢
- 地域別セグメンテーション
- 地域別比較
- APAC - 市場規模と予測 2021-2026
- 北米 - 市場規模と予測 2021-2026
- 欧州 - 市場規模と予測 2021-2026
- 中東およびアフリカ - 市場規模と予測 2021-2026
- 南米 - 市場規模と予測 2021-2026
- 中国 - 市場規模と予測 2021-2026
- 米国 - 市場規模と予測 2021-2026
- 日本 - 市場規模と予測 2021-2026
- ドイツ - 市場規模と予測 2021-2026
- 韓国 - 市場規模と予測 2021-2026
- 地域情勢別の市場機会
第9章 促進要因、課題、および動向
- 市場促進要因
- 市場の課題
- 促進要因と課題の影響
- 市場動向
第10章 ベンダー情勢
- 概要
- ベンダー情勢
- 混乱の状況
- 業界のリスク
第11章 ベンダー分析
- 対象ベンダー
- ベンダーの市場ポジショニング
- American Elements
- AXT Inc.
- JX Nippon Mining and Metals Corp.
- Logitech Ltd.
- NANOGRAFI Co. Inc.
- Semiconductor Wafer Inc.
- Sumitomo Electric Industries Ltd.
- Wafer World Inc.
- Western Minmetals SC Corp.
- Xiamen Powerway Advanced Material Co. Ltd.
第12章 付録
Exhibits:
- Exhibits1: Executive Summary - Chart on Market Overview
- Exhibits2: Executive Summary - Data Table on Market Overview
- Exhibits3: Executive Summary - Chart on Global Market Characteristics
- Exhibits4: Executive Summary - Chart on Market By Geographical Landscape
- Exhibits5: Executive Summary - Chart on Market Segmentation by Application
- Exhibits6: Executive Summary - Chart on Market Segmentation by Type
- Exhibits7: Executive Summary - Chart on Incremental Growth
- Exhibits8: Executive Summary - Data Table on Incremental Growth
- Exhibits9: Executive Summary - Chart on Vendor Market Positioning
- Exhibits10: Parent market
- Exhibits11: Market Characteristics
- Exhibits12: Offerings of vendors included in the market definition
- Exhibits13: Market segments
- Exhibits14: Chart on Global - Market size and forecast 2021-2026 ($ million)
- Exhibits15: Data Table on Global - Market size and forecast 2021-2026 ($ million)
- Exhibits16: Chart on Global Market: Year-over-year growth 2021-2026 (%)
- Exhibits17: Data Table on Global Market: Year-over-year growth 2021-2026 (%)
- Exhibits18: Five forces analysis - Comparison between 2021 and 2026
- Exhibits19: Chart on Bargaining power of buyers - Impact of key factors 2021 and 2026
- Exhibits20: Bargaining power of suppliers - Impact of key factors in 2021 and 2026
- Exhibits21: Threat of new entrants - Impact of key factors in 2021 and 2026
- Exhibits22: Threat of substitutes - Impact of key factors in 2021 and 2026
- Exhibits23: Threat of rivalry - Impact of key factors in 2021 and 2026
- Exhibits24: Chart on Market condition - Five forces 2021 and 2026
- Exhibits25: Chart on Application - Market share 2021-2026 (%)
- Exhibits26: Data Table on Application - Market share 2021-2026 (%)
- Exhibits27: Chart on Comparison by Application
- Exhibits28: Data Table on Comparison by Application
- Exhibits29: Chart on Telecommunication - Market size and forecast 2021-2026 ($ million)
- Exhibits30: Data Table on Telecommunication - Market size and forecast 2021-2026 ($ million)
- Exhibits31: Chart on Telecommunication - Year-over-year growth 2021-2026 (%)
- Exhibits32: Data Table on Telecommunication - Year-over-year growth 2021-2026 (%)
- Exhibits33: Chart on Healthcare - Market size and forecast 2021-2026 ($ million)
- Exhibits34: Data Table on Healthcare - Market size and forecast 2021-2026 ($ million)
- Exhibits35: Chart on Healthcare - Year-over-year growth 2021-2026 (%)
- Exhibits36: Data Table on Healthcare - Year-over-year growth 2021-2026 (%)
- Exhibits37: Chart on Pharmaceuticals - Market size and forecast 2021-2026 ($ million)
- Exhibits38: Data Table on Pharmaceuticals - Market size and forecast 2021-2026 ($ million)
- Exhibits39: Chart on Pharmaceuticals - Year-over-year growth 2021-2026 (%)
- Exhibits40: Data Table on Pharmaceuticals - Year-over-year growth 2021-2026 (%)
- Exhibits41: Chart on Military and defense - Market size and forecast 2021-2026 ($ million)
- Exhibits42: Data Table on Military and defense - Market size and forecast 2021-2026 ($ million)
- Exhibits43: Chart on Military and defense - Year-over-year growth 2021-2026 (%)
- Exhibits44: Data Table on Military and defense - Year-over-year growth 2021-2026 (%)
- Exhibits45: Chart on Others - Market size and forecast 2021-2026 ($ million)
- Exhibits46: Data Table on Others - Market size and forecast 2021-2026 ($ million)
- Exhibits47: Chart on Others - Year-over-year growth 2021-2026 (%)
- Exhibits48: Data Table on Others - Year-over-year growth 2021-2026 (%)
- Exhibits49: Market opportunity by Application ($ million)
- Exhibits50: Chart on Type - Market share 2021-2026 (%)
- Exhibits51: Data Table on Type - Market share 2021-2026 (%)
- Exhibits52: Chart on Comparison by Type
- Exhibits53: Data Table on Comparison by Type
- Exhibits54: Chart on 100 mm or 4 inches and above - Market size and forecast 2021-2026 ($ million)
- Exhibits55: Data Table on 100 mm or 4 inches and above - Market size and forecast 2021-2026 ($ million)
- Exhibits56: Chart on 100 mm or 4 inches and above - Year-over-year growth 2021-2026 (%)
- Exhibits57: Data Table on 100 mm or 4 inches and above - Year-over-year growth 2021-2026 (%)
- Exhibits58: Chart on 76.2 mm or 3 inches - Market size and forecast 2021-2026 ($ million)
- Exhibits59: Data Table on 76.2 mm or 3 inches - Market size and forecast 2021-2026 ($ million)
- Exhibits60: Chart on 76.2 mm or 3 inches - Year-over-year growth 2021-2026 (%)
- Exhibits61: Data Table on 76.2 mm or 3 inches - Year-over-year growth 2021-2026 (%)
- Exhibits62: Chart on 50.8 mm or 2 inches - Market size and forecast 2021-2026 ($ million)
- Exhibits63: Data Table on 50.8 mm or 2 inches - Market size and forecast 2021-2026 ($ million)
- Exhibits64: Chart on 50.8 mm or 2 inches - Year-over-year growth 2021-2026 (%)
- Exhibits65: Data Table on 50.8 mm or 2 inches - Year-over-year growth 2021-2026 (%)
- Exhibits66: Market opportunity by Type ($ million)
- Exhibits67: Analysis of price sensitivity, lifecycle, customer purchase basket, adoption rates, and purchase criteria
- Exhibits68: Chart on Market share By Geographical Landscape 2021-2026 (%)
- Exhibits69: Data Table on Market share By Geographical Landscape 2021-2026 (%)
- Exhibits70: Chart on Geographic comparison
- Exhibits71: Data Table on Geographic comparison
- Exhibits72: Chart on APAC - Market size and forecast 2021-2026 ($ million)
- Exhibits73: Data Table on APAC - Market size and forecast 2021-2026 ($ million)
- Exhibits74: Chart on APAC - Year-over-year growth 2021-2026 (%)
- Exhibits75: Data Table on APAC - Year-over-year growth 2021-2026 (%)
- Exhibits76: Chart on North America - Market size and forecast 2021-2026 ($ million)
- Exhibits77: Data Table on North America - Market size and forecast 2021-2026 ($ million)
- Exhibits78: Chart on North America - Year-over-year growth 2021-2026 (%)
- Exhibits79: Data Table on North America - Year-over-year growth 2021-2026 (%)
- Exhibits80: Chart on Europe - Market size and forecast 2021-2026 ($ million)
- Exhibits81: Data Table on Europe - Market size and forecast 2021-2026 ($ million)
- Exhibits82: Chart on Europe - Year-over-year growth 2021-2026 (%)
- Exhibits83: Data Table on Europe - Year-over-year growth 2021-2026 (%)
- Exhibits84: Chart on Middle East and Africa - Market size and forecast 2021-2026 ($ million)
- Exhibits85: Data Table on Middle East and Africa - Market size and forecast 2021-2026 ($ million)
- Exhibits86: Chart on Middle East and Africa - Year-over-year growth 2021-2026 (%)
- Exhibits87: Data Table on Middle East and Africa - Year-over-year growth 2021-2026 (%)
- Exhibits88: Chart on South America - Market size and forecast 2021-2026 ($ million)
- Exhibits89: Data Table on South America - Market size and forecast 2021-2026 ($ million)
- Exhibits90: Chart on South America - Year-over-year growth 2021-2026 (%)
- Exhibits91: Data Table on South America - Year-over-year growth 2021-2026 (%)
- Exhibits92: Chart on China - Market size and forecast 2021-2026 ($ million)
- Exhibits93: Data Table on China - Market size and forecast 2021-2026 ($ million)
- Exhibits94: Chart on China - Year-over-year growth 2021-2026 (%)
- Exhibits95: Data Table on China - Year-over-year growth 2021-2026 (%)
- Exhibits96: Chart on US - Market size and forecast 2021-2026 ($ million)
- Exhibits97: Data Table on US - Market size and forecast 2021-2026 ($ million)
- Exhibits98: Chart on US - Year-over-year growth 2021-2026 (%)
- Exhibits99: Data Table on US - Year-over-year growth 2021-2026 (%)
- Exhibits100: Chart on Japan - Market size and forecast 2021-2026 ($ million)
- Exhibits101: Data Table on Japan - Market size and forecast 2021-2026 ($ million)
- Exhibits102: Chart on Japan - Year-over-year growth 2021-2026 (%)
- Exhibits103: Data Table on Japan - Year-over-year growth 2021-2026 (%)
- Exhibits104: Chart on Germany - Market size and forecast 2021-2026 ($ million)
- Exhibits105: Data Table on Germany - Market size and forecast 2021-2026 ($ million)
- Exhibits106: Chart on Germany - Year-over-year growth 2021-2026 (%)
- Exhibits107: Data Table on Germany - Year-over-year growth 2021-2026 (%)
- Exhibits108: Chart on South Korea - Market size and forecast 2021-2026 ($ million)
- Exhibits109: Data Table on South Korea - Market size and forecast 2021-2026 ($ million)
- Exhibits110: Chart on South Korea - Year-over-year growth 2021-2026 (%)
- Exhibits111: Data Table on South Korea - Year-over-year growth 2021-2026 (%)
- Exhibits112: Market opportunity By Geographical Landscape ($ million)
- Exhibits113: Impact of drivers and challenges in 2021 and 2026
- Exhibits114: Overview on Criticality of inputs and Factors of differentiation
- Exhibits115: Overview on factors of disruption
- Exhibits116: Impact of key risks on business
- Exhibits117: Vendors covered
- Exhibits118: Matrix on vendor position and classification
- Exhibits119: American Elements - Overview
- Exhibits120: American Elements - Product / Service
- Exhibits121: American Elements - Key offerings
- Exhibits122: AXT Inc. - Overview
- Exhibits123: AXT Inc. - Product / Service
- Exhibits124: AXT Inc. - Key offerings
- Exhibits125: JX Nippon Mining and Metals Corp. - Overview
- Exhibits126: JX Nippon Mining and Metals Corp. - Product / Service
- Exhibits127: JX Nippon Mining and Metals Corp. - Key offerings
- Exhibits128: Logitech Ltd. - Overview
- Exhibits129: Logitech Ltd. - Product / Service
- Exhibits130: Logitech Ltd. - Key offerings
- Exhibits131: NANOGRAFI Co. Inc. - Overview
- Exhibits132: NANOGRAFI Co. Inc. - Product / Service
- Exhibits133: NANOGRAFI Co. Inc. - Key offerings
- Exhibits134: Semiconductor Wafer Inc. - Overview
- Exhibits135: Semiconductor Wafer Inc. - Product / Service
- Exhibits136: Semiconductor Wafer Inc. - Key offerings
- Exhibits137: Sumitomo Electric Industries Ltd. - Overview
- Exhibits138: Sumitomo Electric Industries Ltd. - Business segments
- Exhibits139: Sumitomo Electric Industries Ltd. - Key offerings
- Exhibits140: Sumitomo Electric Industries Ltd. - Segment focus
- Exhibits141: Wafer World Inc. - Overview
- Exhibits142: Wafer World Inc. - Product / Service
- Exhibits143: Wafer World Inc. - Key offerings
- Exhibits144: Western Minmetals SC Corp. - Overview
- Exhibits145: Western Minmetals SC Corp. - Product / Service
- Exhibits146: Western Minmetals SC Corp. - Key offerings
- Exhibits147: Xiamen Powerway Advanced Material Co. Ltd. - Overview
- Exhibits148: Xiamen Powerway Advanced Material Co. Ltd. - Product / Service
- Exhibits149: Xiamen Powerway Advanced Material Co. Ltd. - Key offerings
- Exhibits150: Inclusions checklist
- Exhibits151: Exclusions checklist
- Exhibits152: Currency conversion rates for US$
- Exhibits153: Research methodology
- Exhibits154: Validation techniques employed for market sizing
- Exhibits155: Information sources
- Exhibits156: List of abbreviations
Technavio has been monitoring the indium phosphide (InP) wafers market and it is poised to grow by $106.9 mn during 2022-2026, decelerating at a CAGR of 13.57% during the forecast period. Our report on the indium phosphide (InP) wafers market provides a holistic analysis, market size and forecast, trends, growth drivers, and challenges, as well as vendor analysis covering around 25 vendors.
The report offers an up-to-date analysis regarding the current global market scenario, latest trends and drivers, and the overall market environment. The market is driven by rising adoption of smartphones and tablets, rapid growth in sales of consumer electronic products, and the rising adoption of INP wafers in manufacturing of laser imaging, detection, and ranging (LiDAR) for automotive, 3D sensing, and consumer wearables.
The indium phosphide (InP) wafers market analysis includes the application and type segments and geographic landscape.
Technavio's indium phosphide (InP) wafers market is segmented as below:
By Application
- Telecommunication
- Healthcare
- Pharmaceuticals
- Military and defense
- Others
By Type
100 mm or 4 inches and above
- 76.2 mm or 3 inches
- 50.8 mm or 2 inches
By Geographical Landscape
- APAC
- North America
- Europe
- The Middle East and Africa
- South America
This study identifies the increase in the number of fabless semiconductor companies and M&A as one of the prime reasons driving the indium phosphide (InP) wafers market growth during the next few years. Also, the advent of 5G and continued expansion of datacom industry and usage of advanced optoelectronics devices and fiber optic communications will lead to sizable demand in the market.
Technavio presents a detailed picture of the market by the way of study, synthesis, and summation of data from multiple sources by an analysis of key parameters. Our report on the indium phosphide (InP) wafers market covers the following areas:
- Indium phosphide (InP) wafers market sizing
- Indium phosphide (InP) wafers market forecast
- Indium phosphide (InP) wafers market industry analysis
Technavio's robust vendor analysis is designed to help clients improve their market position, and in line with this, this report provides a detailed analysis of several leading indium phosphide (InP) wafers market vendors that include Advanced Engineering Materials Ltd., American Elements, AXT Inc., Broadcom Inc., DingTen Industrial Inc., Engis Corp., Gelest Inc., InPACT, IQE Plc, JX Nippon Mining and Metals Corp., Logitech Ltd., NANOGRAFI Co. Inc., Reade International Corp., Semiconductor Wafer Inc., Stanford Advanced Materials, Sumitomo Electric Industries Ltd., Vital Materials Co. Ltd., Wafer World Inc., Western Minmetals SC Corp., and Xiamen Powerway Advanced Material Co. Ltd. Also, the indium phosphide (InP) wafers market analysis report includes information on upcoming trends and challenges that will influence market growth. This is to help companies strategize and leverage all forthcoming growth opportunities.
The study was conducted using an objective combination of primary and secondary information including inputs from key participants in the industry. The report contains a comprehensive market and vendor landscape in addition to an analysis of the key vendors.
Technavio presents a detailed picture of the market by the way of study, synthesis, and summation of data from multiple sources by an analysis of key parameters such as profit, pricing, competition, and promotions. It presents various market facets by identifying the key industry influencers. The data presented is comprehensive, reliable, and a result of extensive research - both primary and secondary. Technavio's market research reports provide a complete competitive landscape and an in-depth vendor selection methodology and analysis using qualitative and quantitative research to forecast accurate market growth.
Table of Contents
1 Executive Summary
- 1.1 Market overview
- Exhibit 01: Executive Summary - Chart on Market Overview
- Exhibit 02: Executive Summary - Data Table on Market Overview
- Exhibit 03: Executive Summary - Chart on Global Market Characteristics
- Exhibit 04: Executive Summary - Chart on Market By Geographical Landscape
- Exhibit 05: Executive Summary - Chart on Market Segmentation by Application
- Exhibit 06: Executive Summary - Chart on Market Segmentation by Type
- Exhibit 07: Executive Summary - Chart on Incremental Growth
- Exhibit 08: Executive Summary - Data Table on Incremental Growth
- Exhibit 09: Executive Summary - Chart on Vendor Market Positioning
2 Market Landscape
- 2.1 Market ecosystem
- Exhibit 10: Parent market
- Exhibit 11: Market Characteristics
3 Market Sizing
- 3.1 Market definition
- Exhibit 12: Offerings of vendors included in the market definition
- 3.2 Market segment analysis
- Exhibit 13: Market segments
- 3.3 Market size 2021
- 3.4 Market outlook: Forecast for 2021-2026
- Exhibit 14: Chart on Global - Market size and forecast 2021-2026 ($ million)
- Exhibit 15: Data Table on Global - Market size and forecast 2021-2026 ($ million)
- Exhibit 16: Chart on Global Market: Year-over-year growth 2021-2026 (%)
- Exhibit 17: Data Table on Global Market: Year-over-year growth 2021-2026 (%)
4 Five Forces Analysis
- 4.1 Five forces summary
- Exhibit 18: Five forces analysis - Comparison between 2021 and 2026
- 4.2 Bargaining power of buyers
- Exhibit 19: Chart on Bargaining power of buyers - Impact of key factors 2021 and 2026
- 4.3 Bargaining power of suppliers
- Exhibit 20: Bargaining power of suppliers - Impact of key factors in 2021 and 2026
- 4.4 Threat of new entrants
- Exhibit 21: Threat of new entrants - Impact of key factors in 2021 and 2026
- 4.5 Threat of substitutes
- Exhibit 22: Threat of substitutes - Impact of key factors in 2021 and 2026
- 4.6 Threat of rivalry
- Exhibit 23: Threat of rivalry - Impact of key factors in 2021 and 2026
- 4.7 Market condition
- Exhibit 24: Chart on Market condition - Five forces 2021 and 2026
5 Market Segmentation by Application
- 5.1 Market segments
- Exhibit 25: Chart on Application - Market share 2021-2026 (%)
- Exhibit 26: Data Table on Application - Market share 2021-2026 (%)
- 5.2 Comparison by Application
- Exhibit 27: Chart on Comparison by Application
- Exhibit 28: Data Table on Comparison by Application
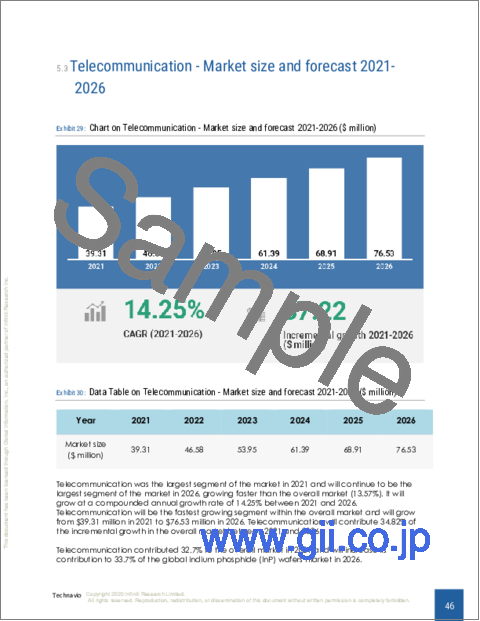
- 5.3 Telecommunication - Market size and forecast 2021-2026
- Exhibit 29: Chart on Telecommunication - Market size and forecast 2021-2026 ($ million)
- Exhibit 30: Data Table on Telecommunication - Market size and forecast 2021-2026 ($ million)
- Exhibit 31: Chart on Telecommunication - Year-over-year growth 2021-2026 (%)
- Exhibit 32: Data Table on Telecommunication - Year-over-year growth 2021-2026 (%)
- 5.4 Healthcare - Market size and forecast 2021-2026
- Exhibit 33: Chart on Healthcare - Market size and forecast 2021-2026 ($ million)
- Exhibit 34: Data Table on Healthcare - Market size and forecast 2021-2026 ($ million)
- Exhibit 35: Chart on Healthcare - Year-over-year growth 2021-2026 (%)
- Exhibit 36: Data Table on Healthcare - Year-over-year growth 2021-2026 (%)
- 5.5 Pharmaceuticals - Market size and forecast 2021-2026
- Exhibit 37: Chart on Pharmaceuticals - Market size and forecast 2021-2026 ($ million)
- Exhibit 38: Data Table on Pharmaceuticals - Market size and forecast 2021-2026 ($ million)
- Exhibit 39: Chart on Pharmaceuticals - Year-over-year growth 2021-2026 (%)
- Exhibit 40: Data Table on Pharmaceuticals - Year-over-year growth 2021-2026 (%)
- 5.6 Military and defense - Market size and forecast 2021-2026
- Exhibit 41: Chart on Military and defense - Market size and forecast 2021-2026 ($ million)
- Exhibit 42: Data Table on Military and defense - Market size and forecast 2021-2026 ($ million)
- Exhibit 43: Chart on Military and defense - Year-over-year growth 2021-2026 (%)
- Exhibit 44: Data Table on Military and defense - Year-over-year growth 2021-2026 (%)
- 5.7 Others - Market size and forecast 2021-2026
- Exhibit 45: Chart on Others - Market size and forecast 2021-2026 ($ million)
- Exhibit 46: Data Table on Others - Market size and forecast 2021-2026 ($ million)
- Exhibit 47: Chart on Others - Year-over-year growth 2021-2026 (%)
- Exhibit 48: Data Table on Others - Year-over-year growth 2021-2026 (%)
- 5.8 Market opportunity by Application
- Exhibit 49: Market opportunity by Application ($ million)
6 Market Segmentation by Type
- 6.1 Market segments
- Exhibit 50: Chart on Type - Market share 2021-2026 (%)
- Exhibit 51: Data Table on Type - Market share 2021-2026 (%)
- 6.2 Comparison by Type
- Exhibit 52: Chart on Comparison by Type
- Exhibit 53: Data Table on Comparison by Type
- 6.3 100 mm or 4 inches and above - Market size and forecast 2021-2026
- Exhibit 54: Chart on 100 mm or 4 inches and above - Market size and forecast 2021-2026 ($ million)
- Exhibit 55: Data Table on 100 mm or 4 inches and above - Market size and forecast 2021-2026 ($ million)
- Exhibit 56: Chart on 100 mm or 4 inches and above - Year-over-year growth 2021-2026 (%)
- Exhibit 57: Data Table on 100 mm or 4 inches and above - Year-over-year growth 2021-2026 (%)
- 6.4 76.2 mm or 3 inches - Market size and forecast 2021-2026
- Exhibit 58: Chart on 76.2 mm or 3 inches - Market size and forecast 2021-2026 ($ million)
- Exhibit 59: Data Table on 76.2 mm or 3 inches - Market size and forecast 2021-2026 ($ million)
- Exhibit 60: Chart on 76.2 mm or 3 inches - Year-over-year growth 2021-2026 (%)
- Exhibit 61: Data Table on 76.2 mm or 3 inches - Year-over-year growth 2021-2026 (%)
- 6.5 50.8 mm or 2 inches - Market size and forecast 2021-2026
- Exhibit 62: Chart on 50.8 mm or 2 inches - Market size and forecast 2021-2026 ($ million)
- Exhibit 63: Data Table on 50.8 mm or 2 inches - Market size and forecast 2021-2026 ($ million)
- Exhibit 64: Chart on 50.8 mm or 2 inches - Year-over-year growth 2021-2026 (%)
- Exhibit 65: Data Table on 50.8 mm or 2 inches - Year-over-year growth 2021-2026 (%)
- 6.6 Market opportunity by Type
- Exhibit 66: Market opportunity by Type ($ million)
7 Customer Landscape
- 7.1 Customer landscape overview
- Exhibit 67: Analysis of price sensitivity, lifecycle, customer purchase basket, adoption rates, and purchase criteria
8 Geographic Landscape
- 8.1 Geographic segmentation
- Exhibit 68: Chart on Market share By Geographical Landscape 2021-2026 (%)
- Exhibit 69: Data Table on Market share By Geographical Landscape 2021-2026 (%)
- 8.2 Geographic comparison
- Exhibit 70: Chart on Geographic comparison
- Exhibit 71: Data Table on Geographic comparison
- 8.3 APAC - Market size and forecast 2021-2026
- Exhibit 72: Chart on APAC - Market size and forecast 2021-2026 ($ million)
- Exhibit 73: Data Table on APAC - Market size and forecast 2021-2026 ($ million)
- Exhibit 74: Chart on APAC - Year-over-year growth 2021-2026 (%)
- Exhibit 75: Data Table on APAC - Year-over-year growth 2021-2026 (%)
- 8.4 North America - Market size and forecast 2021-2026
- Exhibit 76: Chart on North America - Market size and forecast 2021-2026 ($ million)
- Exhibit 77: Data Table on North America - Market size and forecast 2021-2026 ($ million)
- Exhibit 78: Chart on North America - Year-over-year growth 2021-2026 (%)
- Exhibit 79: Data Table on North America - Year-over-year growth 2021-2026 (%)
- 8.5 Europe - Market size and forecast 2021-2026
- Exhibit 80: Chart on Europe - Market size and forecast 2021-2026 ($ million)
- Exhibit 81: Data Table on Europe - Market size and forecast 2021-2026 ($ million)
- Exhibit 82: Chart on Europe - Year-over-year growth 2021-2026 (%)
- Exhibit 83: Data Table on Europe - Year-over-year growth 2021-2026 (%)
- 8.6 Middle East and Africa - Market size and forecast 2021-2026
- Exhibit 84: Chart on Middle East and Africa - Market size and forecast 2021-2026 ($ million)
- Exhibit 85: Data Table on Middle East and Africa - Market size and forecast 2021-2026 ($ million)
- Exhibit 86: Chart on Middle East and Africa - Year-over-year growth 2021-2026 (%)
- Exhibit 87: Data Table on Middle East and Africa - Year-over-year growth 2021-2026 (%)
- 8.7 South America - Market size and forecast 2021-2026
- Exhibit 88: Chart on South America - Market size and forecast 2021-2026 ($ million)
- Exhibit 89: Data Table on South America - Market size and forecast 2021-2026 ($ million)
- Exhibit 90: Chart on South America - Year-over-year growth 2021-2026 (%)
- Exhibit 91: Data Table on South America - Year-over-year growth 2021-2026 (%)
- 8.8 China - Market size and forecast 2021-2026
- Exhibit 92: Chart on China - Market size and forecast 2021-2026 ($ million)
- Exhibit 93: Data Table on China - Market size and forecast 2021-2026 ($ million)
- Exhibit 94: Chart on China - Year-over-year growth 2021-2026 (%)
- Exhibit 95: Data Table on China - Year-over-year growth 2021-2026 (%)
- 8.9 US - Market size and forecast 2021-2026
- Exhibit 96: Chart on US - Market size and forecast 2021-2026 ($ million)
- Exhibit 97: Data Table on US - Market size and forecast 2021-2026 ($ million)
- Exhibit 98: Chart on US - Year-over-year growth 2021-2026 (%)
- Exhibit 99: Data Table on US - Year-over-year growth 2021-2026 (%)
- 8.10 Japan - Market size and forecast 2021-2026
- Exhibit 100: Chart on Japan - Market size and forecast 2021-2026 ($ million)
- Exhibit 101: Data Table on Japan - Market size and forecast 2021-2026 ($ million)
- Exhibit 102: Chart on Japan - Year-over-year growth 2021-2026 (%)
- Exhibit 103: Data Table on Japan - Year-over-year growth 2021-2026 (%)
- 8.11 Germany - Market size and forecast 2021-2026
- Exhibit 104: Chart on Germany - Market size and forecast 2021-2026 ($ million)
- Exhibit 105: Data Table on Germany - Market size and forecast 2021-2026 ($ million)
- Exhibit 106: Chart on Germany - Year-over-year growth 2021-2026 (%)
- Exhibit 107: Data Table on Germany - Year-over-year growth 2021-2026 (%)
- 8.12 South Korea - Market size and forecast 2021-2026
- Exhibit 108: Chart on South Korea - Market size and forecast 2021-2026 ($ million)
- Exhibit 109: Data Table on South Korea - Market size and forecast 2021-2026 ($ million)
- Exhibit 110: Chart on South Korea - Year-over-year growth 2021-2026 (%)
- Exhibit 111: Data Table on South Korea - Year-over-year growth 2021-2026 (%)
- 8.13 Market opportunity By Geographical Landscape
- Exhibit 112: Market opportunity By Geographical Landscape ($ million)
9 Drivers, Challenges, and Trends
- 9.1 Market drivers
- 9.2 Market challenges
- 9.3 Impact of drivers and challenges
- Exhibit 113: Impact of drivers and challenges in 2021 and 2026
- 9.4 Market trends
10 Vendor Landscape
- 10.1 Overview
- 10.2 Vendor landscape
- Exhibit 114: Overview on Criticality of inputs and Factors of differentiation
- 10.3 Landscape disruption
- Exhibit 115: Overview on factors of disruption
- 10.4 Industry risks
- Exhibit 116: Impact of key risks on business
11 Vendor Analysis
- 11.1 Vendors covered
- Exhibit 117: Vendors covered
- 11.2 Market positioning of vendors
- Exhibit 118: Matrix on vendor position and classification
- 11.3 American Elements
- Exhibit 119: American Elements - Overview
- Exhibit 120: American Elements - Product / Service
- Exhibit 121: American Elements - Key offerings
- 11.4 AXT Inc.
- Exhibit 122: AXT Inc. - Overview
- Exhibit 123: AXT Inc. - Product / Service
- Exhibit 124: AXT Inc. - Key offerings
- 11.5 JX Nippon Mining and Metals Corp.
- Exhibit 125: JX Nippon Mining and Metals Corp. - Overview
- Exhibit 126: JX Nippon Mining and Metals Corp. - Product / Service
- Exhibit 127: JX Nippon Mining and Metals Corp. - Key offerings
- 11.6 Logitech Ltd.
- Exhibit 128: Logitech Ltd. - Overview
- Exhibit 129: Logitech Ltd. - Product / Service
- Exhibit 130: Logitech Ltd. - Key offerings
- 11.7 NANOGRAFI Co. Inc.
- Exhibit 131: NANOGRAFI Co. Inc. - Overview
- Exhibit 132: NANOGRAFI Co. Inc. - Product / Service
- Exhibit 133: NANOGRAFI Co. Inc. - Key offerings
- 11.8 Semiconductor Wafer Inc.
- Exhibit 134: Semiconductor Wafer Inc. - Overview
- Exhibit 135: Semiconductor Wafer Inc. - Product / Service
- Exhibit 136: Semiconductor Wafer Inc. - Key offerings
- 11.9 Sumitomo Electric Industries Ltd.
- Exhibit 137: Sumitomo Electric Industries Ltd. - Overview
- Exhibit 138: Sumitomo Electric Industries Ltd. - Business segments
- Exhibit 139: Sumitomo Electric Industries Ltd. - Key offerings
- Exhibit 140: Sumitomo Electric Industries Ltd. - Segment focus
- 11.10 Wafer World Inc.
- Exhibit 141: Wafer World Inc. - Overview
- Exhibit 142: Wafer World Inc. - Product / Service
- Exhibit 143: Wafer World Inc. - Key offerings
- 11.11 Western Minmetals SC Corp.
- Exhibit 144: Western Minmetals SC Corp. - Overview
- Exhibit 145: Western Minmetals SC Corp. - Product / Service
- Exhibit 146: Western Minmetals SC Corp. - Key offerings
- 11.12 Xiamen Powerway Advanced Material Co. Ltd.
- Exhibit 147: Xiamen Powerway Advanced Material Co. Ltd. - Overview
- Exhibit 148: Xiamen Powerway Advanced Material Co. Ltd. - Product / Service
- Exhibit 149: Xiamen Powerway Advanced Material Co. Ltd. - Key offerings
12 Appendix
- 12.1 Scope of the report
- 12.2 Inclusions and exclusions checklist
- Exhibit 150: Inclusions checklist
- Exhibit 151: Exclusions checklist
- 12.3 Currency conversion rates for US$
- Exhibit 152: Currency conversion rates for US$
- 12.4 Research methodology
- Exhibit 153: Research methodology
- Exhibit 154: Validation techniques employed for market sizing
- Exhibit 155: Information sources
- 12.5 List of abbreviations
- Exhibit 156: List of abbreviations