|
|
市場調査レポート
商品コード
1558540
脱油レシチンの世界市場、2024~2028年Global De-oiled Lecithin Market 2024-2028 |
||||||

|
|||||||
カスタマイズ可能
|
|||||||


| 脱油レシチンの世界市場、2024~2028年 |
|
出版日: 2024年08月16日
発行: TechNavio
ページ情報: 英文 133 Pages
納期: 即納可能
|

全表示
- 概要
- 図表
- 目次
脱油レシチン市場は2023~2028年に1億1,120万米ドル、予測期間中のCAGRは8.06%で成長すると予測されます。
当レポートでは、脱油レシチン市場の全体的な分析、市場規模・予測、動向、成長促進要因、課題、約25のベンダーを網羅したベンダー分析などを掲載しています。
現在の市場シナリオ、最新動向と促進要因、市場環境全体に関する最新分析を提供しています。市場は、健康への関心の高まりと低脂肪食品への需要の高まり、製薬業界における脱油レシチンの需要の高まり、消費者の間での栄養補助食品への需要の高まりによって牽引されています。
| 市場範囲 | |
|---|---|
| 基準年 | 2024年 |
| 終了年 | 2028年 |
| 予測期間 | 2024~2028年 |
| 成長モメンタム | 加速 |
| 前年比[2024年] | 6.85% |
| CAGR | 8.06% |
| 増分額 | 1億1,120万米ドル |
本調査では、今後数年間の脱油レシチン市場成長を牽引する主要要因の一つとして、新興国からの乳化剤需要の増加を挙げています。また、乳化剤としてレシチンを使用する利点に関する意識の高まり、健康的なライフスタイルへのニーズの高まり、可処分所得の増加が、市場の大きな需要につながります。
目次
第1章 エグゼクティブサマリー
- 市場概要
第2章 市場情勢
- 市場エコシステム
- 市場の特徴
- バリューチェーン分析
第3章 市場規模の評価
- 市場の定義
- 市場セグメント分析
- 市場規模 2023年
- 市場の展望 2023~2028年
第4章 市場規模実績
- 脱油レシチンの世界市場 2018~2022年
- 供給源別セグメント分析 2018~2022年
- 地域別セグメント分析 2018~2022年
- 国別セグメント分析 2018~2022年
第5章 ファイブフォース分析
- ファイブフォースの要約
- 買い手の交渉力
- 供給企業の交渉力
- 新規参入業者の脅威
- 代替品の脅威
- 競争の脅威
- 市況
第6章 市場セグメンテーション:供給源別
- 市場セグメンテーション
- 比較:供給源別
- 大豆:市場規模と予測 2023~2028年
- ヒマワリの種:市場規模と予測 2023~2028年
- 菜種:市場規模と予測 2023~2028年
- キャノーラ種子:市場規模と予測 2023~2028年
- 市場機会:供給源別
第7章 顧客情勢
- 顧客情勢概要
第8章 地域別情勢
- 地域別セグメンテーション
- 比較:地域別
- 北米:市場規模と予測 2023~2028年
- アジア太平洋:市場規模と予測 2023~2028年
- 欧州:市場規模と予測 2023~2028年
- 南米:市場規模と予測 2023~2028年
- 中東・アフリカ:市場規模と予測 2023~2028年
- 米国:市場規模と予測 2023~2028年
- 中国:市場規模と予測 2023~2028年
- ドイツ:市場規模と予測 2023~2028年
- 日本:市場規模と予測 2023~2028年
- 英国:市場規模と予測 2023~2028年
- 市場機会:地域情勢別
第9章 促進要因・課題・機会・抑制要因
- 市場促進要因
- 市場課題
- 促進要因と課題の影響
- 市場の機会・抑制要因
第10章 競合情勢
- 概要
- 競合情勢
- 混乱の状況
- 業界のリスク
第11章 競合分析
- 企業プロファイル
- 企業の市場ポジショニング
- American Lecithin Co.
- Bunge Ltd.
- Cargill Inc.
- Clarkson Grain Co. Inc.
- DuPont de Nemours Inc.
- Giiava
- LASENOR EMUL SL
- Lecital
- Stern Wywiol Gruppe GmbH and Co. KG
- UL Solutions Inc.
第12章 付録
Exhibits:
- Exhibits1: Executive Summary - Chart on Market Overview
- Exhibits2: Executive Summary - Data Table on Market Overview
- Exhibits3: Executive Summary - Chart on Global Market Characteristics
- Exhibits4: Executive Summary - Chart on Market By Geographical Landscape
- Exhibits5: Executive Summary - Chart on Market Segmentation by Source
- Exhibits6: Executive Summary - Chart on Incremental Growth
- Exhibits7: Executive Summary - Data Table on Incremental Growth
- Exhibits8: Executive Summary - Chart on Company Market Positioning
- Exhibits9: Parent Market
- Exhibits10: Data Table on - Parent Market
- Exhibits11: Market characteristics analysis
- Exhibits12: Value Chain Analysis
- Exhibits13: Offerings of companies included in the market definition
- Exhibits14: Market segments
- Exhibits15: Chart on Global - Market size and forecast 2023-2028 ($ million)
- Exhibits16: Data Table on Global - Market size and forecast 2023-2028 ($ million)
- Exhibits17: Chart on Global Market: Year-over-year growth 2023-2028 (%)
- Exhibits18: Data Table on Global Market: Year-over-year growth 2023-2028 (%)
- Exhibits19: Historic Market Size - Data Table on Global De-Oiled Lecithin Market 2018 - 2022 ($ million)
- Exhibits20: Historic Market Size - Source Segment 2018 - 2022 ($ million)
- Exhibits21: Historic Market Size - Geography Segment 2018 - 2022 ($ million)
- Exhibits22: Historic Market Size - Country Segment 2018 - 2022 ($ million)
- Exhibits23: Five forces analysis - Comparison between 2023 and 2028
- Exhibits24: Bargaining power of buyers - Impact of key factors 2023 and 2028
- Exhibits25: Bargaining power of suppliers - Impact of key factors in 2023 and 2028
- Exhibits26: Threat of new entrants - Impact of key factors in 2023 and 2028
- Exhibits27: Threat of substitutes - Impact of key factors in 2023 and 2028
- Exhibits28: Threat of rivalry - Impact of key factors in 2023 and 2028
- Exhibits29: Chart on Market condition - Five forces 2023 and 2028
- Exhibits30: Chart on Source - Market share 2023-2028 (%)
- Exhibits31: Data Table on Source - Market share 2023-2028 (%)
- Exhibits32: Chart on Comparison by Source
- Exhibits33: Data Table on Comparison by Source
- Exhibits34: Chart on Soy - Market size and forecast 2023-2028 ($ million)
- Exhibits35: Data Table on Soy - Market size and forecast 2023-2028 ($ million)
- Exhibits36: Chart on Soy - Year-over-year growth 2023-2028 (%)
- Exhibits37: Data Table on Soy - Year-over-year growth 2023-2028 (%)
- Exhibits38: Chart on Sunflower seeds - Market size and forecast 2023-2028 ($ million)
- Exhibits39: Data Table on Sunflower seeds - Market size and forecast 2023-2028 ($ million)
- Exhibits40: Chart on Sunflower seeds - Year-over-year growth 2023-2028 (%)
- Exhibits41: Data Table on Sunflower seeds - Year-over-year growth 2023-2028 (%)
- Exhibits42: Chart on Rapeseeds - Market size and forecast 2023-2028 ($ million)
- Exhibits43: Data Table on Rapeseeds - Market size and forecast 2023-2028 ($ million)
- Exhibits44: Chart on Rapeseeds - Year-over-year growth 2023-2028 (%)
- Exhibits45: Data Table on Rapeseeds - Year-over-year growth 2023-2028 (%)
- Exhibits46: Chart on Canola seeds - Market size and forecast 2023-2028 ($ million)
- Exhibits47: Data Table on Canola seeds - Market size and forecast 2023-2028 ($ million)
- Exhibits48: Chart on Canola seeds - Year-over-year growth 2023-2028 (%)
- Exhibits49: Data Table on Canola seeds - Year-over-year growth 2023-2028 (%)
- Exhibits50: Market opportunity by Source ($ million)
- Exhibits51: Data Table on Market opportunity by Source ($ million)
- Exhibits52: Analysis of price sensitivity, lifecycle, customer purchase basket, adoption rates, and purchase criteria
- Exhibits53: Chart on Market share By Geographical Landscape 2023-2028 (%)
- Exhibits54: Data Table on Market share By Geographical Landscape 2023-2028 (%)
- Exhibits55: Chart on Geographic comparison
- Exhibits56: Data Table on Geographic comparison
- Exhibits57: Chart on North America - Market size and forecast 2023-2028 ($ million)
- Exhibits58: Data Table on North America - Market size and forecast 2023-2028 ($ million)
- Exhibits59: Chart on North America - Year-over-year growth 2023-2028 (%)
- Exhibits60: Data Table on North America - Year-over-year growth 2023-2028 (%)
- Exhibits61: Chart on APAC - Market size and forecast 2023-2028 ($ million)
- Exhibits62: Data Table on APAC - Market size and forecast 2023-2028 ($ million)
- Exhibits63: Chart on APAC - Year-over-year growth 2023-2028 (%)
- Exhibits64: Data Table on APAC - Year-over-year growth 2023-2028 (%)
- Exhibits65: Chart on Europe - Market size and forecast 2023-2028 ($ million)
- Exhibits66: Data Table on Europe - Market size and forecast 2023-2028 ($ million)
- Exhibits67: Chart on Europe - Year-over-year growth 2023-2028 (%)
- Exhibits68: Data Table on Europe - Year-over-year growth 2023-2028 (%)
- Exhibits69: Chart on South America - Market size and forecast 2023-2028 ($ million)
- Exhibits70: Data Table on South America - Market size and forecast 2023-2028 ($ million)
- Exhibits71: Chart on South America - Year-over-year growth 2023-2028 (%)
- Exhibits72: Data Table on South America - Year-over-year growth 2023-2028 (%)
- Exhibits73: Chart on Middle East and Africa - Market size and forecast 2023-2028 ($ million)
- Exhibits74: Data Table on Middle East and Africa - Market size and forecast 2023-2028 ($ million)
- Exhibits75: Chart on Middle East and Africa - Year-over-year growth 2023-2028 (%)
- Exhibits76: Data Table on Middle East and Africa - Year-over-year growth 2023-2028 (%)
- Exhibits77: Chart on US - Market size and forecast 2023-2028 ($ million)
- Exhibits78: Data Table on US - Market size and forecast 2023-2028 ($ million)
- Exhibits79: Chart on US - Year-over-year growth 2023-2028 (%)
- Exhibits80: Data Table on US - Year-over-year growth 2023-2028 (%)
- Exhibits81: Chart on China - Market size and forecast 2023-2028 ($ million)
- Exhibits82: Data Table on China - Market size and forecast 2023-2028 ($ million)
- Exhibits83: Chart on China - Year-over-year growth 2023-2028 (%)
- Exhibits84: Data Table on China - Year-over-year growth 2023-2028 (%)
- Exhibits85: Chart on Germany - Market size and forecast 2023-2028 ($ million)
- Exhibits86: Data Table on Germany - Market size and forecast 2023-2028 ($ million)
- Exhibits87: Chart on Germany - Year-over-year growth 2023-2028 (%)
- Exhibits88: Data Table on Germany - Year-over-year growth 2023-2028 (%)
- Exhibits89: Chart on Japan - Market size and forecast 2023-2028 ($ million)
- Exhibits90: Data Table on Japan - Market size and forecast 2023-2028 ($ million)
- Exhibits91: Chart on Japan - Year-over-year growth 2023-2028 (%)
- Exhibits92: Data Table on Japan - Year-over-year growth 2023-2028 (%)
- Exhibits93: Chart on UK - Market size and forecast 2023-2028 ($ million)
- Exhibits94: Data Table on UK - Market size and forecast 2023-2028 ($ million)
- Exhibits95: Chart on UK - Year-over-year growth 2023-2028 (%)
- Exhibits96: Data Table on UK - Year-over-year growth 2023-2028 (%)
- Exhibits97: Market opportunity By Geographical Landscape ($ million)
- Exhibits98: Data Tables on Market opportunity By Geographical Landscape ($ million)
- Exhibits99: Impact of drivers and challenges in 2023 and 2028
- Exhibits100: Overview on criticality of inputs and factors of differentiation
- Exhibits101: Overview on factors of disruption
- Exhibits102: Impact of key risks on business
- Exhibits103: Companies covered
- Exhibits104: Matrix on companies position and classification
- Exhibits105: American Lecithin Co. - Overview
- Exhibits106: American Lecithin Co. - Product / Service
- Exhibits107: American Lecithin Co. - Key offerings
- Exhibits108: Bunge Ltd. - Overview
- Exhibits109: Bunge Ltd. - Business segments
- Exhibits110: Bunge Ltd. - Key news
- Exhibits111: Bunge Ltd. - Key offerings
- Exhibits112: Bunge Ltd. - Segment focus
- Exhibits113: Cargill Inc. - Overview
- Exhibits114: Cargill Inc. - Product / Service
- Exhibits115: Cargill Inc. - Key news
- Exhibits116: Cargill Inc. - Key offerings
- Exhibits117: Clarkson Grain Co. Inc. - Overview
- Exhibits118: Clarkson Grain Co. Inc. - Product / Service
- Exhibits119: Clarkson Grain Co. Inc. - Key offerings
- Exhibits120: DuPont de Nemours Inc. - Overview
- Exhibits121: DuPont de Nemours Inc. - Business segments
- Exhibits122: DuPont de Nemours Inc. - Key news
- Exhibits123: DuPont de Nemours Inc. - Key offerings
- Exhibits124: DuPont de Nemours Inc. - Segment focus
- Exhibits125: Giiava - Overview
- Exhibits126: Giiava - Product / Service
- Exhibits127: Giiava - Key offerings
- Exhibits128: LASENOR EMUL SL - Overview
- Exhibits129: LASENOR EMUL SL - Product / Service
- Exhibits130: LASENOR EMUL SL - Key offerings
- Exhibits131: Lecital - Overview
- Exhibits132: Lecital - Product / Service
- Exhibits133: Lecital - Key offerings
- Exhibits134: Stern Wywiol Gruppe GmbH and Co. KG - Overview
- Exhibits135: Stern Wywiol Gruppe GmbH and Co. KG - Product / Service
- Exhibits136: Stern Wywiol Gruppe GmbH and Co. KG - Key offerings
- Exhibits137: UL Solutions Inc. - Overview
- Exhibits138: UL Solutions Inc. - Product / Service
- Exhibits139: UL Solutions Inc. - Key offerings
- Exhibits140: Inclusions checklist
- Exhibits141: Exclusions checklist
- Exhibits142: Currency conversion rates for US$
- Exhibits143: Research methodology
- Exhibits144: Information sources
- Exhibits145: Data validation
- Exhibits146: Validation techniques employed for market sizing
- Exhibits147: Data synthesis
- Exhibits148: 360 degree market analysis
- Exhibits149: List of abbreviations
The de-oiled lecithin market is forecasted to grow by USD 111.2 mn during 2023-2028, accelerating at a CAGR of 8.06% during the forecast period. The report on the de-oiled lecithin market provides a holistic analysis, market size and forecast, trends, growth drivers, and challenges, as well as vendor analysis covering around 25 vendors.
The report offers an up-to-date analysis regarding the current market scenario, the latest trends and drivers, and the overall market environment. The market is driven by rising health concerns and demand for low-fat foods, growing demand for de-oiled lecithin in pharmaceutical industries, and growing demand for dietary supplements among consumers.
Technavio's de-oiled lecithin market is segmented as below:
| Market Scope | |
|---|---|
| Base Year | 2024 |
| End Year | 2028 |
| Series Year | 2024-2028 |
| Growth Momentum | Accelerate |
| YOY 2024 | 6.85% |
| CAGR | 8.06% |
| Incremental Value | $111.2 mn |
By Source
- Soy
- Sunflower seeds
- Rapeseeds
- Canola seeds
By Geographical Landscape
- North America
- APAC
- Europe
- South America
- Middle East and Africa
This study identifies the growing demand for emulsifiers from emerging economies as one of the prime reasons driving the de-oiled lecithin market growth during the next few years. Also, growing awareness about benefits of using lecithin as an emulsifier and growing need for healthy lifestyle and rising disposable income will lead to sizable demand in the market.
The report on the de-oiled lecithin market covers the following areas:
- De-oiled lecithin market sizing
- De-oiled lecithin market forecast
- De-oiled lecithin market industry analysis
The robust vendor analysis is designed to help clients improve their market position, and in line with this, this report provides a detailed analysis of several leading de-oiled lecithin market vendors that include American Lecithin Co., Amitex Agro Product Pvt. Ltd., Austrade Inc., AV Group, Avril SCA, Bunge Ltd., Cargill Inc., Clarkson Grain Co. Inc., DuPont de Nemours Inc., Giiava, Kriti Nutrients Ltd., LASENOR EMUL SL, Lecilite Ingredients Pvt. Ltd., Lecital, Lipoid GmbH, Servotech India Ltd., Sonic Biochem Extraction Pvt. Ltd., Stern Wywiol Gruppe GmbH and Co. KG, The Scoular Co., and UL Solutions Inc.. Also, the de-oiled lecithin market analysis report includes information on upcoming trends and challenges that will influence market growth. This is to help companies strategize and leverage all forthcoming growth opportunities.
The study was conducted using an objective combination of primary and secondary information including inputs from key participants in the industry. The report contains a comprehensive market and vendor landscape in addition to an analysis of the key vendors.
The publisher presents a detailed picture of the market by the way of study, synthesis, and summation of data from multiple sources by an analysis of key parameters such as profit, pricing, competition, and promotions. It presents various market facets by identifying the key industry influencers. The data presented is comprehensive, reliable, and a result of extensive research - both primary and secondary. The market research reports provide a complete competitive landscape and an in-depth vendor selection methodology and analysis using qualitative and quantitative research to forecast the accurate market growth.
Table of Contents
1 Executive Summary
- 1.1 Market overview
- Executive Summary - Chart on Market Overview
- Executive Summary - Data Table on Market Overview
- Executive Summary - Chart on Global Market Characteristics
- Executive Summary - Chart on Market By Geographical Landscape
- Executive Summary - Chart on Market Segmentation by Source
- Executive Summary - Chart on Incremental Growth
- Executive Summary - Data Table on Incremental Growth
- Executive Summary - Chart on Company Market Positioning
2 Market Landscape
- 2.1 Market ecosystem
- Parent Market
- Data Table on - Parent Market
- 2.2 Market characteristics
- Market characteristics analysis
- 2.3 Value chain analysis
- Value Chain Analysis
3 Market Sizing
- 3.1 Market definition
- Offerings of companies included in the market definition
- 3.2 Market segment analysis
- Market segments
- 3.3 Market size 2023
- 3.4 Market outlook: Forecast for 2023-2028
- Chart on Global - Market size and forecast 2023-2028 ($ million)
- Data Table on Global - Market size and forecast 2023-2028 ($ million)
- Chart on Global Market: Year-over-year growth 2023-2028 (%)
- Data Table on Global Market: Year-over-year growth 2023-2028 (%)
4 Historic Market Size
- 4.1 Global De-Oiled Lecithin Market 2018 - 2022
- Historic Market Size - Data Table on Global De-Oiled Lecithin Market 2018 - 2022 ($ million)
- 4.2 Source segment analysis 2018 - 2022
- Historic Market Size - Source Segment 2018 - 2022 ($ million)
- 4.3 Geography segment analysis 2018 - 2022
- Historic Market Size - Geography Segment 2018 - 2022 ($ million)
- 4.4 Country segment analysis 2018 - 2022
- Historic Market Size - Country Segment 2018 - 2022 ($ million)
5 Five Forces Analysis
- 5.1 Five forces summary
- Five forces analysis - Comparison between 2023 and 2028
- 5.2 Bargaining power of buyers
- Bargaining power of buyers - Impact of key factors 2023 and 2028
- 5.3 Bargaining power of suppliers
- Bargaining power of suppliers - Impact of key factors in 2023 and 2028
- 5.4 Threat of new entrants
- Threat of new entrants - Impact of key factors in 2023 and 2028
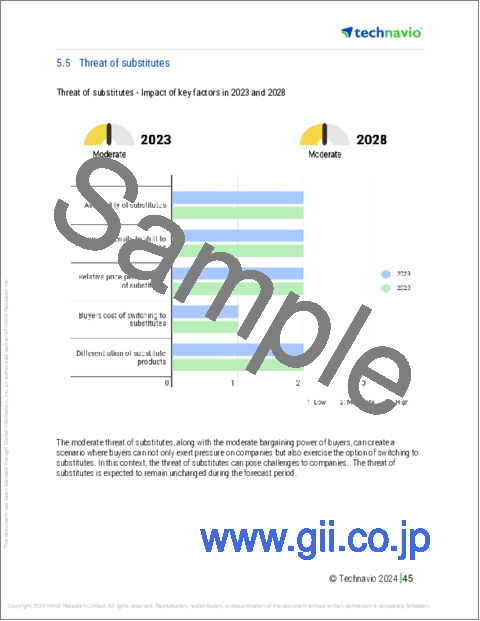
- 5.5 Threat of substitutes
- Threat of substitutes - Impact of key factors in 2023 and 2028
- 5.6 Threat of rivalry
- Threat of rivalry - Impact of key factors in 2023 and 2028
- 5.7 Market condition
- Chart on Market condition - Five forces 2023 and 2028
6 Market Segmentation by Source
- 6.1 Market segments
- Chart on Source - Market share 2023-2028 (%)
- Data Table on Source - Market share 2023-2028 (%)
- 6.2 Comparison by Source
- Chart on Comparison by Source
- Data Table on Comparison by Source
- 6.3 Soy - Market size and forecast 2023-2028
- Chart on Soy - Market size and forecast 2023-2028 ($ million)
- Data Table on Soy - Market size and forecast 2023-2028 ($ million)
- Chart on Soy - Year-over-year growth 2023-2028 (%)
- Data Table on Soy - Year-over-year growth 2023-2028 (%)
- 6.4 Sunflower seeds - Market size and forecast 2023-2028
- Chart on Sunflower seeds - Market size and forecast 2023-2028 ($ million)
- Data Table on Sunflower seeds - Market size and forecast 2023-2028 ($ million)
- Chart on Sunflower seeds - Year-over-year growth 2023-2028 (%)
- Data Table on Sunflower seeds - Year-over-year growth 2023-2028 (%)
- 6.5 Rapeseeds - Market size and forecast 2023-2028
- Chart on Rapeseeds - Market size and forecast 2023-2028 ($ million)
- Data Table on Rapeseeds - Market size and forecast 2023-2028 ($ million)
- Chart on Rapeseeds - Year-over-year growth 2023-2028 (%)
- Data Table on Rapeseeds - Year-over-year growth 2023-2028 (%)
- 6.6 Canola seeds - Market size and forecast 2023-2028
- Chart on Canola seeds - Market size and forecast 2023-2028 ($ million)
- Data Table on Canola seeds - Market size and forecast 2023-2028 ($ million)
- Chart on Canola seeds - Year-over-year growth 2023-2028 (%)
- Data Table on Canola seeds - Year-over-year growth 2023-2028 (%)
- 6.7 Market opportunity by Source
- Market opportunity by Source ($ million)
- Data Table on Market opportunity by Source ($ million)
7 Customer Landscape
- 7.1 Customer landscape overview
- Analysis of price sensitivity, lifecycle, customer purchase basket, adoption rates, and purchase criteria
8 Geographic Landscape
- 8.1 Geographic segmentation
- Chart on Market share By Geographical Landscape 2023-2028 (%)
- Data Table on Market share By Geographical Landscape 2023-2028 (%)
- 8.2 Geographic comparison
- Chart on Geographic comparison
- Data Table on Geographic comparison
- 8.3 North America - Market size and forecast 2023-2028
- Chart on North America - Market size and forecast 2023-2028 ($ million)
- Data Table on North America - Market size and forecast 2023-2028 ($ million)
- Chart on North America - Year-over-year growth 2023-2028 (%)
- Data Table on North America - Year-over-year growth 2023-2028 (%)
- 8.4 APAC - Market size and forecast 2023-2028
- Chart on APAC - Market size and forecast 2023-2028 ($ million)
- Data Table on APAC - Market size and forecast 2023-2028 ($ million)
- Chart on APAC - Year-over-year growth 2023-2028 (%)
- Data Table on APAC - Year-over-year growth 2023-2028 (%)
- 8.5 Europe - Market size and forecast 2023-2028
- Chart on Europe - Market size and forecast 2023-2028 ($ million)
- Data Table on Europe - Market size and forecast 2023-2028 ($ million)
- Chart on Europe - Year-over-year growth 2023-2028 (%)
- Data Table on Europe - Year-over-year growth 2023-2028 (%)
- 8.6 South America - Market size and forecast 2023-2028
- Chart on South America - Market size and forecast 2023-2028 ($ million)
- Data Table on South America - Market size and forecast 2023-2028 ($ million)
- Chart on South America - Year-over-year growth 2023-2028 (%)
- Data Table on South America - Year-over-year growth 2023-2028 (%)
- 8.7 Middle East and Africa - Market size and forecast 2023-2028
- Chart on Middle East and Africa - Market size and forecast 2023-2028 ($ million)
- Data Table on Middle East and Africa - Market size and forecast 2023-2028 ($ million)
- Chart on Middle East and Africa - Year-over-year growth 2023-2028 (%)
- Data Table on Middle East and Africa - Year-over-year growth 2023-2028 (%)
- 8.8 US - Market size and forecast 2023-2028
- Chart on US - Market size and forecast 2023-2028 ($ million)
- Data Table on US - Market size and forecast 2023-2028 ($ million)
- Chart on US - Year-over-year growth 2023-2028 (%)
- Data Table on US - Year-over-year growth 2023-2028 (%)
- 8.9 China - Market size and forecast 2023-2028
- Chart on China - Market size and forecast 2023-2028 ($ million)
- Data Table on China - Market size and forecast 2023-2028 ($ million)
- Chart on China - Year-over-year growth 2023-2028 (%)
- Data Table on China - Year-over-year growth 2023-2028 (%)
- 8.10 Germany - Market size and forecast 2023-2028
- Chart on Germany - Market size and forecast 2023-2028 ($ million)
- Data Table on Germany - Market size and forecast 2023-2028 ($ million)
- Chart on Germany - Year-over-year growth 2023-2028 (%)
- Data Table on Germany - Year-over-year growth 2023-2028 (%)
- 8.11 Japan - Market size and forecast 2023-2028
- Chart on Japan - Market size and forecast 2023-2028 ($ million)
- Data Table on Japan - Market size and forecast 2023-2028 ($ million)
- Chart on Japan - Year-over-year growth 2023-2028 (%)
- Data Table on Japan - Year-over-year growth 2023-2028 (%)
- 8.12 UK - Market size and forecast 2023-2028
- Chart on UK - Market size and forecast 2023-2028 ($ million)
- Data Table on UK - Market size and forecast 2023-2028 ($ million)
- Chart on UK - Year-over-year growth 2023-2028 (%)
- Data Table on UK - Year-over-year growth 2023-2028 (%)
- 8.13 Market opportunity By Geographical Landscape
- Market opportunity By Geographical Landscape ($ million)
- Data Tables on Market opportunity By Geographical Landscape ($ million)
9 Drivers, Challenges, and Opportunity/Restraints
- 9.1 Market drivers
- 9.2 Market challenges
- 9.3 Impact of drivers and challenges
- Impact of drivers and challenges in 2023 and 2028
- 9.4 Market opportunities/restraints
10 Competitive Landscape
- 10.1 Overview
- 10.2 Competitive Landscape
- Overview on criticality of inputs and factors of differentiation
- 10.3 Landscape disruption
- Overview on factors of disruption
- 10.4 Industry risks
- Impact of key risks on business
11 Competitive Analysis
- 11.1 Companies profiled
- Companies covered
- 11.2 Market positioning of companies
- Matrix on companies position and classification
- 11.3 American Lecithin Co.
- American Lecithin Co. - Overview
- American Lecithin Co. - Product / Service
- American Lecithin Co. - Key offerings
- 11.4 Bunge Ltd.
- Bunge Ltd. - Overview
- Bunge Ltd. - Business segments
- Bunge Ltd. - Key news
- Bunge Ltd. - Key offerings
- Bunge Ltd. - Segment focus
- 11.5 Cargill Inc.
- Cargill Inc. - Overview
- Cargill Inc. - Product / Service
- Cargill Inc. - Key news
- Cargill Inc. - Key offerings
- 11.6 Clarkson Grain Co. Inc.
- Clarkson Grain Co. Inc. - Overview
- Clarkson Grain Co. Inc. - Product / Service
- Clarkson Grain Co. Inc. - Key offerings
- 11.7 DuPont de Nemours Inc.
- DuPont de Nemours Inc. - Overview
- DuPont de Nemours Inc. - Business segments
- DuPont de Nemours Inc. - Key news
- DuPont de Nemours Inc. - Key offerings
- DuPont de Nemours Inc. - Segment focus
- 11.8 Giiava
- Giiava - Overview
- Giiava - Product / Service
- Giiava - Key offerings
- 11.9 LASENOR EMUL SL
- LASENOR EMUL SL - Overview
- LASENOR EMUL SL - Product / Service
- LASENOR EMUL SL - Key offerings
- 11.10 Lecital
- Lecital - Overview
- Lecital - Product / Service
- Lecital - Key offerings
- 11.11 Stern Wywiol Gruppe GmbH and Co. KG
- Stern Wywiol Gruppe GmbH and Co. KG - Overview
- Stern Wywiol Gruppe GmbH and Co. KG - Product / Service
- Stern Wywiol Gruppe GmbH and Co. KG - Key offerings
- 11.12 UL Solutions Inc.
- UL Solutions Inc. - Overview
- UL Solutions Inc. - Product / Service
- UL Solutions Inc. - Key offerings
12 Appendix
- 12.1 Scope of the report
- 12.2 Inclusions and exclusions checklist
- Inclusions checklist
- Exclusions checklist
- 12.3 Currency conversion rates for US$
- Currency conversion rates for US$
- 12.4 Research methodology
- Research methodology
- 12.5 Data procurement
- Information sources
- 12.6 Data validation
- Data validation
- 12.7 Validation techniques employed for market sizing
- Validation techniques employed for market sizing
- 12.8 Data synthesis
- Data synthesis
- 12.9 360 degree market analysis
- 360 degree market analysis
- 12.10 List of abbreviations
- List of abbreviations

