|
|
市場調査レポート
商品コード
1459511
医療機器セキュリティ・ソリューションの世界市場 2024-2028Global Medical Device Security Solutions Market 2024-2028 |
||||||
|
|||||||
カスタマイズ可能
|
|||||||

| 医療機器セキュリティ・ソリューションの世界市場 2024-2028 |
|
出版日: 2024年03月22日
発行: TechNavio
ページ情報: 英文 178 Pages
納期: 即納可能
|

全表示
- 概要
- 図表
- 目次
医療機器セキュリティ・ソリューション市場は2023-2028年に26億2,000万米ドル、予測期間中のCAGRは11.96%で成長すると予測されています。
当レポートでは、医療機器セキュリティ・ソリューション市場の全体的な分析、市場規模・予測、動向、成長促進要因、課題、約25のベンダーを網羅したベンダー分析などを掲載しています。
現在の市場シナリオ、最新動向と促進要因、市場環境全体に関する最新分析を提供しています。ヘルスケアデータに関する懸念の高まり、高齢者人口の増加と慢性疾患の蔓延、医療機器セキュリティ・ソリューションに関する政府の厳しい規制などが市場を牽引しています。
| 市場範囲 | |
|---|---|
| 基準年 | 2024 |
| 終了年 | 2028 |
| 予測期間 | 2024-2028 |
| 成長モメンタム | 加速 |
| 前年比2024年 | 10.62% |
| CAGR | 11.96% |
| 増分額 | 26億2,000万米ドル |
本調査では、今後数年間の医療機器セキュリティ・ソリューション市場成長を牽引する主な要因の1つとして、ヘルスケア産業におけるIoTおよびコネクテッドデバイスの導入拡大を挙げています。また、セルフメディケーションや在宅医療機器に対する需要の高まり、クラウドベースの医療機器セキュリティ・ソリューションに対する需要の高まりも、市場の大きな需要につながると思われます。
目次
第1章 エグゼクティブサマリー
- 市場概要
第2章 市場情勢
- 市場エコシステム
第3章 市場規模の評価
- 市場の定義
- 市場セグメント分析
- 市場規模 2023
- 市場の見通し 2023-2028
第4章 市場規模実績
- 医療機器セキュリティ・ソリューションの世界市場 2018-2022
- デバイスセグメント分析 2018-2022
- エンドユーザーセグメント分析 2018-2022
- 地域別セグメント分析 2018-2022
- 国別セグメント分析 2018-2022
第5章 ファイブフォース分析
- ファイブフォースの要約
- 買い手の交渉力
- 供給企業の交渉力
- 新規参入業者の脅威
- 代替品の脅威
- 競争の脅威
- 市況
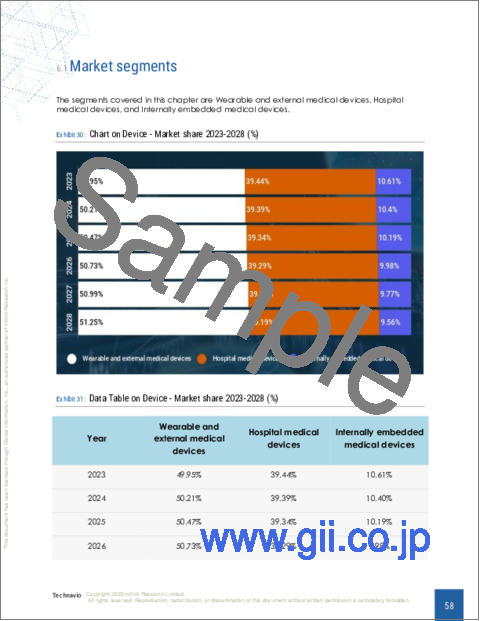
第6章 市場セグメンテーション:デバイス別
- 市場セグメント
- 比較:デバイス別
- ウェアラブルおよび外部医療機器:市場規模と予測 2023-2028
- 病院医療機器:市場規模と予測 2023-2028
- 体内埋め込み型医療機器:市場規模と予測 2023-2028
- 市場機会:デバイス別
第7章 市場セグメンテーション:エンドユーザー別
- 市場セグメント
- 比較:エンドユーザー別
- ヘルスケア提供者:市場規模と予測 2023-2028
- 医療機器メーカー:市場規模と予測 2023-2028
- ヘルスケア支払者:市場規模と予測 2023-2028
- 市場機会:エンドユーザー別
第8章 顧客情勢
- 顧客情勢の概要
第9章 地域別情勢
- 地域別セグメンテーション
- 地域別比較
- 北米:市場規模と予測 2023-2028
- 欧州:市場規模と予測 2023-2028
- アジア太平洋:市場規模と予測 2023-2028
- 中東・アフリカ:市場規模と予測 2023-2028
- 南米:市場規模と予測 2023-2028
- 米国:市場規模と予測 2023-2028
- ドイツ:市場規模と予測 2023-2028
- 英国:市場規模と予測 2023-2028
- 日本:市場規模と予測 2023-2028
- 中国:市場規模と予測 2023-2028
- 市場機会:地域情勢別
第10章 促進要因、課題、および動向
- 市場促進要因
- 市場の課題
- 促進要因と課題の影響
- 市場動向
第11章 ベンダー情勢
- 概要
- ベンダー情勢
- 混乱の状況
- 業界のリスク
第12章 ベンダー分析
- 対象ベンダー
- ベンダーの市場ポジショニング
- Battelle Memorial Institute
- Broadcom Inc.
- Check Point Software Technologies Ltd.
- Cisco Systems Inc.
- CLEARDATA
- Clearwater Security and Compliance LLC
- Coalfire Systems Inc.
- Dragerwerk AG and Co. KGaA
- DXC Technology Co.
- Extreme Networks Inc.
- Fortinet Inc.
- General Electric Co.
- International Business Machines Corp.
- Koninklijke Philips N.V.
- Palo Alto Networks Inc.
第13章 付録
Exhibits:
- Exhibits1: Executive Summary - Chart on Market Overview
- Exhibits2: Executive Summary - Data Table on Market Overview
- Exhibits3: Executive Summary - Chart on Global Market Characteristics
- Exhibits4: Executive Summary - Chart on Market By Geographical Landscape
- Exhibits5: Executive Summary - Chart on Market Segmentation by Device
- Exhibits6: Executive Summary - Chart on Market Segmentation by End-user
- Exhibits7: Executive Summary - Chart on Incremental Growth
- Exhibits8: Executive Summary - Data Table on Incremental Growth
- Exhibits9: Executive Summary - Chart on Vendor Market Positioning
- Exhibits10: Parent market
- Exhibits11: Market Characteristics
- Exhibits12: Offerings of vendors included in the market definition
- Exhibits13: Market segments
- Exhibits14: Chart on Global - Market size and forecast 2023-2028 ($ billion)
- Exhibits15: Data Table on Global - Market size and forecast 2023-2028 ($ billion)
- Exhibits16: Chart on Global Market: Year-over-year growth 2023-2028 (%)
- Exhibits17: Data Table on Global Market: Year-over-year growth 2023-2028 (%)
- Exhibits18: Historic Market Size - Data Table on global medical device security solutions market 2018 - 2022 ($ billion)
- Exhibits19: Historic Market Size - Device Segment 2018 - 2022 ($ billion)
- Exhibits20: Historic Market Size - End-user Segment 2018 - 2022 ($ billion)
- Exhibits21: Historic Market Size - Geography Segment 2018 - 2022 ($ billion)
- Exhibits22: Historic Market Size - Country Segment 2018 - 2022 ($ billion)
- Exhibits23: Five forces analysis - Comparison between 2023 and 2028
- Exhibits24: Chart on Bargaining power of buyers - Impact of key factors 2023 and 2028
- Exhibits25: Bargaining power of suppliers - Impact of key factors in 2023 and 2028
- Exhibits26: Threat of new entrants - Impact of key factors in 2023 and 2028
- Exhibits27: Threat of substitutes - Impact of key factors in 2023 and 2028
- Exhibits28: Threat of rivalry - Impact of key factors in 2023 and 2028
- Exhibits29: Chart on Market condition - Five forces 2023 and 2028
- Exhibits30: Chart on Device - Market share 2023-2028 (%)
- Exhibits31: Data Table on Device - Market share 2023-2028 (%)
- Exhibits32: Chart on Comparison by Device
- Exhibits33: Data Table on Comparison by Device
- Exhibits34: Chart on Wearable and external medical devices - Market size and forecast 2023-2028 ($ billion)
- Exhibits35: Data Table on Wearable and external medical devices - Market size and forecast 2023-2028 ($ billion)
- Exhibits36: Chart on Wearable and external medical devices - Year-over-year growth 2023-2028 (%)
- Exhibits37: Data Table on Wearable and external medical devices - Year-over-year growth 2023-2028 (%)
- Exhibits38: Chart on Hospital medical devices - Market size and forecast 2023-2028 ($ billion)
- Exhibits39: Data Table on Hospital medical devices - Market size and forecast 2023-2028 ($ billion)
- Exhibits40: Chart on Hospital medical devices - Year-over-year growth 2023-2028 (%)
- Exhibits41: Data Table on Hospital medical devices - Year-over-year growth 2023-2028 (%)
- Exhibits42: Chart on Internally embedded medical devices - Market size and forecast 2023-2028 ($ billion)
- Exhibits43: Data Table on Internally embedded medical devices - Market size and forecast 2023-2028 ($ billion)
- Exhibits44: Chart on Internally embedded medical devices - Year-over-year growth 2023-2028 (%)
- Exhibits45: Data Table on Internally embedded medical devices - Year-over-year growth 2023-2028 (%)
- Exhibits46: Market opportunity by Device ($ billion)
- Exhibits47: Data Table on Market opportunity by Device ($ billion)
- Exhibits48: Chart on End-user - Market share 2023-2028 (%)
- Exhibits49: Data Table on End-user - Market share 2023-2028 (%)
- Exhibits50: Chart on Comparison by End-user
- Exhibits51: Data Table on Comparison by End-user
- Exhibits52: Chart on Healthcare providers - Market size and forecast 2023-2028 ($ billion)
- Exhibits53: Data Table on Healthcare providers - Market size and forecast 2023-2028 ($ billion)
- Exhibits54: Chart on Healthcare providers - Year-over-year growth 2023-2028 (%)
- Exhibits55: Data Table on Healthcare providers - Year-over-year growth 2023-2028 (%)
- Exhibits56: Chart on Medical devices manufacturers - Market size and forecast 2023-2028 ($ billion)
- Exhibits57: Data Table on Medical devices manufacturers - Market size and forecast 2023-2028 ($ billion)
- Exhibits58: Chart on Medical devices manufacturers - Year-over-year growth 2023-2028 (%)
- Exhibits59: Data Table on Medical devices manufacturers - Year-over-year growth 2023-2028 (%)
- Exhibits60: Chart on Healthcare payers - Market size and forecast 2023-2028 ($ billion)
- Exhibits61: Data Table on Healthcare payers - Market size and forecast 2023-2028 ($ billion)
- Exhibits62: Chart on Healthcare payers - Year-over-year growth 2023-2028 (%)
- Exhibits63: Data Table on Healthcare payers - Year-over-year growth 2023-2028 (%)
- Exhibits64: Market opportunity by End-user ($ billion)
- Exhibits65: Data Table on Market opportunity by End-user ($ billion)
- Exhibits66: Analysis of price sensitivity, lifecycle, customer purchase basket, adoption rates, and purchase criteria
- Exhibits67: Chart on Market share By Geographical Landscape 2023-2028 (%)
- Exhibits68: Data Table on Market share By Geographical Landscape 2023-2028 (%)
- Exhibits69: Chart on Geographic comparison
- Exhibits70: Data Table on Geographic comparison
- Exhibits71: Chart on North America - Market size and forecast 2023-2028 ($ billion)
- Exhibits72: Data Table on North America - Market size and forecast 2023-2028 ($ billion)
- Exhibits73: Chart on North America - Year-over-year growth 2023-2028 (%)
- Exhibits74: Data Table on North America - Year-over-year growth 2023-2028 (%)
- Exhibits75: Chart on Europe - Market size and forecast 2023-2028 ($ billion)
- Exhibits76: Data Table on Europe - Market size and forecast 2023-2028 ($ billion)
- Exhibits77: Chart on Europe - Year-over-year growth 2023-2028 (%)
- Exhibits78: Data Table on Europe - Year-over-year growth 2023-2028 (%)
- Exhibits79: Chart on APAC - Market size and forecast 2023-2028 ($ billion)
- Exhibits80: Data Table on APAC - Market size and forecast 2023-2028 ($ billion)
- Exhibits81: Chart on APAC - Year-over-year growth 2023-2028 (%)
- Exhibits82: Data Table on APAC - Year-over-year growth 2023-2028 (%)
- Exhibits83: Chart on Middle East and Africa - Market size and forecast 2023-2028 ($ billion)
- Exhibits84: Data Table on Middle East and Africa - Market size and forecast 2023-2028 ($ billion)
- Exhibits85: Chart on Middle East and Africa - Year-over-year growth 2023-2028 (%)
- Exhibits86: Data Table on Middle East and Africa - Year-over-year growth 2023-2028 (%)
- Exhibits87: Chart on South America - Market size and forecast 2023-2028 ($ billion)
- Exhibits88: Data Table on South America - Market size and forecast 2023-2028 ($ billion)
- Exhibits89: Chart on South America - Year-over-year growth 2023-2028 (%)
- Exhibits90: Data Table on South America - Year-over-year growth 2023-2028 (%)
- Exhibits91: Chart on US - Market size and forecast 2023-2028 ($ billion)
- Exhibits92: Data Table on US - Market size and forecast 2023-2028 ($ billion)
- Exhibits93: Chart on US - Year-over-year growth 2023-2028 (%)
- Exhibits94: Data Table on US - Year-over-year growth 2023-2028 (%)
- Exhibits95: Chart on Germany - Market size and forecast 2023-2028 ($ billion)
- Exhibits96: Data Table on Germany - Market size and forecast 2023-2028 ($ billion)
- Exhibits97: Chart on Germany - Year-over-year growth 2023-2028 (%)
- Exhibits98: Data Table on Germany - Year-over-year growth 2023-2028 (%)
- Exhibits99: Chart on UK - Market size and forecast 2023-2028 ($ billion)
- Exhibits100: Data Table on UK - Market size and forecast 2023-2028 ($ billion)
- Exhibits101: Chart on UK - Year-over-year growth 2023-2028 (%)
- Exhibits102: Data Table on UK - Year-over-year growth 2023-2028 (%)
- Exhibits103: Chart on Japan - Market size and forecast 2023-2028 ($ billion)
- Exhibits104: Data Table on Japan - Market size and forecast 2023-2028 ($ billion)
- Exhibits105: Chart on Japan - Year-over-year growth 2023-2028 (%)
- Exhibits106: Data Table on Japan - Year-over-year growth 2023-2028 (%)
- Exhibits107: Chart on China - Market size and forecast 2023-2028 ($ billion)
- Exhibits108: Data Table on China - Market size and forecast 2023-2028 ($ billion)
- Exhibits109: Chart on China - Year-over-year growth 2023-2028 (%)
- Exhibits110: Data Table on China - Year-over-year growth 2023-2028 (%)
- Exhibits111: Market opportunity By Geographical Landscape ($ billion)
- Exhibits112: Data Tables on Market opportunity By Geographical Landscape ($ billion)
- Exhibits113: Impact of drivers and challenges in 2023 and 2028
- Exhibits114: Overview on Criticality of inputs and Factors of differentiation
- Exhibits115: Overview on factors of disruption
- Exhibits116: Impact of key risks on business
- Exhibits117: Vendors covered
- Exhibits118: Matrix on vendor position and classification
- Exhibits119: Battelle Memorial Institute - Overview
- Exhibits120: Battelle Memorial Institute - Product / Service
- Exhibits121: Battelle Memorial Institute - Key offerings
- Exhibits122: Broadcom Inc. - Overview
- Exhibits123: Broadcom Inc. - Business segments
- Exhibits124: Broadcom Inc. - Key news
- Exhibits125: Broadcom Inc. - Key offerings
- Exhibits126: Broadcom Inc. - Segment focus
- Exhibits127: Check Point Software Technologies Ltd. - Overview
- Exhibits128: Check Point Software Technologies Ltd. - Product / Service
- Exhibits129: Check Point Software Technologies Ltd. - Key news
- Exhibits130: Check Point Software Technologies Ltd. - Key offerings
- Exhibits131: Cisco Systems Inc. - Overview
- Exhibits132: Cisco Systems Inc. - Business segments
- Exhibits133: Cisco Systems Inc. - Key news
- Exhibits134: Cisco Systems Inc. - Key offerings
- Exhibits135: Cisco Systems Inc. - Segment focus
- Exhibits136: CLEARDATA - Overview
- Exhibits137: CLEARDATA - Product / Service
- Exhibits138: CLEARDATA - Key offerings
- Exhibits139: Clearwater Security and Compliance LLC - Overview
- Exhibits140: Clearwater Security and Compliance LLC - Product / Service
- Exhibits141: Clearwater Security and Compliance LLC - Key offerings
- Exhibits142: Coalfire Systems Inc. - Overview
- Exhibits143: Coalfire Systems Inc. - Product / Service
- Exhibits144: Coalfire Systems Inc. - Key offerings
- Exhibits145: Dragerwerk AG and Co. KGaA - Overview
- Exhibits146: Dragerwerk AG and Co. KGaA - Business segments
- Exhibits147: Dragerwerk AG and Co. KGaA - Key offerings
- Exhibits148: Dragerwerk AG and Co. KGaA - Segment focus
- Exhibits149: DXC Technology Co. - Overview
- Exhibits150: DXC Technology Co. - Business segments
- Exhibits151: DXC Technology Co. - Key offerings
- Exhibits152: DXC Technology Co. - Segment focus
- Exhibits153: Extreme Networks Inc. - Overview
- Exhibits154: Extreme Networks Inc. - Product / Service
- Exhibits155: Extreme Networks Inc. - Key news
- Exhibits156: Extreme Networks Inc. - Key offerings
- Exhibits157: Fortinet Inc. - Overview
- Exhibits158: Fortinet Inc. - Product / Service
- Exhibits159: Fortinet Inc. - Key offerings
- Exhibits160: General Electric Co. - Overview
- Exhibits161: General Electric Co. - Business segments
- Exhibits162: General Electric Co. - Key news
- Exhibits163: General Electric Co. - Key offerings
- Exhibits164: General Electric Co. - Segment focus
- Exhibits165: International Business Machines Corp. - Overview
- Exhibits166: International Business Machines Corp. - Business segments
- Exhibits167: International Business Machines Corp. - Key news
- Exhibits168: International Business Machines Corp. - Key offerings
- Exhibits169: International Business Machines Corp. - Segment focus
- Exhibits170: Koninklijke Philips N.V. - Overview
- Exhibits171: Koninklijke Philips N.V. - Business segments
- Exhibits172: Koninklijke Philips N.V. - Key news
- Exhibits173: Koninklijke Philips N.V. - Key offerings
- Exhibits174: Koninklijke Philips N.V. - Segment focus
- Exhibits175: Palo Alto Networks Inc. - Overview
- Exhibits176: Palo Alto Networks Inc. - Product / Service
- Exhibits177: Palo Alto Networks Inc. - Key news
- Exhibits178: Palo Alto Networks Inc. - Key offerings
- Exhibits179: Inclusions checklist
- Exhibits180: Exclusions checklist
- Exhibits181: Currency conversion rates for US$
- Exhibits182: Research methodology
- Exhibits183: Validation techniques employed for market sizing
- Exhibits184: Information sources
- Exhibits185: List of abbreviations
The medical device security solutions market is forecasted to grow by USD 2.62 bn during 2023-2028, accelerating at a CAGR of 11.96% during the forecast period. The report on the medical device security solutions market provides a holistic analysis, market size and forecast, trends, growth drivers, and challenges, as well as vendor analysis covering around 25 vendors.
The report offers an up-to-date analysis regarding the current market scenario, the latest trends and drivers, and the overall market environment. The market is driven by increasing concerns about healthcare data, the growing geriatric population and prevalence of chronic diseases, and stringent government regulations on medical device security solutions.
Technavio's medical device security solutions market is segmented as below:
| Market Scope | |
|---|---|
| Base Year | 2024 |
| End Year | 2028 |
| Series Year | 2024-2028 |
| Growth Momentum | Accelerate |
| YOY 2024 | 10.62% |
| CAGR | 11.96% |
| Incremental Value | $2.62bn |
By Device
- Wearable and external medical devices
- Hospital medical devices
- Internally embedded medical devices
By End-user
- Healthcare providers
- Medical devices manufacturers
- Healthcare payers
By Geographical Landscape
- North America
- Europe
- APAC
- Middle East and Africa
- South America
This study identifies the increasing adoption of IoT and connected devices in healthcare industries as one of the prime reasons driving the medical device security solutions market growth during the next few years. Also, rising demand for self-medication and homecare medical devices and increasing demand for cloud-based medical device security solutions will lead to sizable demand in the market.
The report on the medical device security solutions market covers the following areas:
- Medical device security solutions market sizing
- Medical device security solutions market forecast
- Medical device security solutions market industry analysis
The robust vendor analysis is designed to help clients improve their market position, and in line with this, this report provides a detailed analysis of several leading medical device security solutions market vendors that include Battelle Memorial Institute, Broadcom Inc., Cisco Systems Inc., CLEARDATA, Clearwater Security and Compliance LLC, Coalfire Systems Inc., Device Authority, Dragerwerk AG and Co. KGaA, DXC Technology Co., Extreme Networks Inc., Forescout, Fortinet Inc., General Electric Co., Imperva Inc., International Business Machines Corp., Koninklijke Philips N.V., Meditology Services LLC, Palo Alto Networks Inc., Sophos Ltd., UL Solutions Inc., and Check Point Software Technologies Ltd.. Also, the medical device security solutions market analysis report includes information on upcoming trends and challenges that will influence market growth. This is to help companies strategize and leverage all forthcoming growth opportunities.
The study was conducted using an objective combination of primary and secondary information including inputs from key participants in the industry. The report contains a comprehensive market and vendor landscape in addition to an analysis of the key vendors.
The publisher presents a detailed picture of the market by way of study, synthesis, and summation of data from multiple sources through an analysis of key parameters such as profit, pricing, competition, and promotions. It presents various market facets by identifying the key industry influencers. The data presented is comprehensive, reliable, and a result of extensive research - both primary and secondary. The market research reports provide a complete competitive landscape and an in-depth vendor selection methodology and analysis using qualitative and quantitative research to forecast accurate market growth.
Table of Contents
1 Executive Summary
- 1.1 Market overview
2 Market Landscape
- 2.1 Market ecosystem
3 Market Sizing
- 3.1 Market definition
- 3.2 Market segment analysis
- 3.3 Market size 2023
- 3.4 Market outlook: Forecast for 2023-2028
4 Historic Market Size
- 4.1 Global medical device security solutions market 2018 - 2022
- 4.2 Device Segment Analysis 2018 - 2022
- 4.3 End-user Segment Analysis 2018 - 2022
- 4.4 Geography Segment Analysis 2018 - 2022
- 4.5 Country Segment Analysis 2018 - 2022
5 Five Forces Analysis
- 5.1 Five forces summary
- 5.2 Bargaining power of buyers
- 5.3 Bargaining power of suppliers
- 5.4 Threat of new entrants
- 5.5 Threat of substitutes
- 5.6 Threat of rivalry
- 5.7 Market condition
6 Market Segmentation by Device
- 6.1 Market segments
- 6.2 Comparison by Device
- 6.3 Wearable and external medical devices - Market size and forecast 2023-2028
- 6.4 Hospital medical devices - Market size and forecast 2023-2028
- 6.5 Internally embedded medical devices - Market size and forecast 2023-2028
- 6.6 Market opportunity by Device
7 Market Segmentation by End-user
- 7.1 Market segments
- 7.2 Comparison by End-user
- 7.3 Healthcare providers - Market size and forecast 2023-2028
- 7.4 Medical devices manufacturers - Market size and forecast 2023-2028
- 7.5 Healthcare payers - Market size and forecast 2023-2028
- 7.6 Market opportunity by End-user
8 Customer Landscape
- 8.1 Customer landscape overview
9 Geographic Landscape
- 9.1 Geographic segmentation
- 9.2 Geographic comparison
- 9.3 North America - Market size and forecast 2023-2028
- 9.4 Europe - Market size and forecast 2023-2028
- 9.5 APAC - Market size and forecast 2023-2028
- 9.6 Middle East and Africa - Market size and forecast 2023-2028
- 9.7 South America - Market size and forecast 2023-2028
- 9.8 US - Market size and forecast 2023-2028
- 9.9 Germany - Market size and forecast 2023-2028
- 9.10 UK - Market size and forecast 2023-2028
- 9.11 Japan - Market size and forecast 2023-2028
- 9.12 China - Market size and forecast 2023-2028
- 9.13 Market opportunity By Geographical Landscape
10 Drivers, Challenges, and Trends
- 10.1 Market drivers
- 10.2 Market challenges
- 10.3 Impact of drivers and challenges
- 10.4 Market trends
11 Vendor Landscape
- 11.1 Overview
- 11.2 Vendor landscape
- 11.3 Landscape disruption
- 11.4 Industry risks
12 Vendor Analysis
- 12.1 Vendors covered
- 12.2 Market positioning of vendors
- 12.3 Battelle Memorial Institute
- 12.4 Broadcom Inc.
- 12.5 Check Point Software Technologies Ltd.
- 12.6 Cisco Systems Inc.
- 12.7 CLEARDATA
- 12.8 Clearwater Security and Compliance LLC
- 12.9 Coalfire Systems Inc.
- 12.10 Dragerwerk AG and Co. KGaA
- 12.11 DXC Technology Co.
- 12.12 Extreme Networks Inc.
- 12.13 Fortinet Inc.
- 12.14 General Electric Co.
- 12.15 International Business Machines Corp.
- 12.16 Koninklijke Philips N.V.
- 12.17 Palo Alto Networks Inc.
13 Appendix
- 13.1 Scope of the report
- 13.2 Inclusions and exclusions checklist
- 13.3 Currency conversion rates for US$
- 13.4 Research methodology
- 13.5 List of abbreviations

