|
|
市場調査レポート
商品コード
1792179
鉄道フリート管理の世界市場、2025年~2029年Global Railway Fleet Management Market 2025-2029 |
||||||

|
|||||||
カスタマイズ可能
|
|||||||


| 鉄道フリート管理の世界市場、2025年~2029年 |
|
出版日: 2025年08月13日
発行: TechNavio
ページ情報: 英文 234 Pages
納期: 即納可能
|

全表示
- 概要
- 図表
- 目次
鉄道フリート管理市場は2024-2029年に42億8,790万米ドル、予測期間中のCAGRで13.6%の成長が予測されています。
当レポートでは、鉄道フリート管理市場の全体的な分析、市場規模・予測、動向、成長促進要因、課題、約25のベンダーを網羅したベンダー分析などを掲載しています。
現在の市場シナリオ、最新動向と促進要因、市場環境全体に関する最新分析を提供しています。鉄道業界における無線技術の採用拡大、運用能力に対するニーズの高まり、鉄道フリート管理の技術進歩などが市場を牽引しています。
| 市場範囲 | |
|---|---|
| 基準年 | 2025 |
| 終了年 | 2029 |
| 予測期間 | 2025-2029 |
| 成長モメンタム | 加速 |
| 前年比 | 12.1% |
| CAGR | 13.6% |
| 増分額 | 42億8,790万米ドル |
本調査は、業界の主要参加者からのインプットを含め、一次情報と二次情報を客観的に組み合わせて実施しました。レポートには、主要企業の分析に加え、包括的な市場規模データ、地域別分析によるセグメント、ベンダー情勢が含まれています。レポートには過去データと予測データがあります。
本調査では、今後数年間の鉄道フリート管理市場の成長を促進する主な要因の1つとして、車両管理業務の合理化を目的としたクラウドコンピューティングの採用が増加していることを挙げています。また、鉄道資産管理のためのデジタルツインの出現や、気候変動とそれに伴う持続可能でクリーンな高速輸送へのニーズは、市場の大きな需要につながると思われます。
目次
第1章 エグゼクティブサマリー
- 市場概要
第2章 Technavio分析
- 価格・ライフサイクル・顧客購入バスケット・採用率・購入基準の分析
- インプットの重要性と差別化の要因
- 混乱の要因
- 促進要因と課題の影響
第3章 市場情勢
- 市場エコシステム
- 市場の特徴
- バリューチェーン分析
第4章 市場規模
- 市場の定義
- 市場セグメント分析
- 市場規模 2024
- 市場の見通し 2024-2029
第5章 市場規模実績
- 鉄道フリート管理の世界市場 2019-2023
- 通信技術別セグメント分析 2019-2023
- コンポーネント別セグメント分析 2019-2023
- アプリケーション別セグメント分析 2019-2023
- ソリューション別セグメント分析 2019-2023
- 地域別セグメント分析 2019-2023
- 国別セグメント分析 2019-2023
第6章 定性分析
- AIの影響:鉄道フリート管理の世界市場
第7章 ファイブフォース分析
- ファイブフォースの要約
- 買い手の交渉力
- 供給企業の交渉力
- 新規参入業者の脅威
- 代替品の脅威
- 競争の脅威
- 市況
第8章 市場セグメンテーション:通信技術別
- 市場セグメント
- 比較:通信技術別
- GNSS:市場規模と予測 2024-2029
- セルラーシステム:市場規模と予測 2024-2029
- 市場機会:通信技術別
第9章 市場セグメンテーション:コンポーネント別
- 市場セグメント
- 比較:コンポーネント別
- ソフトウェア:市場規模と予測 2024-2029
- ハードウェア:市場規模と予測 2024-2029
- サービス:市場規模と予測 2024-2029
- 市場機会:コンポーネント別
第10章 市場セグメンテーション:アプリケーション別
- 市場セグメント
- 比較:アプリケーション別
- 旅客鉄道:市場規模と予測 2024-2029
- 貨物鉄道:市場規模と予測 2024-2029
- 高速鉄道:市場規模と予測 2024-2029
- 市場機会:アプリケーション別
第11章 市場セグメンテーション:ソリューション別
- 市場セグメント
- 比較:ソリューション別
- アセットトラッキング:市場規模と予測 2024-2029
- 予測保全:市場規模と予測 2024-2029
- パフォーマンスモニタリング:市場規模と予測 2024-2029
- 市場機会:ソリューション別
第12章 顧客情勢
- 顧客情勢の概要
第13章 地域別情勢
- 地域別セグメンテーション
- 地域別比較
- アジア太平洋:市場規模と予測 2024-2029
- 欧州:市場規模と予測 2024-2029
- 北米:市場規模と予測 2024-2029
- 中東・アフリカ:市場規模と予測 2024-2029
- 南米:市場規模と予測 2024-2029
- 中国:市場規模と予測 2024-2029
- インド:市場規模と予測 2024-2029
- 米国:市場規模と予測 2024-2029
- ドイツ:市場規模と予測 2024-2029
- フランス:市場規模と予測 2024-2029
- 日本:市場規模と予測 2024-2029
- 英国:市場規模と予測 2024-2029
- カナダ:市場規模と予測 2024-2029
- 韓国:市場規模と予測 2024-2029
- イタリア:市場規模と予測 2024-2029
- 市場機会:地域情勢別
第14章 促進要因・課題・機会・抑制要因
- 市場促進要因
- 市場の課題
- 促進要因と課題の影響
- 市場の機会・抑制要因
第15章 競合情勢
- 概要
- 競合情勢
- 混乱の状況
- 業界のリスク
第16章 競合分析
- 企業プロファイル
- 企業ランキング指数
- 企業の市場ポジショニング
- AllTranstek L.L.C
- Arcadis NV
- CRX SOFTWARE
- GMV Innovating Solutions SL
- KLS Logistics Services Inc.
- Network Rail Consulting.
- ORBCOMM Inc.
- Railcar Tracking Co.
- Railnova SA
- Ricardo Plc
- Sultran Ltd.
- The Greenbrier Companies Inc.
- Trimble Inc.
- VTG Aktiengesellschaft
- Westinghouse Air Brake Technologies Corp.
第17章 付録
Exhibits:
- Exhibits1: Executive Summary - Chart on Market Overview
- Exhibits2: Executive Summary - Data Table on Market Overview
- Exhibits3: Executive Summary - Chart on Global Market Characteristics
- Exhibits4: Executive Summary - Chart on Market By Geographical Landscape
- Exhibits5: Executive Summary - Chart on Market Segmentation by Communication Technology
- Exhibits6: Executive Summary - Chart on Market Segmentation by Component
- Exhibits7: Executive Summary - Chart on Market Segmentation by Application
- Exhibits8: Executive Summary - Chart on Market Segmentation by Solution
- Exhibits9: Executive Summary - Chart on Incremental Growth
- Exhibits10: Executive Summary - Data Table on Incremental Growth
- Exhibits11: Executive Summary - Chart on Company Market Positioning
- Exhibits12: Analysis of price sensitivity, lifecycle, customer purchase basket, adoption rates, and purchase criteria
- Exhibits13: Overview on criticality of inputs and factors of differentiation
- Exhibits14: Overview on factors of disruption
- Exhibits15: Impact of drivers and challenges in 2024 and 2029
- Exhibits16: Parent Market
- Exhibits17: Data Table on - Parent Market
- Exhibits18: Market characteristics analysis
- Exhibits19: Value chain analysis
- Exhibits20: Offerings of companies included in the market definition
- Exhibits21: Market segments
- Exhibits22: Chart on Global - Market size and forecast 2024-2029 ($ million)
- Exhibits23: Data Table on Global - Market size and forecast 2024-2029 ($ million)
- Exhibits24: Chart on Global Market: Year-over-year growth 2024-2029 (%)
- Exhibits25: Data Table on Global Market: Year-over-year growth 2024-2029 (%)
- Exhibits26: Historic Market Size - Data Table on Global Railway Fleet Management Market 2019 - 2023 ($ million)
- Exhibits27: Historic Market Size - Communication Technology Segment 2019 - 2023 ($ million)
- Exhibits28: Historic Market Size - Component Segment 2019 - 2023 ($ million)
- Exhibits29: Historic Market Size - Application Segment 2019 - 2023 ($ million)
- Exhibits30: Historic Market Size - Solution Segment 2019 - 2023 ($ million)
- Exhibits31: Historic Market Size - Geography Segment 2019 - 2023 ($ million)
- Exhibits32: Historic Market Size - Country Segment 2019 - 2023 ($ million)
- Exhibits33: Five forces analysis - Comparison between 2024 and 2029
- Exhibits34: Bargaining power of buyers - Impact of key factors 2024 and 2029
- Exhibits35: Bargaining power of suppliers - Impact of key factors in 2024 and 2029
- Exhibits36: Threat of new entrants - Impact of key factors in 2024 and 2029
- Exhibits37: Threat of substitutes - Impact of key factors in 2024 and 2029
- Exhibits38: Threat of rivalry - Impact of key factors in 2024 and 2029
- Exhibits39: Chart on Market condition - Five forces 2024 and 2029
- Exhibits40: Chart on Communication Technology - Market share 2024-2029 (%)
- Exhibits41: Data Table on Communication Technology - Market share 2024-2029 (%)
- Exhibits42: Chart on Comparison by Communication Technology
- Exhibits43: Data Table on Comparison by Communication Technology
- Exhibits44: Chart on GNSS - Market size and forecast 2024-2029 ($ million)
- Exhibits45: Data Table on GNSS - Market size and forecast 2024-2029 ($ million)
- Exhibits46: Chart on GNSS - Year-over-year growth 2024-2029 (%)
- Exhibits47: Data Table on GNSS - Year-over-year growth 2024-2029 (%)
- Exhibits48: Chart on Cellular system - Market size and forecast 2024-2029 ($ million)
- Exhibits49: Data Table on Cellular system - Market size and forecast 2024-2029 ($ million)
- Exhibits50: Chart on Cellular system - Year-over-year growth 2024-2029 (%)
- Exhibits51: Data Table on Cellular system - Year-over-year growth 2024-2029 (%)
- Exhibits52: Market opportunity by Communication Technology ($ million)
- Exhibits53: Data Table on Market opportunity by Communication Technology ($ million)
- Exhibits54: Chart on Component - Market share 2024-2029 (%)
- Exhibits55: Data Table on Component - Market share 2024-2029 (%)
- Exhibits56: Chart on Comparison by Component
- Exhibits57: Data Table on Comparison by Component
- Exhibits58: Chart on Software - Market size and forecast 2024-2029 ($ million)
- Exhibits59: Data Table on Software - Market size and forecast 2024-2029 ($ million)
- Exhibits60: Chart on Software - Year-over-year growth 2024-2029 (%)
- Exhibits61: Data Table on Software - Year-over-year growth 2024-2029 (%)
- Exhibits62: Chart on Hardware - Market size and forecast 2024-2029 ($ million)
- Exhibits63: Data Table on Hardware - Market size and forecast 2024-2029 ($ million)
- Exhibits64: Chart on Hardware - Year-over-year growth 2024-2029 (%)
- Exhibits65: Data Table on Hardware - Year-over-year growth 2024-2029 (%)
- Exhibits66: Chart on Services - Market size and forecast 2024-2029 ($ million)
- Exhibits67: Data Table on Services - Market size and forecast 2024-2029 ($ million)
- Exhibits68: Chart on Services - Year-over-year growth 2024-2029 (%)
- Exhibits69: Data Table on Services - Year-over-year growth 2024-2029 (%)
- Exhibits70: Market opportunity by Component ($ million)
- Exhibits71: Data Table on Market opportunity by Component ($ million)
- Exhibits72: Chart on Application - Market share 2024-2029 (%)
- Exhibits73: Data Table on Application - Market share 2024-2029 (%)
- Exhibits74: Chart on Comparison by Application
- Exhibits75: Data Table on Comparison by Application
- Exhibits76: Chart on Passenger rail - Market size and forecast 2024-2029 ($ million)
- Exhibits77: Data Table on Passenger rail - Market size and forecast 2024-2029 ($ million)
- Exhibits78: Chart on Passenger rail - Year-over-year growth 2024-2029 (%)
- Exhibits79: Data Table on Passenger rail - Year-over-year growth 2024-2029 (%)
- Exhibits80: Chart on Freight rail - Market size and forecast 2024-2029 ($ million)
- Exhibits81: Data Table on Freight rail - Market size and forecast 2024-2029 ($ million)
- Exhibits82: Chart on Freight rail - Year-over-year growth 2024-2029 (%)
- Exhibits83: Data Table on Freight rail - Year-over-year growth 2024-2029 (%)
- Exhibits84: Chart on High-speed rail - Market size and forecast 2024-2029 ($ million)
- Exhibits85: Data Table on High-speed rail - Market size and forecast 2024-2029 ($ million)
- Exhibits86: Chart on High-speed rail - Year-over-year growth 2024-2029 (%)
- Exhibits87: Data Table on High-speed rail - Year-over-year growth 2024-2029 (%)
- Exhibits88: Market opportunity by Application ($ million)
- Exhibits89: Data Table on Market opportunity by Application ($ million)
- Exhibits90: Chart on Solution - Market share 2024-2029 (%)
- Exhibits91: Data Table on Solution - Market share 2024-2029 (%)
- Exhibits92: Chart on Comparison by Solution
- Exhibits93: Data Table on Comparison by Solution
- Exhibits94: Chart on Asset tracking - Market size and forecast 2024-2029 ($ million)
- Exhibits95: Data Table on Asset tracking - Market size and forecast 2024-2029 ($ million)
- Exhibits96: Chart on Asset tracking - Year-over-year growth 2024-2029 (%)
- Exhibits97: Data Table on Asset tracking - Year-over-year growth 2024-2029 (%)
- Exhibits98: Chart on Predictive maintenance - Market size and forecast 2024-2029 ($ million)
- Exhibits99: Data Table on Predictive maintenance - Market size and forecast 2024-2029 ($ million)
- Exhibits100: Chart on Predictive maintenance - Year-over-year growth 2024-2029 (%)
- Exhibits101: Data Table on Predictive maintenance - Year-over-year growth 2024-2029 (%)
- Exhibits102: Chart on Performance monitoring - Market size and forecast 2024-2029 ($ million)
- Exhibits103: Data Table on Performance monitoring - Market size and forecast 2024-2029 ($ million)
- Exhibits104: Chart on Performance monitoring - Year-over-year growth 2024-2029 (%)
- Exhibits105: Data Table on Performance monitoring - Year-over-year growth 2024-2029 (%)
- Exhibits106: Market opportunity by Solution ($ million)
- Exhibits107: Data Table on Market opportunity by Solution ($ million)
- Exhibits108: Analysis of price sensitivity, lifecycle, customer purchase basket, adoption rates, and purchase criteria
- Exhibits109: Chart on Market share By Geographical Landscape 2024-2029 (%)
- Exhibits110: Data Table on Market share By Geographical Landscape 2024-2029 (%)
- Exhibits111: Chart on Geographic comparison
- Exhibits112: Data Table on Geographic comparison
- Exhibits113: Chart on APAC - Market size and forecast 2024-2029 ($ million)
- Exhibits114: Data Table on APAC - Market size and forecast 2024-2029 ($ million)
- Exhibits115: Chart on APAC - Year-over-year growth 2024-2029 (%)
- Exhibits116: Data Table on APAC - Year-over-year growth 2024-2029 (%)
- Exhibits117: Chart on Europe - Market size and forecast 2024-2029 ($ million)
- Exhibits118: Data Table on Europe - Market size and forecast 2024-2029 ($ million)
- Exhibits119: Chart on Europe - Year-over-year growth 2024-2029 (%)
- Exhibits120: Data Table on Europe - Year-over-year growth 2024-2029 (%)
- Exhibits121: Chart on North America - Market size and forecast 2024-2029 ($ million)
- Exhibits122: Data Table on North America - Market size and forecast 2024-2029 ($ million)
- Exhibits123: Chart on North America - Year-over-year growth 2024-2029 (%)
- Exhibits124: Data Table on North America - Year-over-year growth 2024-2029 (%)
- Exhibits125: Chart on Middle East and Africa - Market size and forecast 2024-2029 ($ million)
- Exhibits126: Data Table on Middle East and Africa - Market size and forecast 2024-2029 ($ million)
- Exhibits127: Chart on Middle East and Africa - Year-over-year growth 2024-2029 (%)
- Exhibits128: Data Table on Middle East and Africa - Year-over-year growth 2024-2029 (%)
- Exhibits129: Chart on South America - Market size and forecast 2024-2029 ($ million)
- Exhibits130: Data Table on South America - Market size and forecast 2024-2029 ($ million)
- Exhibits131: Chart on South America - Year-over-year growth 2024-2029 (%)
- Exhibits132: Data Table on South America - Year-over-year growth 2024-2029 (%)
- Exhibits133: Chart on China - Market size and forecast 2024-2029 ($ million)
- Exhibits134: Data Table on China - Market size and forecast 2024-2029 ($ million)
- Exhibits135: Chart on China - Year-over-year growth 2024-2029 (%)
- Exhibits136: Data Table on China - Year-over-year growth 2024-2029 (%)
- Exhibits137: Chart on India - Market size and forecast 2024-2029 ($ million)
- Exhibits138: Data Table on India - Market size and forecast 2024-2029 ($ million)
- Exhibits139: Chart on India - Year-over-year growth 2024-2029 (%)
- Exhibits140: Data Table on India - Year-over-year growth 2024-2029 (%)
- Exhibits141: Chart on US - Market size and forecast 2024-2029 ($ million)
- Exhibits142: Data Table on US - Market size and forecast 2024-2029 ($ million)
- Exhibits143: Chart on US - Year-over-year growth 2024-2029 (%)
- Exhibits144: Data Table on US - Year-over-year growth 2024-2029 (%)
- Exhibits145: Chart on Germany - Market size and forecast 2024-2029 ($ million)
- Exhibits146: Data Table on Germany - Market size and forecast 2024-2029 ($ million)
- Exhibits147: Chart on Germany - Year-over-year growth 2024-2029 (%)
- Exhibits148: Data Table on Germany - Year-over-year growth 2024-2029 (%)
- Exhibits149: Chart on France - Market size and forecast 2024-2029 ($ million)
- Exhibits150: Data Table on France - Market size and forecast 2024-2029 ($ million)
- Exhibits151: Chart on France - Year-over-year growth 2024-2029 (%)
- Exhibits152: Data Table on France - Year-over-year growth 2024-2029 (%)
- Exhibits153: Chart on Japan - Market size and forecast 2024-2029 ($ million)
- Exhibits154: Data Table on Japan - Market size and forecast 2024-2029 ($ million)
- Exhibits155: Chart on Japan - Year-over-year growth 2024-2029 (%)
- Exhibits156: Data Table on Japan - Year-over-year growth 2024-2029 (%)
- Exhibits157: Chart on UK - Market size and forecast 2024-2029 ($ million)
- Exhibits158: Data Table on UK - Market size and forecast 2024-2029 ($ million)
- Exhibits159: Chart on UK - Year-over-year growth 2024-2029 (%)
- Exhibits160: Data Table on UK - Year-over-year growth 2024-2029 (%)
- Exhibits161: Chart on Canada - Market size and forecast 2024-2029 ($ million)
- Exhibits162: Data Table on Canada - Market size and forecast 2024-2029 ($ million)
- Exhibits163: Chart on Canada - Year-over-year growth 2024-2029 (%)
- Exhibits164: Data Table on Canada - Year-over-year growth 2024-2029 (%)
- Exhibits165: Chart on South Korea - Market size and forecast 2024-2029 ($ million)
- Exhibits166: Data Table on South Korea - Market size and forecast 2024-2029 ($ million)
- Exhibits167: Chart on South Korea - Year-over-year growth 2024-2029 (%)
- Exhibits168: Data Table on South Korea - Year-over-year growth 2024-2029 (%)
- Exhibits169: Chart on Italy - Market size and forecast 2024-2029 ($ million)
- Exhibits170: Data Table on Italy - Market size and forecast 2024-2029 ($ million)
- Exhibits171: Chart on Italy - Year-over-year growth 2024-2029 (%)
- Exhibits172: Data Table on Italy - Year-over-year growth 2024-2029 (%)
- Exhibits173: Market opportunity By Geographical Landscape ($ million)
- Exhibits174: Data Tables on Market opportunity By Geographical Landscape ($ million)
- Exhibits175: Impact of drivers and challenges in 2024 and 2029
- Exhibits176: Overview on criticality of inputs and factors of differentiation
- Exhibits177: Overview on factors of disruption
- Exhibits178: Impact of key risks on business
- Exhibits179: Companies covered
- Exhibits180: Company ranking index
- Exhibits181: Matrix on companies position and classification
- Exhibits182: AllTranstek L.L.C - Overview
- Exhibits183: AllTranstek L.L.C - Product / Service
- Exhibits184: AllTranstek L.L.C - Key offerings
- Exhibits185: SWOT
- Exhibits186: Arcadis NV - Overview
- Exhibits187: Arcadis NV - Business segments
- Exhibits188: Arcadis NV - Key offerings
- Exhibits189: Arcadis NV - Segment focus
- Exhibits190: SWOT
- Exhibits191: CRX SOFTWARE - Overview
- Exhibits192: CRX SOFTWARE - Product / Service
- Exhibits193: CRX SOFTWARE - Key offerings
- Exhibits194: SWOT
- Exhibits195: GMV Innovating Solutions SL - Overview
- Exhibits196: GMV Innovating Solutions SL - Product / Service
- Exhibits197: GMV Innovating Solutions SL - Key offerings
- Exhibits198: SWOT
- Exhibits199: KLS Logistics Services Inc. - Overview
- Exhibits200: KLS Logistics Services Inc. - Product / Service
- Exhibits201: KLS Logistics Services Inc. - Key offerings
- Exhibits202: SWOT
- Exhibits203: Network Rail Consulting. - Overview
- Exhibits204: Network Rail Consulting. - Product / Service
- Exhibits205: Network Rail Consulting. - Key offerings
- Exhibits206: SWOT
- Exhibits207: ORBCOMM Inc. - Overview
- Exhibits208: ORBCOMM Inc. - Product / Service
- Exhibits209: ORBCOMM Inc. - Key offerings
- Exhibits210: SWOT
- Exhibits211: Railcar Tracking Co. - Overview
- Exhibits212: Railcar Tracking Co. - Product / Service
- Exhibits213: Railcar Tracking Co. - Key offerings
- Exhibits214: SWOT
- Exhibits215: Railnova SA - Overview
- Exhibits216: Railnova SA - Product / Service
- Exhibits217: Railnova SA - Key offerings
- Exhibits218: SWOT
- Exhibits219: Ricardo Plc - Overview
- Exhibits220: Ricardo Plc - Business segments
- Exhibits221: Ricardo Plc - Key offerings
- Exhibits222: Ricardo Plc - Segment focus
- Exhibits223: SWOT
- Exhibits224: Sultran Ltd. - Overview
- Exhibits225: Sultran Ltd. - Product / Service
- Exhibits226: Sultran Ltd. - Key offerings
- Exhibits227: SWOT
- Exhibits228: The Greenbrier Companies Inc. - Overview
- Exhibits229: The Greenbrier Companies Inc. - Business segments
- Exhibits230: The Greenbrier Companies Inc. - Key news
- Exhibits231: The Greenbrier Companies Inc. - Key offerings
- Exhibits232: The Greenbrier Companies Inc. - Segment focus
- Exhibits233: SWOT
- Exhibits234: Trimble Inc. - Overview
- Exhibits235: Trimble Inc. - Business segments
- Exhibits236: Trimble Inc. - Key news
- Exhibits237: Trimble Inc. - Key offerings
- Exhibits238: Trimble Inc. - Segment focus
- Exhibits239: SWOT
- Exhibits240: VTG Aktiengesellschaft - Overview
- Exhibits241: VTG Aktiengesellschaft - Product / Service
- Exhibits242: VTG Aktiengesellschaft - Key offerings
- Exhibits243: SWOT
- Exhibits244: Westinghouse Air Brake Technologies Corp. - Overview
- Exhibits245: Westinghouse Air Brake Technologies Corp. - Business segments
- Exhibits246: Westinghouse Air Brake Technologies Corp. - Key offerings
- Exhibits247: Westinghouse Air Brake Technologies Corp. - Segment focus
- Exhibits248: SWOT
- Exhibits249: Inclusions checklist
- Exhibits250: Exclusions checklist
- Exhibits251: Currency conversion rates for US$
- Exhibits252: Research methodology
- Exhibits253: Information sources
- Exhibits254: Data validation
- Exhibits255: Validation techniques employed for market sizing
- Exhibits256: Data synthesis
- Exhibits257: 360 degree market analysis
- Exhibits258: List of abbreviations
The railway fleet management market is forecasted to grow by USD 4,287.9 mn during 2024-2029, accelerating at a CAGR of 13.6% during the forecast period. The report on the railway fleet management market provides a holistic analysis, market size and forecast, trends, growth drivers, and challenges, as well as vendor analysis covering around 25 vendors.
The report offers an up-to-date analysis regarding the current market scenario, the latest trends and drivers, and the overall market environment. The market is driven by growth in adoption of wireless technology in railway industry, growing need for operational competency, and technological advancements in railway fleet management.
| Market Scope | |
|---|---|
| Base Year | 2025 |
| End Year | 2029 |
| Series Year | 2025-2029 |
| Growth Momentum | Accelerate |
| YOY 2025 | 12.1% |
| CAGR | 13.6% |
| Incremental Value | $4,287.9 mn |
The study was conducted using an objective combination of primary and secondary information including inputs from key participants in the industry. The report contains a comprehensive market size data, segment with regional analysis and vendor landscape in addition to an analysis of the key companies. Reports have historic and forecast data.
Technavio's railway fleet management market is segmented as below:
By Communication Technology
- GNSS
- Cellular system
By Component
- Software
- Hardware
- Services
By Application
- Passenger rail
- Freight rail
- High-speed rail
By Solution
- Asset tracking
- Predictive maintenance
- Performance monitoring
By Geographical Landscape
- APAC
- Europe
- North America
- Middle East and Africa
- South America
This study identifies the growing adoption of cloud computing for streamlining fleet management operations as one of the prime reasons driving the railway fleet management market growth during the next few years. Also, emergence of digital twins for railway asset management and climate change and resulting need for sustainable, clean, and high-speed transport will lead to sizable demand in the market.
The report on the railway fleet management market covers the following areas:
- Railway Fleet Management Market sizing
- Railway Fleet Management Market forecast
- Railway Fleet Management Market industry analysis
The robust vendor analysis is designed to help clients improve their market position, and in line with this, this report provides a detailed analysis of several leading railway fleet management market vendors that include AllTranstek L.L.C, Arcadis NV, CRX SOFTWARE, Geotab Inc., GMV Innovating Solutions SL, HaslerRail AG, KLS Logistics Services Inc., Masternaut Ltd., Network Rail Consulting., ORBCOMM Inc., Railcar Tracking Co., Railnova SA, Ricardo PLC, Sultran Ltd., The Greenbrier Companies Inc., Trimble Inc., VTG Aktiengesellschaft, and Westinghouse Air Brake Technologies Corp.. Also, the railway fleet management market analysis report includes information on upcoming trends and challenges that will influence market growth. This is to help companies strategize and leverage all forthcoming growth opportunities.
The publisher presents a detailed picture of the market by the way of study, synthesis, and summation of data from multiple sources by an analysis of key parameters such as profit, pricing, competition, and promotions. It presents various market facets by identifying the key industry influencers. The data presented is comprehensive, reliable, and a result of extensive primary and secondary research. The market research reports provide a complete competitive landscape and an in-depth vendor selection methodology and analysis using qualitative and quantitative research to forecast accurate market growth.
Table of Contents
1 Executive Summary
- 1.1 Market overview
- Executive Summary - Chart on Market Overview
- Executive Summary - Data Table on Market Overview
- Executive Summary - Chart on Global Market Characteristics
- Executive Summary - Chart on Market By Geographical Landscape
- Executive Summary - Chart on Market Segmentation by Communication Technology
- Executive Summary - Chart on Market Segmentation by Component
- Executive Summary - Chart on Market Segmentation by Application
- Executive Summary - Chart on Market Segmentation by Solution
- Executive Summary - Chart on Incremental Growth
- Executive Summary - Data Table on Incremental Growth
- Executive Summary - Chart on Company Market Positioning
2 Technavio Analysis
- 2.1 Analysis of price sensitivity, lifecycle, customer purchase basket, adoption rates, and purchase criteria
- Analysis of price sensitivity, lifecycle, customer purchase basket, adoption rates, and purchase criteria
- 2.2 Criticality of inputs and Factors of differentiation
- Overview on criticality of inputs and factors of differentiation
- 2.3 Factors of disruption
- Overview on factors of disruption
- 2.4 Impact of drivers and challenges
- Impact of drivers and challenges in 2024 and 2029
3 Market Landscape
- 3.1 Market ecosystem
- Parent Market
- Data Table on - Parent Market
- 3.2 Market characteristics
- Market characteristics analysis
- 3.3 Value chain analysis
- Value chain analysis
4 Market Sizing
- 4.1 Market definition
- Offerings of companies included in the market definition
- 4.2 Market segment analysis
- Market segments
- 4.3 Market size 2024
- 4.4 Market outlook: Forecast for 2024-2029
- Chart on Global - Market size and forecast 2024-2029 ($ million)
- Data Table on Global - Market size and forecast 2024-2029 ($ million)
- Chart on Global Market: Year-over-year growth 2024-2029 (%)
- Data Table on Global Market: Year-over-year growth 2024-2029 (%)
5 Historic Market Size
- 5.1 Global Railway Fleet Management Market 2019 - 2023
- Historic Market Size - Data Table on Global Railway Fleet Management Market 2019 - 2023 ($ million)
- 5.2 Communication Technology segment analysis 2019 - 2023
- Historic Market Size - Communication Technology Segment 2019 - 2023 ($ million)
- 5.3 Component segment analysis 2019 - 2023
- Historic Market Size - Component Segment 2019 - 2023 ($ million)
- 5.4 Application segment analysis 2019 - 2023
- Historic Market Size - Application Segment 2019 - 2023 ($ million)
- 5.5 Solution segment analysis 2019 - 2023
- Historic Market Size - Solution Segment 2019 - 2023 ($ million)
- 5.6 Geography segment analysis 2019 - 2023
- Historic Market Size - Geography Segment 2019 - 2023 ($ million)
- 5.7 Country segment analysis 2019 - 2023
- Historic Market Size - Country Segment 2019 - 2023 ($ million)
6 Qualitative Analysis
- 6.1 The AI impact on Global Railway Fleet Management Market
7 Five Forces Analysis
- 7.1 Five forces summary
- Five forces analysis - Comparison between 2024 and 2029
- 7.2 Bargaining power of buyers
- Bargaining power of buyers - Impact of key factors 2024 and 2029
- 7.3 Bargaining power of suppliers
- Bargaining power of suppliers - Impact of key factors in 2024 and 2029
- 7.4 Threat of new entrants
- Threat of new entrants - Impact of key factors in 2024 and 2029
- 7.5 Threat of substitutes
- Threat of substitutes - Impact of key factors in 2024 and 2029
- 7.6 Threat of rivalry
- Threat of rivalry - Impact of key factors in 2024 and 2029
- 7.7 Market condition
- Chart on Market condition - Five forces 2024 and 2029
8 Market Segmentation by Communication Technology
- 8.1 Market segments
- Chart on Communication Technology - Market share 2024-2029 (%)
- Data Table on Communication Technology - Market share 2024-2029 (%)
- 8.2 Comparison by Communication Technology
- Chart on Comparison by Communication Technology
- Data Table on Comparison by Communication Technology
- 8.3 GNSS - Market size and forecast 2024-2029
- Chart on GNSS - Market size and forecast 2024-2029 ($ million)
- Data Table on GNSS - Market size and forecast 2024-2029 ($ million)
- Chart on GNSS - Year-over-year growth 2024-2029 (%)
- Data Table on GNSS - Year-over-year growth 2024-2029 (%)
- 8.4 Cellular system - Market size and forecast 2024-2029
- Chart on Cellular system - Market size and forecast 2024-2029 ($ million)
- Data Table on Cellular system - Market size and forecast 2024-2029 ($ million)
- Chart on Cellular system - Year-over-year growth 2024-2029 (%)
- Data Table on Cellular system - Year-over-year growth 2024-2029 (%)
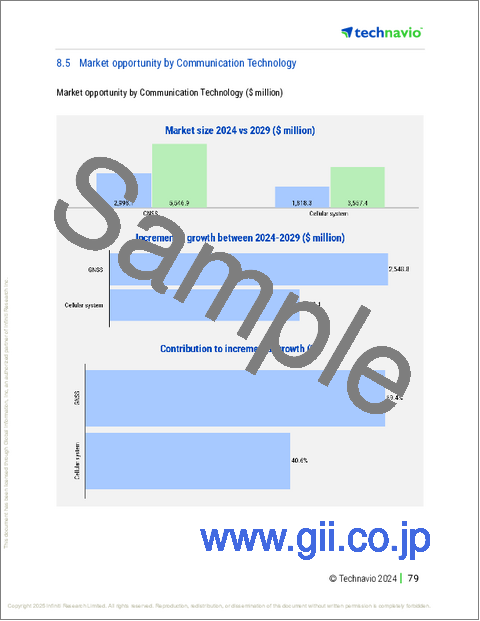
- 8.5 Market opportunity by Communication Technology
- Market opportunity by Communication Technology ($ million)
- Data Table on Market opportunity by Communication Technology ($ million)
9 Market Segmentation by Component
- 9.1 Market segments
- Chart on Component - Market share 2024-2029 (%)
- Data Table on Component - Market share 2024-2029 (%)
- 9.2 Comparison by Component
- Chart on Comparison by Component
- Data Table on Comparison by Component
- 9.3 Software - Market size and forecast 2024-2029
- Chart on Software - Market size and forecast 2024-2029 ($ million)
- Data Table on Software - Market size and forecast 2024-2029 ($ million)
- Chart on Software - Year-over-year growth 2024-2029 (%)
- Data Table on Software - Year-over-year growth 2024-2029 (%)
- 9.4 Hardware - Market size and forecast 2024-2029
- Chart on Hardware - Market size and forecast 2024-2029 ($ million)
- Data Table on Hardware - Market size and forecast 2024-2029 ($ million)
- Chart on Hardware - Year-over-year growth 2024-2029 (%)
- Data Table on Hardware - Year-over-year growth 2024-2029 (%)
- 9.5 Services - Market size and forecast 2024-2029
- Chart on Services - Market size and forecast 2024-2029 ($ million)
- Data Table on Services - Market size and forecast 2024-2029 ($ million)
- Chart on Services - Year-over-year growth 2024-2029 (%)
- Data Table on Services - Year-over-year growth 2024-2029 (%)
- 9.6 Market opportunity by Component
- Market opportunity by Component ($ million)
- Data Table on Market opportunity by Component ($ million)
10 Market Segmentation by Application
- 10.1 Market segments
- Chart on Application - Market share 2024-2029 (%)
- Data Table on Application - Market share 2024-2029 (%)
- 10.2 Comparison by Application
- Chart on Comparison by Application
- Data Table on Comparison by Application
- 10.3 Passenger rail - Market size and forecast 2024-2029
- Chart on Passenger rail - Market size and forecast 2024-2029 ($ million)
- Data Table on Passenger rail - Market size and forecast 2024-2029 ($ million)
- Chart on Passenger rail - Year-over-year growth 2024-2029 (%)
- Data Table on Passenger rail - Year-over-year growth 2024-2029 (%)
- 10.4 Freight rail - Market size and forecast 2024-2029
- Chart on Freight rail - Market size and forecast 2024-2029 ($ million)
- Data Table on Freight rail - Market size and forecast 2024-2029 ($ million)
- Chart on Freight rail - Year-over-year growth 2024-2029 (%)
- Data Table on Freight rail - Year-over-year growth 2024-2029 (%)
- 10.5 High-speed rail - Market size and forecast 2024-2029
- Chart on High-speed rail - Market size and forecast 2024-2029 ($ million)
- Data Table on High-speed rail - Market size and forecast 2024-2029 ($ million)
- Chart on High-speed rail - Year-over-year growth 2024-2029 (%)
- Data Table on High-speed rail - Year-over-year growth 2024-2029 (%)
- 10.6 Market opportunity by Application
- Market opportunity by Application ($ million)
- Data Table on Market opportunity by Application ($ million)
11 Market Segmentation by Solution
- 11.1 Market segments
- Chart on Solution - Market share 2024-2029 (%)
- Data Table on Solution - Market share 2024-2029 (%)
- 11.2 Comparison by Solution
- Chart on Comparison by Solution
- Data Table on Comparison by Solution
- 11.3 Asset tracking - Market size and forecast 2024-2029
- Chart on Asset tracking - Market size and forecast 2024-2029 ($ million)
- Data Table on Asset tracking - Market size and forecast 2024-2029 ($ million)
- Chart on Asset tracking - Year-over-year growth 2024-2029 (%)
- Data Table on Asset tracking - Year-over-year growth 2024-2029 (%)
- 11.4 Predictive maintenance - Market size and forecast 2024-2029
- Chart on Predictive maintenance - Market size and forecast 2024-2029 ($ million)
- Data Table on Predictive maintenance - Market size and forecast 2024-2029 ($ million)
- Chart on Predictive maintenance - Year-over-year growth 2024-2029 (%)
- Data Table on Predictive maintenance - Year-over-year growth 2024-2029 (%)
- 11.5 Performance monitoring - Market size and forecast 2024-2029
- Chart on Performance monitoring - Market size and forecast 2024-2029 ($ million)
- Data Table on Performance monitoring - Market size and forecast 2024-2029 ($ million)
- Chart on Performance monitoring - Year-over-year growth 2024-2029 (%)
- Data Table on Performance monitoring - Year-over-year growth 2024-2029 (%)
- 11.6 Market opportunity by Solution
- Market opportunity by Solution ($ million)
- Data Table on Market opportunity by Solution ($ million)
12 Customer Landscape
- 12.1 Customer landscape overview
- Analysis of price sensitivity, lifecycle, customer purchase basket, adoption rates, and purchase criteria
13 Geographic Landscape
- 13.1 Geographic segmentation
- Chart on Market share By Geographical Landscape 2024-2029 (%)
- Data Table on Market share By Geographical Landscape 2024-2029 (%)
- 13.2 Geographic comparison
- Chart on Geographic comparison
- Data Table on Geographic comparison
- 13.3 APAC - Market size and forecast 2024-2029
- Chart on APAC - Market size and forecast 2024-2029 ($ million)
- Data Table on APAC - Market size and forecast 2024-2029 ($ million)
- Chart on APAC - Year-over-year growth 2024-2029 (%)
- Data Table on APAC - Year-over-year growth 2024-2029 (%)
- 13.4 Europe - Market size and forecast 2024-2029
- Chart on Europe - Market size and forecast 2024-2029 ($ million)
- Data Table on Europe - Market size and forecast 2024-2029 ($ million)
- Chart on Europe - Year-over-year growth 2024-2029 (%)
- Data Table on Europe - Year-over-year growth 2024-2029 (%)
- 13.5 North America - Market size and forecast 2024-2029
- Chart on North America - Market size and forecast 2024-2029 ($ million)
- Data Table on North America - Market size and forecast 2024-2029 ($ million)
- Chart on North America - Year-over-year growth 2024-2029 (%)
- Data Table on North America - Year-over-year growth 2024-2029 (%)
- 13.6 Middle East and Africa - Market size and forecast 2024-2029
- Chart on Middle East and Africa - Market size and forecast 2024-2029 ($ million)
- Data Table on Middle East and Africa - Market size and forecast 2024-2029 ($ million)
- Chart on Middle East and Africa - Year-over-year growth 2024-2029 (%)
- Data Table on Middle East and Africa - Year-over-year growth 2024-2029 (%)
- 13.7 South America - Market size and forecast 2024-2029
- Chart on South America - Market size and forecast 2024-2029 ($ million)
- Data Table on South America - Market size and forecast 2024-2029 ($ million)
- Chart on South America - Year-over-year growth 2024-2029 (%)
- Data Table on South America - Year-over-year growth 2024-2029 (%)
- 13.8 China - Market size and forecast 2024-2029
- Chart on China - Market size and forecast 2024-2029 ($ million)
- Data Table on China - Market size and forecast 2024-2029 ($ million)
- Chart on China - Year-over-year growth 2024-2029 (%)
- Data Table on China - Year-over-year growth 2024-2029 (%)
- 13.9 India - Market size and forecast 2024-2029
- Chart on India - Market size and forecast 2024-2029 ($ million)
- Data Table on India - Market size and forecast 2024-2029 ($ million)
- Chart on India - Year-over-year growth 2024-2029 (%)
- Data Table on India - Year-over-year growth 2024-2029 (%)
- 13.10 US - Market size and forecast 2024-2029
- Chart on US - Market size and forecast 2024-2029 ($ million)
- Data Table on US - Market size and forecast 2024-2029 ($ million)
- Chart on US - Year-over-year growth 2024-2029 (%)
- Data Table on US - Year-over-year growth 2024-2029 (%)
- 13.11 Germany - Market size and forecast 2024-2029
- Chart on Germany - Market size and forecast 2024-2029 ($ million)
- Data Table on Germany - Market size and forecast 2024-2029 ($ million)
- Chart on Germany - Year-over-year growth 2024-2029 (%)
- Data Table on Germany - Year-over-year growth 2024-2029 (%)
- 13.12 France - Market size and forecast 2024-2029
- Chart on France - Market size and forecast 2024-2029 ($ million)
- Data Table on France - Market size and forecast 2024-2029 ($ million)
- Chart on France - Year-over-year growth 2024-2029 (%)
- Data Table on France - Year-over-year growth 2024-2029 (%)
- 13.13 Japan - Market size and forecast 2024-2029
- Chart on Japan - Market size and forecast 2024-2029 ($ million)
- Data Table on Japan - Market size and forecast 2024-2029 ($ million)
- Chart on Japan - Year-over-year growth 2024-2029 (%)
- Data Table on Japan - Year-over-year growth 2024-2029 (%)
- 13.14 UK - Market size and forecast 2024-2029
- Chart on UK - Market size and forecast 2024-2029 ($ million)
- Data Table on UK - Market size and forecast 2024-2029 ($ million)
- Chart on UK - Year-over-year growth 2024-2029 (%)
- Data Table on UK - Year-over-year growth 2024-2029 (%)
- 13.15 Canada - Market size and forecast 2024-2029
- Chart on Canada - Market size and forecast 2024-2029 ($ million)
- Data Table on Canada - Market size and forecast 2024-2029 ($ million)
- Chart on Canada - Year-over-year growth 2024-2029 (%)
- Data Table on Canada - Year-over-year growth 2024-2029 (%)
- 13.16 South Korea - Market size and forecast 2024-2029
- Chart on South Korea - Market size and forecast 2024-2029 ($ million)
- Data Table on South Korea - Market size and forecast 2024-2029 ($ million)
- Chart on South Korea - Year-over-year growth 2024-2029 (%)
- Data Table on South Korea - Year-over-year growth 2024-2029 (%)
- 13.17 Italy - Market size and forecast 2024-2029
- Chart on Italy - Market size and forecast 2024-2029 ($ million)
- Data Table on Italy - Market size and forecast 2024-2029 ($ million)
- Chart on Italy - Year-over-year growth 2024-2029 (%)
- Data Table on Italy - Year-over-year growth 2024-2029 (%)
- 13.18 Market opportunity By Geographical Landscape
- Market opportunity By Geographical Landscape ($ million)
- Data Tables on Market opportunity By Geographical Landscape ($ million)
14 Drivers, Challenges, and Opportunity/Restraints
- 14.1 Market drivers
- 14.2 Market challenges
- 14.3 Impact of drivers and challenges
- Impact of drivers and challenges in 2024 and 2029
- 14.4 Market opportunities/restraints
15 Competitive Landscape
- 15.1 Overview
- 15.2 Competitive Landscape
- Overview on criticality of inputs and factors of differentiation
- 15.3 Landscape disruption
- Overview on factors of disruption
- 15.4 Industry risks
- Impact of key risks on business
16 Competitive Analysis
- 16.1 Companies profiled
- Companies covered
- 16.2 Company ranking index
- Company ranking index
- 16.3 Market positioning of companies
- Matrix on companies position and classification
- 16.4 AllTranstek L.L.C
- AllTranstek L.L.C - Overview
- AllTranstek L.L.C - Product / Service
- AllTranstek L.L.C - Key offerings
- SWOT
- 16.5 Arcadis NV
- Arcadis NV - Overview
- Arcadis NV - Business segments
- Arcadis NV - Key offerings
- Arcadis NV - Segment focus
- SWOT
- 16.6 CRX SOFTWARE
- CRX SOFTWARE - Overview
- CRX SOFTWARE - Product / Service
- CRX SOFTWARE - Key offerings
- SWOT
- 16.7 GMV Innovating Solutions SL
- GMV Innovating Solutions SL - Overview
- GMV Innovating Solutions SL - Product / Service
- GMV Innovating Solutions SL - Key offerings
- SWOT
- 16.8 KLS Logistics Services Inc.
- KLS Logistics Services Inc. - Overview
- KLS Logistics Services Inc. - Product / Service
- KLS Logistics Services Inc. - Key offerings
- SWOT
- 16.9 Network Rail Consulting.
- Network Rail Consulting. - Overview
- Network Rail Consulting. - Product / Service
- Network Rail Consulting. - Key offerings
- SWOT
- 16.10 ORBCOMM Inc.
- ORBCOMM Inc. - Overview
- ORBCOMM Inc. - Product / Service
- ORBCOMM Inc. - Key offerings
- SWOT
- 16.11 Railcar Tracking Co.
- Railcar Tracking Co. - Overview
- Railcar Tracking Co. - Product / Service
- Railcar Tracking Co. - Key offerings
- SWOT
- 16.12 Railnova SA
- Railnova SA - Overview
- Railnova SA - Product / Service
- Railnova SA - Key offerings
- SWOT
- 16.13 Ricardo Plc
- Ricardo Plc - Overview
- Ricardo Plc - Business segments
- Ricardo Plc - Key offerings
- Ricardo Plc - Segment focus
- SWOT
- 16.14 Sultran Ltd.
- Sultran Ltd. - Overview
- Sultran Ltd. - Product / Service
- Sultran Ltd. - Key offerings
- SWOT
- 16.15 The Greenbrier Companies Inc.
- The Greenbrier Companies Inc. - Overview
- The Greenbrier Companies Inc. - Business segments
- The Greenbrier Companies Inc. - Key news
- The Greenbrier Companies Inc. - Key offerings
- The Greenbrier Companies Inc. - Segment focus
- SWOT
- 16.16 Trimble Inc.
- Trimble Inc. - Overview
- Trimble Inc. - Business segments
- Trimble Inc. - Key news
- Trimble Inc. - Key offerings
- Trimble Inc. - Segment focus
- SWOT
- 16.17 VTG Aktiengesellschaft
- VTG Aktiengesellschaft - Overview
- VTG Aktiengesellschaft - Product / Service
- VTG Aktiengesellschaft - Key offerings
- SWOT
- 16.18 Westinghouse Air Brake Technologies Corp.
- Westinghouse Air Brake Technologies Corp. - Overview
- Westinghouse Air Brake Technologies Corp. - Business segments
- Westinghouse Air Brake Technologies Corp. - Key offerings
- Westinghouse Air Brake Technologies Corp. - Segment focus
- SWOT
17 Appendix
- 17.1 Scope of the report
- 17.2 Inclusions and exclusions checklist
- Inclusions checklist
- Exclusions checklist
- 17.3 Currency conversion rates for US$
- Currency conversion rates for US$
- 17.4 Research methodology
- Research methodology
- 17.5 Data procurement
- Information sources
- 17.6 Data validation
- Data validation
- 17.7 Validation techniques employed for market sizing
- Validation techniques employed for market sizing
- 17.8 Data synthesis
- Data synthesis
- 17.9 360 degree market analysis
- 360 degree market analysis
- 17.10 List of abbreviations
- List of abbreviations

