|
|
市場調査レポート
商品コード
1516012
モバイルフードサービスの世界市場 2024-2028Global Mobile food services market 2024-2028 |
||||||

|
|||||||
カスタマイズ可能
|
|||||||

| モバイルフードサービスの世界市場 2024-2028 |
|
出版日: 2024年06月13日
発行: TechNavio
ページ情報: 英文 163 Pages
納期: 即納可能
|

全表示
- 概要
- 図表
- 目次
モバイルフードサービス市場は2023-2028年に177億米ドル、予測期間中のCAGRは9.48%で成長すると予測されます。
当レポートでは、モバイルフードサービス市場の全体的な分析、市場規模・予測、動向、成長促進要因、課題、約25のベンダーを網羅したベンダー分析などを掲載しています。
現在の市場シナリオ、最新動向と促進要因、市場環境全体に関する最新分析を提供しています。市場は、コンビニエンス食品に対する需要の高まり、実店舗レストランに対する移動式フードサービス店舗の優位性、費用対効果の高い起業家精神によって牽引されています。
| 市場範囲 | |
|---|---|
| 基準年 | 2024 |
| 終了年 | 2028 |
| 予測期間 | 2024-2028 |
| 成長モメンタム | 加速 |
| 前年比2024年 | 8.41% |
| CAGR | 9.48% |
| 増分額 | 177億米ドル |
本調査では、今後数年間のモバイルフードサービス市場の成長を促進する主な要因の1つとして、マーケティングイニシアティブの増加を挙げています。また、改良された機器や包装の使用、グルテンフリー食品への需要の高まりは、市場の大きな需要につながります。
目次
第1章 エグゼクティブサマリー
- 市場概要
第2章 市場情勢
- 市場エコシステム
- 市場の特徴
- バリューチェーン分析
第3章 市場規模の評価
- 市場の定義
- 市場セグメント分析
- 市場規模 2023
- 市場の見通し 2023-2028
第4章 市場規模実績
- 世界モバイルフードサービス市場 2018-2022
- タイプ別セグメント分析 2018-2022
- 用途別セグメント分析 2018-2022
- 地域別セグメント分析 2018-2022
- 国別セグメント分析 2018-2022
第5章 ファイブフォース分析
- ファイブフォースの要約
- 買い手の交渉力
- 供給企業の交渉力
- 新規参入業者の脅威
- 代替品の脅威
- 競争の脅威
- 市況
第6章 市場セグメンテーション:タイプ別
- 市場セグメンテーション
- 比較:タイプ別
- 食品:市場規模と予測 2023-2028
- 飲料:市場規模と予測 2023-2028
- 市場機会:タイプ別
第7章 市場セグメンテーション:用途別
- 市場セグメンテーション
- 比較:用途別
- 屋台:市場規模と予測 2023-2028
- リムーバブルコンテナ:市場規模と予測 2023-2028
- 市場機会:用途別
第8章 顧客情勢
- 顧客情勢の概要
第9章 地域別情勢
- 地域別セグメンテーション
- 地域別比較
- 北米:市場規模と予測 2023-2028
- アジア太平洋:市場規模と予測 2023-2028
- 欧州:市場規模と予測 2023-2028
- 南米:市場規模と予測 2023-2028
- 中東・アフリカ:市場規模と予測 2023-2028
- 米国:市場規模と予測 2023-2028
- 中国:市場規模と予測 2023-2028
- 英国:市場規模と予測 2023-2028
- 日本:市場規模と予測 2023-2028
- ドイツ:市場規模と予測 2023-2028
- 市場機会:地域情勢別
第10章 促進要因・課題・機会・抑制要因
- 市場促進要因
- 市場の課題
- 促進要因と課題の影響
- 市場の機会・抑制要因
第11章 競合情勢
- 概要
- 競合情勢
- 混乱の状況
- 業界のリスク
第12章 競合分析
- 企業プロファイル
- 企業の市場ポジショニング
- Chick fil A Inc.
- Chipotle Mexican Grill Inc.
- Courageous Bakery and Cafe
- Darden Restaurants Inc
- Eat Drink Collective
- Kogi BBQ
- KoJa Kitchen LLC
- McDonald Corp.
- Phat Cart
- Restaurant Brands International Inc.
- The Grilled Cheeserie
- The Subway Group
- World Famous House of Mac
- YUM Brands Inc.
- Yumbii
第13章 付録
Exhibits:
- Exhibits1: Executive Summary - Chart on Market Overview
- Exhibits2: Executive Summary - Data Table on Market Overview
- Exhibits3: Executive Summary - Chart on Global Market Characteristics
- Exhibits4: Executive Summary - Chart on Market By Geographical Landscape
- Exhibits5: Executive Summary - Chart on Market Segmentation by Type
- Exhibits6: Executive Summary - Chart on Market Segmentation by Application
- Exhibits7: Executive Summary - Chart on Incremental Growth
- Exhibits8: Executive Summary - Data Table on Incremental Growth
- Exhibits9: Executive Summary - Chart on Company Market Positioning
- Exhibits10: Parent Market
- Exhibits11: Data Table on - Parent Market
- Exhibits12: Market characteristics analysis
- Exhibits13: Value Chain Analysis
- Exhibits14: Offerings of companies included in the market definition
- Exhibits15: Market segments
- Exhibits16: Chart on Global - Market size and forecast 2023-2028 ($ billion)
- Exhibits17: Data Table on Global - Market size and forecast 2023-2028 ($ billion)
- Exhibits18: Chart on Global Market: Year-over-year growth 2023-2028 (%)
- Exhibits19: Data Table on Global Market: Year-over-year growth 2023-2028 (%)
- Exhibits20: Historic Market Size - Data Table on Global Mobile Food Services Market 2018 - 2022 ($ billion)
- Exhibits21: Historic Market Size - Type Segment 2018 - 2022 ($ billion)
- Exhibits22: Historic Market Size - Application Segment 2018 - 2022 ($ billion)
- Exhibits23: Historic Market Size - Geography Segment 2018 - 2022 ($ billion)
- Exhibits24: Historic Market Size - Country Segment 2018 - 2022 ($ billion)
- Exhibits25: Five forces analysis - Comparison between 2023 and 2028
- Exhibits26: Bargaining power of buyers - Impact of key factors 2023 and 2028
- Exhibits27: Bargaining power of suppliers - Impact of key factors in 2023 and 2028
- Exhibits28: Threat of new entrants - Impact of key factors in 2023 and 2028
- Exhibits29: Threat of substitutes - Impact of key factors in 2023 and 2028
- Exhibits30: Threat of rivalry - Impact of key factors in 2023 and 2028
- Exhibits31: Chart on Market condition - Five forces 2023 and 2028
- Exhibits32: Chart on Type - Market share 2023-2028 (%)
- Exhibits33: Data Table on Type - Market share 2023-2028 (%)
- Exhibits34: Chart on Comparison by Type
- Exhibits35: Data Table on Comparison by Type
- Exhibits36: Chart on Food - Market size and forecast 2023-2028 ($ billion)
- Exhibits37: Data Table on Food - Market size and forecast 2023-2028 ($ billion)
- Exhibits38: Chart on Food - Year-over-year growth 2023-2028 (%)
- Exhibits39: Data Table on Food - Year-over-year growth 2023-2028 (%)
- Exhibits40: Chart on Beverages - Market size and forecast 2023-2028 ($ billion)
- Exhibits41: Data Table on Beverages - Market size and forecast 2023-2028 ($ billion)
- Exhibits42: Chart on Beverages - Year-over-year growth 2023-2028 (%)
- Exhibits43: Data Table on Beverages - Year-over-year growth 2023-2028 (%)
- Exhibits44: Market opportunity by Type ($ billion)
- Exhibits45: Data Table on Market opportunity by Type ($ billion)
- Exhibits46: Chart on Application - Market share 2023-2028 (%)
- Exhibits47: Data Table on Application - Market share 2023-2028 (%)
- Exhibits48: Chart on Comparison by Application
- Exhibits49: Data Table on Comparison by Application
- Exhibits50: Chart on Food truck - Market size and forecast 2023-2028 ($ billion)
- Exhibits51: Data Table on Food truck - Market size and forecast 2023-2028 ($ billion)
- Exhibits52: Chart on Food truck - Year-over-year growth 2023-2028 (%)
- Exhibits53: Data Table on Food truck - Year-over-year growth 2023-2028 (%)
- Exhibits54: Chart on Removable container - Market size and forecast 2023-2028 ($ billion)
- Exhibits55: Data Table on Removable container - Market size and forecast 2023-2028 ($ billion)
- Exhibits56: Chart on Removable container - Year-over-year growth 2023-2028 (%)
- Exhibits57: Data Table on Removable container - Year-over-year growth 2023-2028 (%)
- Exhibits58: Market opportunity by Application ($ billion)
- Exhibits59: Data Table on Market opportunity by Application ($ billion)
- Exhibits60: Analysis of price sensitivity, lifecycle, customer purchase basket, adoption rates, and purchase criteria
- Exhibits61: Chart on Market share By Geographical Landscape 2023-2028 (%)
- Exhibits62: Data Table on Market share By Geographical Landscape 2023-2028 (%)
- Exhibits63: Chart on Geographic comparison
- Exhibits64: Data Table on Geographic comparison
- Exhibits65: Chart on North America - Market size and forecast 2023-2028 ($ billion)
- Exhibits66: Data Table on North America - Market size and forecast 2023-2028 ($ billion)
- Exhibits67: Chart on North America - Year-over-year growth 2023-2028 (%)
- Exhibits68: Data Table on North America - Year-over-year growth 2023-2028 (%)
- Exhibits69: Chart on APAC - Market size and forecast 2023-2028 ($ billion)
- Exhibits70: Data Table on APAC - Market size and forecast 2023-2028 ($ billion)
- Exhibits71: Chart on APAC - Year-over-year growth 2023-2028 (%)
- Exhibits72: Data Table on APAC - Year-over-year growth 2023-2028 (%)
- Exhibits73: Chart on Europe - Market size and forecast 2023-2028 ($ billion)
- Exhibits74: Data Table on Europe - Market size and forecast 2023-2028 ($ billion)
- Exhibits75: Chart on Europe - Year-over-year growth 2023-2028 (%)
- Exhibits76: Data Table on Europe - Year-over-year growth 2023-2028 (%)
- Exhibits77: Chart on South America - Market size and forecast 2023-2028 ($ billion)
- Exhibits78: Data Table on South America - Market size and forecast 2023-2028 ($ billion)
- Exhibits79: Chart on South America - Year-over-year growth 2023-2028 (%)
- Exhibits80: Data Table on South America - Year-over-year growth 2023-2028 (%)
- Exhibits81: Chart on Middle East and Africa - Market size and forecast 2023-2028 ($ billion)
- Exhibits82: Data Table on Middle East and Africa - Market size and forecast 2023-2028 ($ billion)
- Exhibits83: Chart on Middle East and Africa - Year-over-year growth 2023-2028 (%)
- Exhibits84: Data Table on Middle East and Africa - Year-over-year growth 2023-2028 (%)
- Exhibits85: Chart on US - Market size and forecast 2023-2028 ($ billion)
- Exhibits86: Data Table on US - Market size and forecast 2023-2028 ($ billion)
- Exhibits87: Chart on US - Year-over-year growth 2023-2028 (%)
- Exhibits88: Data Table on US - Year-over-year growth 2023-2028 (%)
- Exhibits89: Chart on China - Market size and forecast 2023-2028 ($ billion)
- Exhibits90: Data Table on China - Market size and forecast 2023-2028 ($ billion)
- Exhibits91: Chart on China - Year-over-year growth 2023-2028 (%)
- Exhibits92: Data Table on China - Year-over-year growth 2023-2028 (%)
- Exhibits93: Chart on UK - Market size and forecast 2023-2028 ($ billion)
- Exhibits94: Data Table on UK - Market size and forecast 2023-2028 ($ billion)
- Exhibits95: Chart on UK - Year-over-year growth 2023-2028 (%)
- Exhibits96: Data Table on UK - Year-over-year growth 2023-2028 (%)
- Exhibits97: Chart on Japan - Market size and forecast 2023-2028 ($ billion)
- Exhibits98: Data Table on Japan - Market size and forecast 2023-2028 ($ billion)
- Exhibits99: Chart on Japan - Year-over-year growth 2023-2028 (%)
- Exhibits100: Data Table on Japan - Year-over-year growth 2023-2028 (%)
- Exhibits101: Chart on Germany - Market size and forecast 2023-2028 ($ billion)
- Exhibits102: Data Table on Germany - Market size and forecast 2023-2028 ($ billion)
- Exhibits103: Chart on Germany - Year-over-year growth 2023-2028 (%)
- Exhibits104: Data Table on Germany - Year-over-year growth 2023-2028 (%)
- Exhibits105: Market opportunity By Geographical Landscape ($ billion)
- Exhibits106: Data Tables on Market opportunity By Geographical Landscape ($ billion)
- Exhibits107: Impact of drivers and challenges in 2023 and 2028
- Exhibits108: Overview on criticality of inputs and factors of differentiation
- Exhibits109: Overview on factors of disruption
- Exhibits110: Impact of key risks on business
- Exhibits111: Companies covered
- Exhibits112: Matrix on companies position and classification
- Exhibits113: Chick fil A Inc. - Overview
- Exhibits114: Chick fil A Inc. - Product / Service
- Exhibits115: Chick fil A Inc. - Key offerings
- Exhibits116: Chipotle Mexican Grill Inc. - Overview
- Exhibits117: Chipotle Mexican Grill Inc. - Product / Service
- Exhibits118: Chipotle Mexican Grill Inc. - Key offerings
- Exhibits119: Courageous Bakery and Cafe - Overview
- Exhibits120: Courageous Bakery and Cafe - Product / Service
- Exhibits121: Courageous Bakery and Cafe - Key offerings
- Exhibits122: Darden Restaurants Inc - Overview
- Exhibits123: Darden Restaurants Inc - Business segments
- Exhibits124: Darden Restaurants Inc - Key offerings
- Exhibits125: Darden Restaurants Inc - Segment focus
- Exhibits126: Eat Drink Collective - Overview
- Exhibits127: Eat Drink Collective - Product / Service
- Exhibits128: Eat Drink Collective - Key offerings
- Exhibits129: Kogi BBQ - Overview
- Exhibits130: Kogi BBQ - Product / Service
- Exhibits131: Kogi BBQ - Key offerings
- Exhibits132: KoJa Kitchen LLC - Overview
- Exhibits133: KoJa Kitchen LLC - Product / Service
- Exhibits134: KoJa Kitchen LLC - Key offerings
- Exhibits135: McDonald Corp. - Overview
- Exhibits136: McDonald Corp. - Business segments
- Exhibits137: McDonald Corp. - Key news
- Exhibits138: McDonald Corp. - Key offerings
- Exhibits139: McDonald Corp. - Segment focus
- Exhibits140: Phat Cart - Overview
- Exhibits141: Phat Cart - Product / Service
- Exhibits142: Phat Cart - Key offerings
- Exhibits143: Restaurant Brands International Inc. - Overview
- Exhibits144: Restaurant Brands International Inc. - Business segments
- Exhibits145: Restaurant Brands International Inc. - Key news
- Exhibits146: Restaurant Brands International Inc. - Key offerings
- Exhibits147: Restaurant Brands International Inc. - Segment focus
- Exhibits148: The Grilled Cheeserie - Overview
- Exhibits149: The Grilled Cheeserie - Product / Service
- Exhibits150: The Grilled Cheeserie - Key offerings
- Exhibits151: The Subway Group - Overview
- Exhibits152: The Subway Group - Product / Service
- Exhibits153: The Subway Group - Key news
- Exhibits154: The Subway Group - Key offerings
- Exhibits155: World Famous House of Mac - Overview
- Exhibits156: World Famous House of Mac - Product / Service
- Exhibits157: World Famous House of Mac - Key offerings
- Exhibits158: YUM Brands Inc. - Overview
- Exhibits159: YUM Brands Inc. - Business segments
- Exhibits160: YUM Brands Inc. - Key offerings
- Exhibits161: YUM Brands Inc. - Segment focus
- Exhibits162: Yumbii - Overview
- Exhibits163: Yumbii - Product / Service
- Exhibits164: Yumbii - Key offerings
- Exhibits165: Inclusions checklist
- Exhibits166: Exclusions checklist
- Exhibits167: Currency conversion rates for US$
- Exhibits168: Research methodology
- Exhibits169: Information sources
- Exhibits170: Data validation
- Exhibits171: Validation techniques employed for market sizing
- Exhibits172: Data synthesis
- Exhibits173: 360 degree market analysis
- Exhibits174: List of abbreviations
The mobile food services market is forecasted to grow by USD 17.7 bn during 2023-2028, accelerating at a CAGR of 9.48% during the forecast period. The report on the mobile food services market provides a holistic analysis, market size and forecast, trends, growth drivers, and challenges, as well as vendor analysis covering around 25 vendors.
The report offers an up-to-date analysis regarding the current market scenario, the latest trends and drivers, and the overall market environment. The market is driven by rising demand for convenience foods, advantages of mobile food service outlets over brick-and-mortar restaurants, and cost-effective entrepreneurship.
Technavio's mobile food services market is segmented as below:
| Market Scope | |
|---|---|
| Base Year | 2024 |
| End Year | 2028 |
| Series Year | 2024-2028 |
| Growth Momentum | Accelerate |
| YOY 2024 | 8.41% |
| CAGR | 9.48% |
| Incremental Value | $17.7bn |
By Type
- Food
- Beverages
By Application
- Food truck
- Removable container
By Geographical Landscape
- North America
- APAC
- Europe
- South America
- Middle East and Africa
This study identifies the increasing marketing initiatives as one of the prime reasons driving the mobile food services market growth during the next few years. Also, use of improved equipment and packaging and rise in demand for gluten-free food products will lead to sizable demand in the market.
The report on the mobile food services market covers the following areas:
- Mobile food services market sizing
- Mobile food services market forecast
- Mobile food services market industry analysis
The robust vendor analysis is designed to help clients improve their market position, and in line with this, this report provides a detailed analysis of several leading mobile food services market vendors that include Belgo Holdings LLC, Chick fil A Inc., Chipotle Mexican Grill Inc., Cocoa Forte Franchising LLC, Courageous Bakery and Cafe, Darden Restaurants Inc, Eat Drink Collective, Kogi BBQ, KoJa Kitchen LLC, Lukes Seafood LLC, McDonald Corp., Ms Cheezious, Phat Cart, Restaurant Brands International Inc., The Grilled Cheeserie, The Subway Group, Waffle Bus, World Famous House of Mac, YUM Brands Inc., and Yumbii. Also, the mobile food services market analysis report includes information on upcoming trends and challenges that will influence market growth. This is to help companies strategize and leverage all forthcoming growth opportunities.
The study was conducted using an objective combination of primary and secondary information including inputs from key participants in the industry. The report contains a comprehensive market and vendor landscape in addition to an analysis of the key vendors.
The publisher presents a detailed picture of the market by the way of study, synthesis, and summation of data from multiple sources by an analysis of key parameters such as profit, pricing, competition, and promotions. It presents various market facets by identifying the key industry influencers. The data presented is comprehensive, reliable, and a result of extensive research - both primary and secondary. The market research reports provide a complete competitive landscape and an in-depth vendor selection methodology and analysis using qualitative and quantitative research to forecast the accurate market growth.
Table of Contents
1 Executive Summary
- 1.1 Market overview
- Executive Summary - Chart on Market Overview
- Executive Summary - Data Table on Market Overview
- Executive Summary - Chart on Global Market Characteristics
- Executive Summary - Chart on Market By Geographical Landscape
- Executive Summary - Chart on Market Segmentation by Type
- Executive Summary - Chart on Market Segmentation by Application
- Executive Summary - Chart on Incremental Growth
- Executive Summary - Data Table on Incremental Growth
- Executive Summary - Chart on Company Market Positioning
2 Market Landscape
- 2.1 Market ecosystem
- Parent Market
- Data Table on - Parent Market
- 2.2 Market characteristics
- Market characteristics analysis
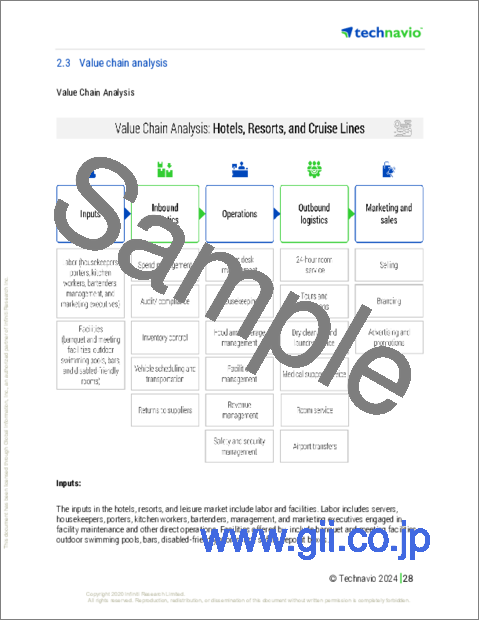
- 2.3 Value chain analysis
- Value Chain Analysis
3 Market Sizing
- 3.1 Market definition
- Offerings of companies included in the market definition
- 3.2 Market segment analysis
- Market segments
- 3.3 Market size 2023
- 3.4 Market outlook: Forecast for 2023-2028
- Chart on Global - Market size and forecast 2023-2028 ($ billion)
- Data Table on Global - Market size and forecast 2023-2028 ($ billion)
- Chart on Global Market: Year-over-year growth 2023-2028 (%)
- Data Table on Global Market: Year-over-year growth 2023-2028 (%)
4 Historic Market Size
- 4.1 Global Mobile Food Services Market 2018 - 2022
- Historic Market Size - Data Table on Global Mobile Food Services Market 2018 - 2022 ($ billion)
- 4.2 Type segment analysis 2018 - 2022
- Historic Market Size - Type Segment 2018 - 2022 ($ billion)
- 4.3 Application segment analysis 2018 - 2022
- Historic Market Size - Application Segment 2018 - 2022 ($ billion)
- 4.4 Geography segment analysis 2018 - 2022
- Historic Market Size - Geography Segment 2018 - 2022 ($ billion)
- 4.5 Country segment analysis 2018 - 2022
- Historic Market Size - Country Segment 2018 - 2022 ($ billion)
5 Five Forces Analysis
- 5.1 Five forces summary
- Five forces analysis - Comparison between 2023 and 2028
- 5.2 Bargaining power of buyers
- Bargaining power of buyers - Impact of key factors 2023 and 2028
- 5.3 Bargaining power of suppliers
- Bargaining power of suppliers - Impact of key factors in 2023 and 2028
- 5.4 Threat of new entrants
- Threat of new entrants - Impact of key factors in 2023 and 2028
- 5.5 Threat of substitutes
- Threat of substitutes - Impact of key factors in 2023 and 2028
- 5.6 Threat of rivalry
- Threat of rivalry - Impact of key factors in 2023 and 2028
- 5.7 Market condition
- Chart on Market condition - Five forces 2023 and 2028
6 Market Segmentation by Type
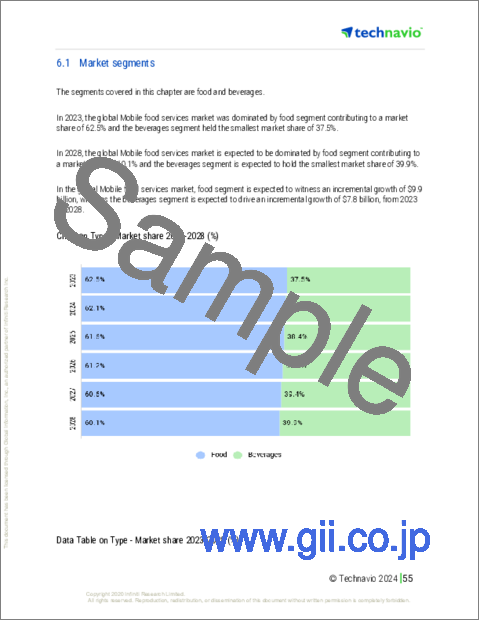
- 6.1 Market segments
- Chart on Type - Market share 2023-2028 (%)
- Data Table on Type - Market share 2023-2028 (%)
- 6.2 Comparison by Type
- Chart on Comparison by Type
- Data Table on Comparison by Type
- 6.3 Food - Market size and forecast 2023-2028
- Chart on Food - Market size and forecast 2023-2028 ($ billion)
- Data Table on Food - Market size and forecast 2023-2028 ($ billion)
- Chart on Food - Year-over-year growth 2023-2028 (%)
- Data Table on Food - Year-over-year growth 2023-2028 (%)
- 6.4 Beverages - Market size and forecast 2023-2028
- Chart on Beverages - Market size and forecast 2023-2028 ($ billion)
- Data Table on Beverages - Market size and forecast 2023-2028 ($ billion)
- Chart on Beverages - Year-over-year growth 2023-2028 (%)
- Data Table on Beverages - Year-over-year growth 2023-2028 (%)
- 6.5 Market opportunity by Type
- Market opportunity by Type ($ billion)
- Data Table on Market opportunity by Type ($ billion)
7 Market Segmentation by Application
- 7.1 Market segments
- Chart on Application - Market share 2023-2028 (%)
- Data Table on Application - Market share 2023-2028 (%)
- 7.2 Comparison by Application
- Chart on Comparison by Application
- Data Table on Comparison by Application
- 7.3 Food truck - Market size and forecast 2023-2028
- Chart on Food truck - Market size and forecast 2023-2028 ($ billion)
- Data Table on Food truck - Market size and forecast 2023-2028 ($ billion)
- Chart on Food truck - Year-over-year growth 2023-2028 (%)
- Data Table on Food truck - Year-over-year growth 2023-2028 (%)
- 7.4 Removable container - Market size and forecast 2023-2028
- Chart on Removable container - Market size and forecast 2023-2028 ($ billion)
- Data Table on Removable container - Market size and forecast 2023-2028 ($ billion)
- Chart on Removable container - Year-over-year growth 2023-2028 (%)
- Data Table on Removable container - Year-over-year growth 2023-2028 (%)
- 7.5 Market opportunity by Application
- Market opportunity by Application ($ billion)
- Data Table on Market opportunity by Application ($ billion)
8 Customer Landscape
- 8.1 Customer landscape overview
- Analysis of price sensitivity, lifecycle, customer purchase basket, adoption rates, and purchase criteria
9 Geographic Landscape
- 9.1 Geographic segmentation
- Chart on Market share By Geographical Landscape 2023-2028 (%)
- Data Table on Market share By Geographical Landscape 2023-2028 (%)
- 9.2 Geographic comparison
- Chart on Geographic comparison
- Data Table on Geographic comparison
- 9.3 North America - Market size and forecast 2023-2028
- Chart on North America - Market size and forecast 2023-2028 ($ billion)
- Data Table on North America - Market size and forecast 2023-2028 ($ billion)
- Chart on North America - Year-over-year growth 2023-2028 (%)
- Data Table on North America - Year-over-year growth 2023-2028 (%)
- 9.4 APAC - Market size and forecast 2023-2028
- Chart on APAC - Market size and forecast 2023-2028 ($ billion)
- Data Table on APAC - Market size and forecast 2023-2028 ($ billion)
- Chart on APAC - Year-over-year growth 2023-2028 (%)
- Data Table on APAC - Year-over-year growth 2023-2028 (%)
- 9.5 Europe - Market size and forecast 2023-2028
- Chart on Europe - Market size and forecast 2023-2028 ($ billion)
- Data Table on Europe - Market size and forecast 2023-2028 ($ billion)
- Chart on Europe - Year-over-year growth 2023-2028 (%)
- Data Table on Europe - Year-over-year growth 2023-2028 (%)
- 9.6 South America - Market size and forecast 2023-2028
- Chart on South America - Market size and forecast 2023-2028 ($ billion)
- Data Table on South America - Market size and forecast 2023-2028 ($ billion)
- Chart on South America - Year-over-year growth 2023-2028 (%)
- Data Table on South America - Year-over-year growth 2023-2028 (%)
- 9.7 Middle East and Africa - Market size and forecast 2023-2028
- Chart on Middle East and Africa - Market size and forecast 2023-2028 ($ billion)
- Data Table on Middle East and Africa - Market size and forecast 2023-2028 ($ billion)
- Chart on Middle East and Africa - Year-over-year growth 2023-2028 (%)
- Data Table on Middle East and Africa - Year-over-year growth 2023-2028 (%)
- 9.8 US - Market size and forecast 2023-2028
- Chart on US - Market size and forecast 2023-2028 ($ billion)
- Data Table on US - Market size and forecast 2023-2028 ($ billion)
- Chart on US - Year-over-year growth 2023-2028 (%)
- Data Table on US - Year-over-year growth 2023-2028 (%)
- 9.9 China - Market size and forecast 2023-2028
- Chart on China - Market size and forecast 2023-2028 ($ billion)
- Data Table on China - Market size and forecast 2023-2028 ($ billion)
- Chart on China - Year-over-year growth 2023-2028 (%)
- Data Table on China - Year-over-year growth 2023-2028 (%)
- 9.10 UK - Market size and forecast 2023-2028
- Chart on UK - Market size and forecast 2023-2028 ($ billion)
- Data Table on UK - Market size and forecast 2023-2028 ($ billion)
- Chart on UK - Year-over-year growth 2023-2028 (%)
- Data Table on UK - Year-over-year growth 2023-2028 (%)
- 9.11 Japan - Market size and forecast 2023-2028
- Chart on Japan - Market size and forecast 2023-2028 ($ billion)
- Data Table on Japan - Market size and forecast 2023-2028 ($ billion)
- Chart on Japan - Year-over-year growth 2023-2028 (%)
- Data Table on Japan - Year-over-year growth 2023-2028 (%)
- 9.12 Germany - Market size and forecast 2023-2028
- Chart on Germany - Market size and forecast 2023-2028 ($ billion)
- Data Table on Germany - Market size and forecast 2023-2028 ($ billion)
- Chart on Germany - Year-over-year growth 2023-2028 (%)
- Data Table on Germany - Year-over-year growth 2023-2028 (%)
- 9.13 Market opportunity By Geographical Landscape
- Market opportunity By Geographical Landscape ($ billion)
- Data Tables on Market opportunity By Geographical Landscape ($ billion)
10 Drivers, Challenges, and Opportunity/Restraints
- 10.1 Market drivers
- 10.2 Market challenges
- 10.3 Impact of drivers and challenges
- Impact of drivers and challenges in 2023 and 2028
- 10.4 Market opportunities/restraints
11 Competitive Landscape
- 11.1 Overview
- 11.2 Competitive Landscape
- Overview on criticality of inputs and factors of differentiation
- 11.3 Landscape disruption
- Overview on factors of disruption
- 11.4 Industry risks
- Impact of key risks on business
12 Competitive Analysis
- 12.1 Companies profiled
- Companies covered
- 12.2 Market positioning of companies
- Matrix on companies position and classification
- 12.3 Chick fil A Inc.
- Chick fil A Inc. - Overview
- Chick fil A Inc. - Product / Service
- Chick fil A Inc. - Key offerings
- 12.4 Chipotle Mexican Grill Inc.
- Chipotle Mexican Grill Inc. - Overview
- Chipotle Mexican Grill Inc. - Product / Service
- Chipotle Mexican Grill Inc. - Key offerings
- 12.5 Courageous Bakery and Cafe
- Courageous Bakery and Cafe - Overview
- Courageous Bakery and Cafe - Product / Service
- Courageous Bakery and Cafe - Key offerings
- 12.6 Darden Restaurants Inc
- Darden Restaurants Inc - Overview
- Darden Restaurants Inc - Business segments
- Darden Restaurants Inc - Key offerings
- Darden Restaurants Inc - Segment focus
- 12.7 Eat Drink Collective
- Eat Drink Collective - Overview
- Eat Drink Collective - Product / Service
- Eat Drink Collective - Key offerings
- 12.8 Kogi BBQ
- Kogi BBQ - Overview
- Kogi BBQ - Product / Service
- Kogi BBQ - Key offerings
- 12.9 KoJa Kitchen LLC
- KoJa Kitchen LLC - Overview
- KoJa Kitchen LLC - Product / Service
- KoJa Kitchen LLC - Key offerings
- 12.10 McDonald Corp.
- McDonald Corp. - Overview
- McDonald Corp. - Business segments
- McDonald Corp. - Key news
- McDonald Corp. - Key offerings
- McDonald Corp. - Segment focus
- 12.11 Phat Cart
- Phat Cart - Overview
- Phat Cart - Product / Service
- Phat Cart - Key offerings
- 12.12 Restaurant Brands International Inc.
- Restaurant Brands International Inc. - Overview
- Restaurant Brands International Inc. - Business segments
- Restaurant Brands International Inc. - Key news
- Restaurant Brands International Inc. - Key offerings
- Restaurant Brands International Inc. - Segment focus
- 12.13 The Grilled Cheeserie
- The Grilled Cheeserie - Overview
- The Grilled Cheeserie - Product / Service
- The Grilled Cheeserie - Key offerings
- 12.14 The Subway Group
- The Subway Group - Overview
- The Subway Group - Product / Service
- The Subway Group - Key news
- The Subway Group - Key offerings
- 12.15 World Famous House of Mac
- World Famous House of Mac - Overview
- World Famous House of Mac - Product / Service
- World Famous House of Mac - Key offerings
- 12.16 YUM Brands Inc.
- YUM Brands Inc. - Overview
- YUM Brands Inc. - Business segments
- YUM Brands Inc. - Key offerings
- YUM Brands Inc. - Segment focus
- 12.17 Yumbii
- Yumbii - Overview
- Yumbii - Product / Service
- Yumbii - Key offerings
13 Appendix
- 13.1 Scope of the report
- 13.2 Inclusions and exclusions checklist
- Inclusions checklist
- Exclusions checklist
- 13.3 Currency conversion rates for US$
- Currency conversion rates for US$
- 13.4 Research methodology
- Research methodology
- 13.5 Data procurement
- Information sources
- 13.6 Data validation
- Data validation
- 13.7 Validation techniques employed for market sizing
- Validation techniques employed for market sizing
- 13.8 Data synthesis
- Data synthesis
- 13.9 360 degree market analysis
- 360 degree market analysis
- 13.10 List of abbreviations
- List of abbreviations

