|
|
市場調査レポート
商品コード
1859839
自動車用トランスミッション・エレクトロニクスの世界市場 2025-2029Global Automotive Transmission Electronics Market 2025-2029 |
||||||
|
|||||||
カスタマイズ可能
|
|||||||


| 自動車用トランスミッション・エレクトロニクスの世界市場 2025-2029 |
|
出版日: 2025年08月29日
発行: TechNavio
ページ情報: 英文 238 Pages
納期: 即納可能
|

概要
自動車用トランスミッション・エレクトロニクス市場は2024-2029年に72億4,590万米ドル、予測期間中のCAGRは6.1%で成長すると予測されます。
当レポートでは、自動車用トランスミッション・エレクトロニクス市場の全体的な分析、市場規模・予測、動向、成長促進要因、課題、約25のベンダーを網羅したベンダー分析などを掲載しています。
現在の市場シナリオ、最新動向と促進要因、市場環境全体に関する最新分析を提供しています。市場は、シフトバイワイヤ技術の浸透、ティプトロニックトランスミッションシステムにおける先進エレクトロニクスの使用、オートマチックトランスミッションシステムに対する需要の高まりによって牽引されています。
| 市場範囲 | |
|---|---|
| 基準年 | 2025 |
| 終了年 | 2029 |
| 予測期間 | 2025-2029 |
| 成長モメンタム | 加速 |
| 前年比 | 5.2% |
| CAGR | 6.1% |
| 増分額 | 72億4,590万米ドル |
本調査は、業界の主要参加者からのインプットを含め、一次情報と二次情報を客観的に組み合わせて実施しました。レポートには、主要企業の分析に加え、包括的な市場規模データ、地域別分析によるセグメント、ベンダー情勢が含まれています。レポートには過去データと予測データがあります。
本調査では、今後数年間の自動車用トランスミッション・エレクトロニクス市場の成長を促進する主な要因の1つとして、パワースプリットCVTシステムの採用拡大を挙げています。また、アダプティブトランスミッション制御を備えたオートシフトマニュアルトランスミッションシステムの市場開拓や、電気駆動ユニットを形成するための他のシステムとのトランスミッションの統合は、市場の大きな需要につながります。
目次
第1章 エグゼクティブサマリー
- 市場概要
第2章 Technavio分析
- 価格・ライフサイクル・顧客購入バスケット・採用率・購入基準の分析
- インプットの重要性と差別化の要因
- 混乱の要因
- 促進要因と課題の影響
第3章 市場情勢
- 市場エコシステム
- 市場の特徴
- バリューチェーン分析
第4章 市場規模
- 市場の定義
- 市場セグメント分析
- 市場規模 2024
- 市場の見通し 2024-2029
第5章 市場規模実績
- 自動車用トランスミッション・エレクトロニクスの世界市場 2019-2023
- 車両タイプセグメント分析 2019-2023
- 部品セグメント分析 2019-2023
- タイプセグメント分析 2019-2023
- 地域別セグメント分析 2019-2023
- 国別セグメント分析 2019-2023
第6章 定性分析
- 自動車用トランスミッションエレクトロニクスの世界市場におけるAIのインパクト自動車用トランスミッション・エレクトロニクスの世界市場
第7章 ファイブフォース分析
- ファイブフォースの要約
- 買い手の交渉力
- 供給企業の交渉力
- 新規参入業者の脅威
- 代替品の脅威
- 競争の脅威
- 市況
第8章 市場セグメンテーション:車両タイプ別
- 市場セグメント
- 比較:車両タイプ別
- 乗用車:市場規模と予測 2024-2029
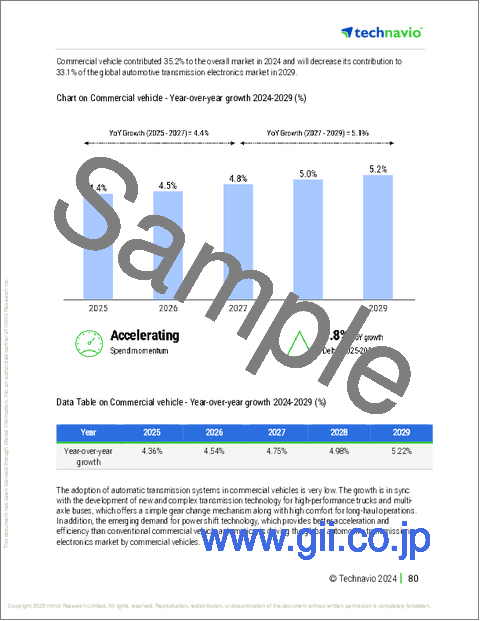
- 商用車:市場規模と予測 2024-2029
- 市場機会:車両タイプ別
第9章 市場セグメンテーション:コンポーネント別
- 市場セグメント
- 比較:コンポーネント別
- センサー:市場規模と予測 2024-2029
- 操作ユニット:市場規模と予測 2024-2029
- 電子制御ユニット:市場規模と予測 2024-2029
- 市場機会:コンポーネント別
第10章 市場セグメンテーション:タイプ別
- 市場セグメント
- 比較:タイプ別
- オートマチックトランスミッション:市場規模と予測 2024-2029
- 無段変速機:市場規模と予測 2024-2029
- デュアルクラッチトランスミッション:市場規模と予測 2024-2029
- マニュアルトランスミッション:市場規模と予測 2024-2029
- 市場機会:タイプ別
第11章 顧客情勢
- 顧客情勢の概要
第12章 地域別情勢
- 地域別セグメンテーション
- 地域別比較
- アジア太平洋:市場規模と予測 2024-2029
- 欧州:市場規模と予測 2024-2029
- 北米:市場規模と予測 2024-2029
- 南米:市場規模と予測 2024-2029
- 中東・アフリカ:市場規模と予測 2024-2029
- 米国:市場規模と予測 2024-2029
- 日本:市場規模と予測 2024-2029
- 中国:市場規模と予測 2024-2029
- インド:市場規模と予測 2024-2029
- 韓国:市場規模と予測 2024-2029
- ドイツ:市場規模と予測 2024-2029
- オーストラリア:市場規模と予測 2024-2029
- 英国:市場規模と予測 2024-2029
- フランス:市場規模と予測 2024-2029
- カナダ:市場規模と予測 2024-2029
- 市場機会:地域情勢別
第13章 促進要因・課題・機会・抑制要因
- 市場促進要因
- 市場の課題
- 促進要因と課題の影響
- 市場の機会・抑制要因
第14章 競合情勢
- 概要
- 競合情勢
- 混乱の状況
- 業界のリスク
第15章 競合分析
- 企業プロファイル
- 企業ランキング
- 企業の市場ポジショニング
- Aptiv Plc
- BorgWarner Inc.
- Continental AG
- DENSO Corp.
- Eaton Corp. Plc
- Hitachi Ltd.
- Infineon Technologies AG
- Mitsubishi Electric Corp.
- Panasonic Holdings Corp.
- Robert Bosch GmbH
- Schaeffler AG
- STMicroelectronics International N.V.
- Texas Instruments Inc.
- Valeo SA
- ZF Friedrichshafen AG

