|
|
市場調査レポート
商品コード
1462446
レコメンデーション・エンジンの世界市場 2024-2028Global Recommendation Engine Market 2024-2028 |
||||||

|
|||||||
カスタマイズ可能
|
|||||||

| レコメンデーション・エンジンの世界市場 2024-2028 |
|
出版日: 2024年04月02日
発行: TechNavio
ページ情報: 英文 175 Pages
納期: 即納可能
|

全表示
- 概要
- 図表
- 目次
レコメンデーション・エンジン市場は2023-2028年に16億6,454万米ドル、予測期間中のCAGRは39.91%で成長すると予測されます。
当レポートでは、レコメンデーション・エンジン市場の全体的な分析、市場規模・予測、動向、成長促進要因、課題、約25のベンダーを網羅したベンダー分析などを掲載しています。
現在の市場シナリオ、最新動向と促進要因、市場環境全体に関する最新分析を提供しています。デジタル化の進展、ハイブリッド型レコメンデーションシステムの利用増加、顧客満足度向上への注力などが市場を牽引しています。
| 市場範囲 | |
|---|---|
| 基準年 | 2024 |
| 終了年 | 2028 |
| 予測期間 | 2024-2028 |
| 成長モメンタム | 加速 |
| 前年比2024年 | 39.65% |
| CAGR | 39.91% |
| 増分額 | 16億6,454万米ドル |
本調査では、今後数年間のレコメンデーション・エンジン市場成長を促進する主な理由の1つとして、パーソナライズされたレコメンデーションに対する需要の高まりを挙げています。また、レコメンデーション・エンジン新興企業によるクラウドファンディングプラットフォームを通じた資金調達や、レコメンデーション・エンジンにおけるAIの実装は、市場の大きな需要につながります。
目次
第1章 エグゼクティブサマリー
- 市場概要
第2章 市場情勢
- 市場エコシステム
第3章 市場規模の評価
- 市場の定義
- 市場セグメント分析
- 市場規模 2023
- 市場の見通し 2023-2028
第4章 市場規模実績
- レコメンデーション・エンジンの世界市場 2018-2022
- エンドユーザーセグメント分析 2018-2022
- タイプセグメント分析 2018-2022
- 地域別セグメント分析 2018-2022
- 国別セグメント分析 2018-2022
第5章 ファイブフォース分析
- ファイブフォースの要約
- 買い手の交渉力
- 供給企業の交渉力
- 新規参入業者の脅威
- 代替品の脅威
- 競争の脅威
- 市況
第6章 市場セグメンテーション:エンドユーザー別
- 市場セグメント
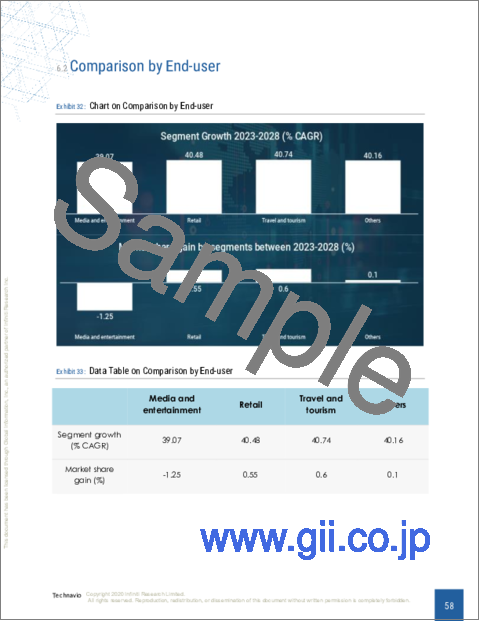
- 比較:エンドユーザー別
- メディアとエンターテイメント:市場規模と予測 2023-2028
- 小売り:市場規模と予測 2023-2028
- 旅行と観光:市場規模と予測 2023-2028
- その他:市場規模と予測 2023-2028
- 市場機会:エンドユーザー別
第7章 市場セグメンテーション:タイプ別
- 市場セグメント
- 比較:タイプ別
- クラウド:市場規模と予測 2023-2028
- オンプレミス:市場規模と予測 2023-2028
- 市場機会:タイプ別
第8章 顧客情勢
- 顧客情勢の概要
第9章 地域別情勢
- 地域別セグメンテーション
- 地域別比較
- 北米:市場規模と予測 2023-2028
- 欧州:市場規模と予測 2023-2028
- アジア太平洋:市場規模と予測 2023-2028
- 南米:市場規模と予測 2023-2028
- 中東・アフリカ:市場規模と予測 2023-2028
- 米国:市場規模と予測 2023-2028
- 中国:市場規模と予測 2023-2028
- ドイツ:市場規模と予測 2023-2028
- インド:市場規模と予測 2023-2028
- 日本:市場規模と予測 2023-2028
- 市場機会:地域情勢別
第10章 促進要因、課題、および動向
- 市場促進要因
- 市場の課題
- 促進要因と課題の影響
- 市場動向
第11章 ベンダー情勢
- 概要
- ベンダー情勢
- 混乱の状況
- 業界のリスク
第12章 ベンダー分析
- 対象ベンダー
- ベンダーの市場ポジショニング
- Adobe Inc.
- Alphabet Inc.
- Amazon.com Inc.
- Cloudera Inc.
- Curata Inc.
- Hewlett Packard Enterprise Co.
- Intel Corp.
- International Business Machines Corp.
- Kibo Software Inc.
- Mastercard Inc.
- Microsoft Corp.
- Oracle Corp.
- Outbrain Inc.
- Salesforce Inc.
- SAP SE
第13章 付録
Exhibits:
- Exhibits1: Executive Summary - Chart on Market Overview
- Exhibits2: Executive Summary - Data Table on Market Overview
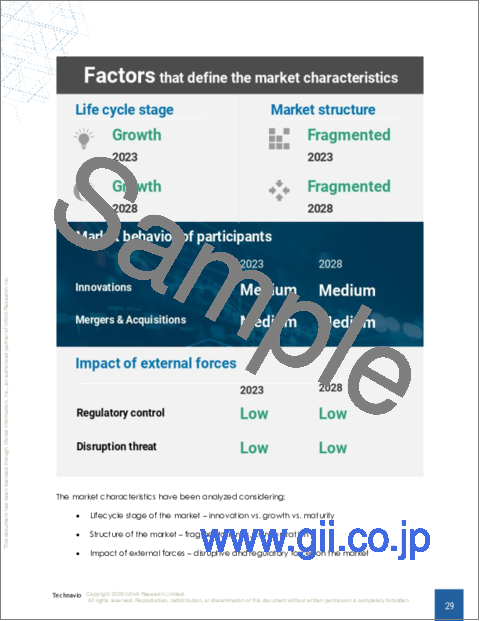
- Exhibits3: Executive Summary - Chart on Global Market Characteristics
- Exhibits4: Executive Summary - Chart on Market By Geographical Landscape
- Exhibits5: Executive Summary - Chart on Market Segmentation by End-user
- Exhibits6: Executive Summary - Chart on Market Segmentation by Type
- Exhibits7: Executive Summary - Chart on Incremental Growth
- Exhibits8: Executive Summary - Data Table on Incremental Growth
- Exhibits9: Executive Summary - Chart on Vendor Market Positioning
- Exhibits10: Parent market
- Exhibits11: Market Characteristics
- Exhibits12: Offerings of vendors included in the market definition
- Exhibits13: Market segments
- Exhibits14: Chart on Global - Market size and forecast 2023-2028 ($ million)
- Exhibits15: Data Table on Global - Market size and forecast 2023-2028 ($ million)
- Exhibits16: Chart on Global Market: Year-over-year growth 2023-2028 (%)
- Exhibits17: Data Table on Global Market: Year-over-year growth 2023-2028 (%)
- Exhibits18: Historic Market Size - Data Table on global recommendation engine market 2018 - 2022 ($ million)
- Exhibits19: Historic Market Size - End-user Segment 2018 - 2022 ($ million)
- Exhibits20: Historic Market Size - Type Segment 2018 - 2022 ($ million)
- Exhibits21: Historic Market Size - Geography Segment 2018 - 2022 ($ million)
- Exhibits22: Historic Market Size - Country Segment 2018 - 2022 ($ million)
- Exhibits23: Five forces analysis - Comparison between 2023 and 2028
- Exhibits24: Chart on Bargaining power of buyers - Impact of key factors 2023 and 2028
- Exhibits25: Bargaining power of suppliers - Impact of key factors in 2023 and 2028
- Exhibits26: Threat of new entrants - Impact of key factors in 2023 and 2028
- Exhibits27: Threat of substitutes - Impact of key factors in 2023 and 2028
- Exhibits28: Threat of rivalry - Impact of key factors in 2023 and 2028
- Exhibits29: Chart on Market condition - Five forces 2023 and 2028
- Exhibits30: Chart on End-user - Market share 2023-2028 (%)
- Exhibits31: Data Table on End-user - Market share 2023-2028 (%)
- Exhibits32: Chart on Comparison by End-user
- Exhibits33: Data Table on Comparison by End-user
- Exhibits34: Chart on Media and entertainment - Market size and forecast 2023-2028 ($ million)
- Exhibits35: Data Table on Media and entertainment - Market size and forecast 2023-2028 ($ million)
- Exhibits36: Chart on Media and entertainment - Year-over-year growth 2023-2028 (%)
- Exhibits37: Data Table on Media and entertainment - Year-over-year growth 2023-2028 (%)
- Exhibits38: Chart on Retail - Market size and forecast 2023-2028 ($ million)
- Exhibits39: Data Table on Retail - Market size and forecast 2023-2028 ($ million)
- Exhibits40: Chart on Retail - Year-over-year growth 2023-2028 (%)
- Exhibits41: Data Table on Retail - Year-over-year growth 2023-2028 (%)
- Exhibits42: Chart on Travel and tourism - Market size and forecast 2023-2028 ($ million)
- Exhibits43: Data Table on Travel and tourism - Market size and forecast 2023-2028 ($ million)
- Exhibits44: Chart on Travel and tourism - Year-over-year growth 2023-2028 (%)
- Exhibits45: Data Table on Travel and tourism - Year-over-year growth 2023-2028 (%)
- Exhibits46: Chart on Others - Market size and forecast 2023-2028 ($ million)
- Exhibits47: Data Table on Others - Market size and forecast 2023-2028 ($ million)
- Exhibits48: Chart on Others - Year-over-year growth 2023-2028 (%)
- Exhibits49: Data Table on Others - Year-over-year growth 2023-2028 (%)
- Exhibits50: Market opportunity by End-user ($ million)
- Exhibits51: Data Table on Market opportunity by End-user ($ million)
- Exhibits52: Chart on Type - Market share 2023-2028 (%)
- Exhibits53: Data Table on Type - Market share 2023-2028 (%)
- Exhibits54: Chart on Comparison by Type
- Exhibits55: Data Table on Comparison by Type
- Exhibits56: Chart on Cloud - Market size and forecast 2023-2028 ($ million)
- Exhibits57: Data Table on Cloud - Market size and forecast 2023-2028 ($ million)
- Exhibits58: Chart on Cloud - Year-over-year growth 2023-2028 (%)
- Exhibits59: Data Table on Cloud - Year-over-year growth 2023-2028 (%)
- Exhibits60: Chart on On-premises - Market size and forecast 2023-2028 ($ million)
- Exhibits61: Data Table on On-premises - Market size and forecast 2023-2028 ($ million)
- Exhibits62: Chart on On-premises - Year-over-year growth 2023-2028 (%)
- Exhibits63: Data Table on On-premises - Year-over-year growth 2023-2028 (%)
- Exhibits64: Market opportunity by Type ($ million)
- Exhibits65: Data Table on Market opportunity by Type ($ million)
- Exhibits66: Analysis of price sensitivity, lifecycle, customer purchase basket, adoption rates, and purchase criteria
- Exhibits67: Chart on Market share By Geographical Landscape 2023-2028 (%)
- Exhibits68: Data Table on Market share By Geographical Landscape 2023-2028 (%)
- Exhibits69: Chart on Geographic comparison
- Exhibits70: Data Table on Geographic comparison
- Exhibits71: Chart on North America - Market size and forecast 2023-2028 ($ million)
- Exhibits72: Data Table on North America - Market size and forecast 2023-2028 ($ million)
- Exhibits73: Chart on North America - Year-over-year growth 2023-2028 (%)
- Exhibits74: Data Table on North America - Year-over-year growth 2023-2028 (%)
- Exhibits75: Chart on Europe - Market size and forecast 2023-2028 ($ million)
- Exhibits76: Data Table on Europe - Market size and forecast 2023-2028 ($ million)
- Exhibits77: Chart on Europe - Year-over-year growth 2023-2028 (%)
- Exhibits78: Data Table on Europe - Year-over-year growth 2023-2028 (%)
- Exhibits79: Chart on APAC - Market size and forecast 2023-2028 ($ million)
- Exhibits80: Data Table on APAC - Market size and forecast 2023-2028 ($ million)
- Exhibits81: Chart on APAC - Year-over-year growth 2023-2028 (%)
- Exhibits82: Data Table on APAC - Year-over-year growth 2023-2028 (%)
- Exhibits83: Chart on South America - Market size and forecast 2023-2028 ($ million)
- Exhibits84: Data Table on South America - Market size and forecast 2023-2028 ($ million)
- Exhibits85: Chart on South America - Year-over-year growth 2023-2028 (%)
- Exhibits86: Data Table on South America - Year-over-year growth 2023-2028 (%)
- Exhibits87: Chart on Middle East and Africa - Market size and forecast 2023-2028 ($ million)
- Exhibits88: Data Table on Middle East and Africa - Market size and forecast 2023-2028 ($ million)
- Exhibits89: Chart on Middle East and Africa - Year-over-year growth 2023-2028 (%)
- Exhibits90: Data Table on Middle East and Africa - Year-over-year growth 2023-2028 (%)
- Exhibits91: Chart on US - Market size and forecast 2023-2028 ($ million)
- Exhibits92: Data Table on US - Market size and forecast 2023-2028 ($ million)
- Exhibits93: Chart on US - Year-over-year growth 2023-2028 (%)
- Exhibits94: Data Table on US - Year-over-year growth 2023-2028 (%)
- Exhibits95: Chart on China - Market size and forecast 2023-2028 ($ million)
- Exhibits96: Data Table on China - Market size and forecast 2023-2028 ($ million)
- Exhibits97: Chart on China - Year-over-year growth 2023-2028 (%)
- Exhibits98: Data Table on China - Year-over-year growth 2023-2028 (%)
- Exhibits99: Chart on Germany - Market size and forecast 2023-2028 ($ million)
- Exhibits100: Data Table on Germany - Market size and forecast 2023-2028 ($ million)
- Exhibits101: Chart on Germany - Year-over-year growth 2023-2028 (%)
- Exhibits102: Data Table on Germany - Year-over-year growth 2023-2028 (%)
- Exhibits103: Chart on India - Market size and forecast 2023-2028 ($ million)
- Exhibits104: Data Table on India - Market size and forecast 2023-2028 ($ million)
- Exhibits105: Chart on India - Year-over-year growth 2023-2028 (%)
- Exhibits106: Data Table on India - Year-over-year growth 2023-2028 (%)
- Exhibits107: Chart on Japan - Market size and forecast 2023-2028 ($ million)
- Exhibits108: Data Table on Japan - Market size and forecast 2023-2028 ($ million)
- Exhibits109: Chart on Japan - Year-over-year growth 2023-2028 (%)
- Exhibits110: Data Table on Japan - Year-over-year growth 2023-2028 (%)
- Exhibits111: Market opportunity By Geographical Landscape ($ million)
- Exhibits112: Data Tables on Market opportunity By Geographical Landscape ($ million)
- Exhibits113: Impact of drivers and challenges in 2023 and 2028
- Exhibits114: Overview on Criticality of inputs and Factors of differentiation
- Exhibits115: Overview on factors of disruption
- Exhibits116: Impact of key risks on business
- Exhibits117: Vendors covered
- Exhibits118: Matrix on vendor position and classification
- Exhibits119: Adobe Inc. - Overview
- Exhibits120: Adobe Inc. - Business segments
- Exhibits121: Adobe Inc. - Key news
- Exhibits122: Adobe Inc. - Key offerings
- Exhibits123: Adobe Inc. - Segment focus
- Exhibits124: Alphabet Inc. - Overview
- Exhibits125: Alphabet Inc. - Business segments
- Exhibits126: Alphabet Inc. - Key news
- Exhibits127: Alphabet Inc. - Key offerings
- Exhibits128: Alphabet Inc. - Segment focus
- Exhibits129: Amazon.com Inc. - Overview
- Exhibits130: Amazon.com Inc. - Business segments
- Exhibits131: Amazon.com Inc. - Key offerings
- Exhibits132: Amazon.com Inc. - Segment focus
- Exhibits133: Cloudera Inc. - Overview
- Exhibits134: Cloudera Inc. - Business segments
- Exhibits135: Cloudera Inc. - Key offerings
- Exhibits136: Cloudera Inc. - Segment focus
- Exhibits137: Curata Inc. - Overview
- Exhibits138: Curata Inc. - Product / Service
- Exhibits139: Curata Inc. - Key offerings
- Exhibits140: Hewlett Packard Enterprise Co. - Overview
- Exhibits141: Hewlett Packard Enterprise Co. - Business segments
- Exhibits142: Hewlett Packard Enterprise Co. - Key news
- Exhibits143: Hewlett Packard Enterprise Co. - Key offerings
- Exhibits144: Hewlett Packard Enterprise Co. - Segment focus
- Exhibits145: Intel Corp. - Overview
- Exhibits146: Intel Corp. - Business segments
- Exhibits147: Intel Corp. - Key offerings
- Exhibits148: Intel Corp. - Segment focus
- Exhibits149: International Business Machines Corp. - Overview
- Exhibits150: International Business Machines Corp. - Business segments
- Exhibits151: International Business Machines Corp. - Key news
- Exhibits152: International Business Machines Corp. - Key offerings
- Exhibits153: International Business Machines Corp. - Segment focus
- Exhibits154: Kibo Software Inc. - Overview
- Exhibits155: Kibo Software Inc. - Product / Service
- Exhibits156: Kibo Software Inc. - Key offerings
- Exhibits157: Mastercard Inc. - Overview
- Exhibits158: Mastercard Inc. - Product / Service
- Exhibits159: Mastercard Inc. - Key news
- Exhibits160: Mastercard Inc. - Key offerings
- Exhibits161: Microsoft Corp. - Overview
- Exhibits162: Microsoft Corp. - Business segments
- Exhibits163: Microsoft Corp. - Key news
- Exhibits164: Microsoft Corp. - Key offerings
- Exhibits165: Microsoft Corp. - Segment focus
- Exhibits166: Oracle Corp. - Overview
- Exhibits167: Oracle Corp. - Business segments
- Exhibits168: Oracle Corp. - Key news
- Exhibits169: Oracle Corp. - Key offerings
- Exhibits170: Oracle Corp. - Segment focus
- Exhibits171: Outbrain Inc. - Overview
- Exhibits172: Outbrain Inc. - Key offerings
- Exhibits173: Salesforce Inc. - Overview
- Exhibits174: Salesforce Inc. - Product / Service
- Exhibits175: Salesforce Inc. - Key offerings
- Exhibits176: SAP SE - Overview
- Exhibits177: SAP SE - Business segments
- Exhibits178: SAP SE - Key news
- Exhibits179: SAP SE - Key offerings
- Exhibits180: SAP SE - Segment focus
- Exhibits181: Inclusions checklist
- Exhibits182: Exclusions checklist
- Exhibits183: Currency conversion rates for US$
- Exhibits184: Research methodology
- Exhibits185: Validation techniques employed for market sizing
- Exhibits186: Information sources
- Exhibits187: List of abbreviations
The recommendation engine market is forecasted to grow by USD 1664.54 mn during 2023-2028, accelerating at a CAGR of 39.91% during the forecast period. The report on the recommendation engine market provides a holistic analysis, market size and forecast, trends, growth drivers, and challenges, as well as vendor analysis covering around 25 vendors.
The report offers an up-to-date analysis regarding the current market scenario, the latest trends and drivers, and the overall market environment. The market is driven by rise of digitalization, increase in use of hybrid recommendation system, and focus on improving customer satisfaction.
Technavio's recommendation engine market is segmented as below:
| Market Scope | |
|---|---|
| Base Year | 2024 |
| End Year | 2028 |
| Series Year | 2024-2028 |
| Growth Momentum | Accelerate |
| YOY 2024 | 39.65% |
| CAGR | 39.91% |
| Incremental Value | $1664.54mn |
By End-user
- Media and entertainment
- Retail
- Travel and tourism
- Others
By Type
- Cloud
- On-premises
By Geographical Landscape
- North America
- Europe
- APAC
- South America
- Middle East and Africa
This study identifies the growing demand for personalized recommendations as one of the prime reasons driving the recommendation engine market growth during the next few years. Also, raising funds through crowdfunding platforms by recommendation engine startups and implementation of ai in recommendation engines will lead to sizable demand in the market.
The report on the recommendation engine market covers the following areas:
- Recommendation engine market sizing
- Recommendation engine market forecast
- Recommendation engine market industry analysis
The robust vendor analysis is designed to help clients improve their market position, and in line with this, this report provides a detailed analysis of several leading recommendation engine market vendors that include Alphabet Inc., Amazon.com Inc., Cloudera Inc., Coveo Solutions Inc., Curata Inc., Hewlett Packard Enterprise Co., Intel Corp., Kibo Software Inc., Mastercard Inc., Microsoft Corp., Muvi LLC, Nosto Solutions Oy, Oracle Corp., Outbrain Inc., Piano Software Inc., Recombee, Salesforce Inc., SAP SE, International Business Machines Corp., and Adobe Inc.. Also, the recommendation engine market analysis report includes information on upcoming trends and challenges that will influence market growth. This is to help companies strategize and leverage all forthcoming growth opportunities.
The study was conducted using an objective combination of primary and secondary information including inputs from key participants in the industry. The report contains a comprehensive market and vendor landscape in addition to an analysis of the key vendors.
The publisher presents a detailed picture of the market by the way of study, synthesis, and summation of data from multiple sources by an analysis of key parameters such as profit, pricing, competition, and promotions. It presents various market facets by identifying the key industry influencers. The data presented is comprehensive, reliable, and a result of extensive research - both primary and secondary. The market research reports provide a complete competitive landscape and an in-depth vendor selection methodology and analysis using qualitative and quantitative research to forecast the accurate market growth.
Table of Contents
1 Executive Summary
- 1.1 Market overview
2 Market Landscape
- 2.1 Market ecosystem
3 Market Sizing
- 3.1 Market definition
- 3.2 Market segment analysis
- 3.3 Market size 2023
- 3.4 Market outlook: Forecast for 2023-2028
4 Historic Market Size
- 4.1 Global recommendation engine market 2018 - 2022
- 4.2 End-user Segment Analysis 2018 - 2022
- 4.3 Type Segment Analysis 2018 - 2022
- 4.4 Geography Segment Analysis 2018 - 2022
- 4.5 Country Segment Analysis 2018 - 2022
5 Five Forces Analysis
- 5.1 Five forces summary
- 5.2 Bargaining power of buyers
- 5.3 Bargaining power of suppliers
- 5.4 Threat of new entrants
- 5.5 Threat of substitutes
- 5.6 Threat of rivalry
- 5.7 Market condition
6 Market Segmentation by End-user
- 6.1 Market segments
- 6.2 Comparison by End-user
- 6.3 Media and entertainment - Market size and forecast 2023-2028
- 6.4 Retail - Market size and forecast 2023-2028
- 6.5 Travel and tourism - Market size and forecast 2023-2028
- 6.6 Others - Market size and forecast 2023-2028
- 6.7 Market opportunity by End-user
7 Market Segmentation by Type
- 7.1 Market segments
- 7.2 Comparison by Type
- 7.3 Cloud - Market size and forecast 2023-2028
- 7.4 On-premises - Market size and forecast 2023-2028
- 7.5 Market opportunity by Type
8 Customer Landscape
- 8.1 Customer landscape overview
9 Geographic Landscape
- 9.1 Geographic segmentation
- 9.2 Geographic comparison
- 9.3 North America - Market size and forecast 2023-2028
- 9.4 Europe - Market size and forecast 2023-2028
- 9.5 APAC - Market size and forecast 2023-2028
- 9.6 South America - Market size and forecast 2023-2028
- 9.7 Middle East and Africa - Market size and forecast 2023-2028
- 9.8 US - Market size and forecast 2023-2028
- 9.9 China - Market size and forecast 2023-2028
- 9.10 Germany - Market size and forecast 2023-2028
- 9.11 India - Market size and forecast 2023-2028
- 9.12 Japan - Market size and forecast 2023-2028
- 9.13 Market opportunity By Geographical Landscape
10 Drivers, Challenges, and Trends
- 10.1 Market drivers
- 10.2 Market challenges
- 10.3 Impact of drivers and challenges
- 10.4 Market trends
11 Vendor Landscape
- 11.1 Overview
- 11.2 Vendor landscape
- 11.3 Landscape disruption
- 11.4 Industry risks
12 Vendor Analysis
- 12.1 Vendors covered
- 12.2 Market positioning of vendors
- 12.3 Adobe Inc.
- 12.4 Alphabet Inc.
- 12.5 Amazon.com Inc.
- 12.6 Cloudera Inc.
- 12.7 Curata Inc.
- 12.8 Hewlett Packard Enterprise Co.
- 12.9 Intel Corp.
- 12.10 International Business Machines Corp.
- 12.11 Kibo Software Inc.
- 12.12 Mastercard Inc.
- 12.13 Microsoft Corp.
- 12.14 Oracle Corp.
- 12.15 Outbrain Inc.
- 12.16 Salesforce Inc.
- 12.17 SAP SE
13 Appendix
- 13.1 Scope of the report
- 13.2 Inclusions and exclusions checklist
- 13.3 Currency conversion rates for US$
- 13.4 Research methodology
- 13.5 List of abbreviations

