|
|
市場調査レポート
商品コード
1516008
データセンター用UPSバッテリーの世界市場 2024-2028Global UPS battery for data center market 2024-2028 |
||||||
|
|||||||
カスタマイズ可能
|
|||||||

| データセンター用UPSバッテリーの世界市場 2024-2028 |
|
出版日: 2024年06月13日
発行: TechNavio
ページ情報: 英文 175 Pages
納期: 即納可能
|

全表示
- 概要
- 図表
- 目次
データセンター用UPSバッテリー市場は2023-2028年に21億2,550万米ドル、予測期間中のCAGRは6.59%で成長すると予測されています。
当レポートでは、データセンター用UPSバッテリー市場の全体的な分析、市場規模・予測、動向、成長促進要因、課題、約25のベンダーを網羅したベンダー分析などを掲載しています。
現在の市場シナリオ、最新動向と促進要因、市場環境全体に関する最新分析を提供しています。モジュール式UPSシステムの採用増加、グリーン設備に対する意識の高まり、電気料金の上昇などが市場を牽引しています。
| 市場範囲 | |
|---|---|
| 基準年 | 2024 |
| 終了年 | 2028 |
| 予測期間 | 2024-2028 |
| 成長モメンタム | 加速 |
| 前年比2024年 | 6.18% |
| CAGR | 6.59% |
| 増分額 | 21億2,550万米ドル |
本調査では、今後数年間のデータセンター用UPSバッテリー市場成長を牽引する主要因の1つとして、データセンター建設の伸びを挙げています。また、2N電源の冗長性を備えたコロケーション施設の建設が増加し、リチウムイオンUPSシステムの利用が拡大することで、同市場には大きな需要が見込まれます。
目次
第1章 エグゼクティブサマリー
- 市場概要
第2章 市場情勢
- 市場エコシステム
- 市場の特徴
- バリューチェーン分析
第3章 市場規模の評価
- 市場の定義
- 市場セグメント分析
- 市場規模 2023
- 市場の見通し 2023-2028
第4章 市場規模実績
- 世界データセンター用UPSバッテリー市場 2018-2022
- 用途別セグメント分析 2018-2022
- 製品別セグメント分析 2018-2022
- 地域別セグメント分析 2018-2022
- 国別セグメント分析 2018-2022
第5章 ファイブフォース分析
- ファイブフォースの要約
- 買い手の交渉力
- 供給企業の交渉力
- 新規参入業者の脅威
- 代替品の脅威
- 競争の脅威
- 市況
第6章 市場セグメンテーション:用途別
- 市場セグメンテーション
- 比較:用途別
- Tier3データセンター:市場規模と予測 2023-2028
- Tier1およびTier2データセンター:市場規模と予測 2023-2028
- Tier4データセンター:市場規模と予測 2023-2028
- 市場機会:用途別
第7章 市場セグメンテーション:製品別
- 市場セグメンテーション
- 比較:製品別
- 鉛蓄電池:市場規模と予測 2023-2028
- リチウムイオン電池:市場規模と予測 2023-2028
- 市場機会:製品別
第8章 顧客情勢
- 顧客情勢の概要
第9章 地域別情勢
- 地域別セグメンテーション
- 地域別比較
- 北米:市場規模と予測 2023-2028
- 欧州:市場規模と予測 2023-2028
- アジア太平洋:市場規模と予測 2023-2028
- 南米:市場規模と予測 2023-2028
- 中東・アフリカ:市場規模と予測 2023-2028
- 米国:市場規模と予測 2023-2028
- 英国:市場規模と予測 2023-2028
- ドイツ:市場規模と予測 2023-2028
- フランス:市場規模と予測 2023-2028
- インド:市場規模と予測 2023-2028
- 市場機会:地域情勢別
第10章 促進要因・課題・機会・抑制要因
- 市場促進要因
- 市場の課題
- 促進要因と課題の影響
- 市場の機会・抑制要因
第11章 競合情勢
- 概要
- 競合情勢
- 混乱の状況
- 業界のリスク
第12章 競合分析
- 企業プロファイル
- 企業の市場ポジショニング
- Amara Raja Group
- C and D Technologies Inc.
- Chaowei Power Holdings Ltd.
- Delta Electronics Inc.
- EaglePicher Technologies LLC
- East Penn Manufacturing Co. Inc.
- Eaton Corp. Plc
- EnerSys
- ETERNITY TECHNOLOGIES FZ LLC
- EverExceed Corp.
- Exide Industries Ltd.
- FIAMM Energy Technology Spa
- Schneider Electric SE
- TotalEnergies SE
- Vertiv Holdings Co.
第13章 付録
Exhibits:
- Exhibits1: Executive Summary - Chart on Market Overview
- Exhibits2: Executive Summary - Data Table on Market Overview
- Exhibits3: Executive Summary - Chart on Global Market Characteristics
- Exhibits4: Executive Summary - Chart on Market By Geographical Landscape
- Exhibits5: Executive Summary - Chart on Market Segmentation by Application
- Exhibits6: Executive Summary - Chart on Market Segmentation by Product
- Exhibits7: Executive Summary - Chart on Incremental Growth
- Exhibits8: Executive Summary - Data Table on Incremental Growth
- Exhibits9: Executive Summary - Chart on Company Market Positioning
- Exhibits10: Parent Market
- Exhibits11: Data Table on - Parent Market
- Exhibits12: Market characteristics analysis
- Exhibits13: Value Chain Analysis
- Exhibits14: Offerings of companies included in the market definition
- Exhibits15: Market segments
- Exhibits16: Chart on Global - Market size and forecast 2023-2028 ($ million)
- Exhibits17: Data Table on Global - Market size and forecast 2023-2028 ($ million)
- Exhibits18: Chart on Global Market: Year-over-year growth 2023-2028 (%)
- Exhibits19: Data Table on Global Market: Year-over-year growth 2023-2028 (%)
- Exhibits20: Historic Market Size - Data Table on Global UPS Battery For Data Center Market 2018 - 2022 ($ million)
- Exhibits21: Historic Market Size - Application Segment 2018 - 2022 ($ million)
- Exhibits22: Historic Market Size - Product Segment 2018 - 2022 ($ million)
- Exhibits23: Historic Market Size - Geography Segment 2018 - 2022 ($ million)
- Exhibits24: Historic Market Size - Country Segment 2018 - 2022 ($ million)
- Exhibits25: Five forces analysis - Comparison between 2023 and 2028
- Exhibits26: Bargaining power of buyers - Impact of key factors 2023 and 2028
- Exhibits27: Bargaining power of suppliers - Impact of key factors in 2023 and 2028
- Exhibits28: Threat of new entrants - Impact of key factors in 2023 and 2028
- Exhibits29: Threat of substitutes - Impact of key factors in 2023 and 2028
- Exhibits30: Threat of rivalry - Impact of key factors in 2023 and 2028
- Exhibits31: Chart on Market condition - Five forces 2023 and 2028
- Exhibits32: Chart on Application - Market share 2023-2028 (%)
- Exhibits33: Data Table on Application - Market share 2023-2028 (%)
- Exhibits34: Chart on Comparison by Application
- Exhibits35: Data Table on Comparison by Application
- Exhibits36: Chart on Tier 3 data center - Market size and forecast 2023-2028 ($ million)
- Exhibits37: Data Table on Tier 3 data center - Market size and forecast 2023-2028 ($ million)
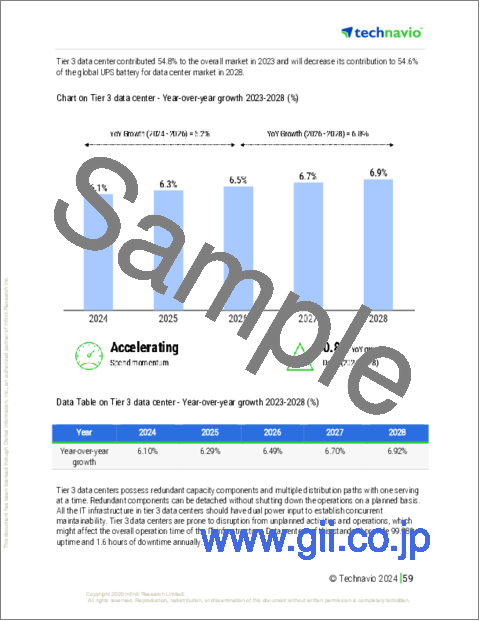
- Exhibits38: Chart on Tier 3 data center - Year-over-year growth 2023-2028 (%)
- Exhibits39: Data Table on Tier 3 data center - Year-over-year growth 2023-2028 (%)
- Exhibits40: Chart on Tier 1 and 2 data center - Market size and forecast 2023-2028 ($ million)
- Exhibits41: Data Table on Tier 1 and 2 data center - Market size and forecast 2023-2028 ($ million)
- Exhibits42: Chart on Tier 1 and 2 data center - Year-over-year growth 2023-2028 (%)
- Exhibits43: Data Table on Tier 1 and 2 data center - Year-over-year growth 2023-2028 (%)
- Exhibits44: Chart on Tier 4 data center - Market size and forecast 2023-2028 ($ million)
- Exhibits45: Data Table on Tier 4 data center - Market size and forecast 2023-2028 ($ million)
- Exhibits46: Chart on Tier 4 data center - Year-over-year growth 2023-2028 (%)
- Exhibits47: Data Table on Tier 4 data center - Year-over-year growth 2023-2028 (%)
- Exhibits48: Market opportunity by Application ($ million)
- Exhibits49: Data Table on Market opportunity by Application ($ million)
- Exhibits50: Chart on Product - Market share 2023-2028 (%)
- Exhibits51: Data Table on Product - Market share 2023-2028 (%)
- Exhibits52: Chart on Comparison by Product
- Exhibits53: Data Table on Comparison by Product
- Exhibits54: Chart on Lead acid battery - Market size and forecast 2023-2028 ($ million)
- Exhibits55: Data Table on Lead acid battery - Market size and forecast 2023-2028 ($ million)
- Exhibits56: Chart on Lead acid battery - Year-over-year growth 2023-2028 (%)
- Exhibits57: Data Table on Lead acid battery - Year-over-year growth 2023-2028 (%)
- Exhibits58: Chart on Lithium-ion battery - Market size and forecast 2023-2028 ($ million)
- Exhibits59: Data Table on Lithium-ion battery - Market size and forecast 2023-2028 ($ million)
- Exhibits60: Chart on Lithium-ion battery - Year-over-year growth 2023-2028 (%)
- Exhibits61: Data Table on Lithium-ion battery - Year-over-year growth 2023-2028 (%)
- Exhibits62: Market opportunity by Product ($ million)
- Exhibits63: Data Table on Market opportunity by Product ($ million)
- Exhibits64: Analysis of price sensitivity, lifecycle, customer purchase basket, adoption rates, and purchase criteria
- Exhibits65: Chart on Market share By Geographical Landscape 2023-2028 (%)
- Exhibits66: Data Table on Market share By Geographical Landscape 2023-2028 (%)
- Exhibits67: Chart on Geographic comparison
- Exhibits68: Data Table on Geographic comparison
- Exhibits69: Chart on North America - Market size and forecast 2023-2028 ($ million)
- Exhibits70: Data Table on North America - Market size and forecast 2023-2028 ($ million)
- Exhibits71: Chart on North America - Year-over-year growth 2023-2028 (%)
- Exhibits72: Data Table on North America - Year-over-year growth 2023-2028 (%)
- Exhibits73: Chart on Europe - Market size and forecast 2023-2028 ($ million)
- Exhibits74: Data Table on Europe - Market size and forecast 2023-2028 ($ million)
- Exhibits75: Chart on Europe - Year-over-year growth 2023-2028 (%)
- Exhibits76: Data Table on Europe - Year-over-year growth 2023-2028 (%)
- Exhibits77: Chart on APAC - Market size and forecast 2023-2028 ($ million)
- Exhibits78: Data Table on APAC - Market size and forecast 2023-2028 ($ million)
- Exhibits79: Chart on APAC - Year-over-year growth 2023-2028 (%)
- Exhibits80: Data Table on APAC - Year-over-year growth 2023-2028 (%)
- Exhibits81: Chart on South America - Market size and forecast 2023-2028 ($ million)
- Exhibits82: Data Table on South America - Market size and forecast 2023-2028 ($ million)
- Exhibits83: Chart on South America - Year-over-year growth 2023-2028 (%)
- Exhibits84: Data Table on South America - Year-over-year growth 2023-2028 (%)
- Exhibits85: Chart on Middle East and Africa - Market size and forecast 2023-2028 ($ million)
- Exhibits86: Data Table on Middle East and Africa - Market size and forecast 2023-2028 ($ million)
- Exhibits87: Chart on Middle East and Africa - Year-over-year growth 2023-2028 (%)
- Exhibits88: Data Table on Middle East and Africa - Year-over-year growth 2023-2028 (%)
- Exhibits89: Chart on US - Market size and forecast 2023-2028 ($ million)
- Exhibits90: Data Table on US - Market size and forecast 2023-2028 ($ million)
- Exhibits91: Chart on US - Year-over-year growth 2023-2028 (%)
- Exhibits92: Data Table on US - Year-over-year growth 2023-2028 (%)
- Exhibits93: Chart on UK - Market size and forecast 2023-2028 ($ million)
- Exhibits94: Data Table on UK - Market size and forecast 2023-2028 ($ million)
- Exhibits95: Chart on UK - Year-over-year growth 2023-2028 (%)
- Exhibits96: Data Table on UK - Year-over-year growth 2023-2028 (%)
- Exhibits97: Chart on Germany - Market size and forecast 2023-2028 ($ million)
- Exhibits98: Data Table on Germany - Market size and forecast 2023-2028 ($ million)
- Exhibits99: Chart on Germany - Year-over-year growth 2023-2028 (%)
- Exhibits100: Data Table on Germany - Year-over-year growth 2023-2028 (%)
- Exhibits101: Chart on France - Market size and forecast 2023-2028 ($ million)
- Exhibits102: Data Table on France - Market size and forecast 2023-2028 ($ million)
- Exhibits103: Chart on France - Year-over-year growth 2023-2028 (%)
- Exhibits104: Data Table on France - Year-over-year growth 2023-2028 (%)
- Exhibits105: Chart on India - Market size and forecast 2023-2028 ($ million)
- Exhibits106: Data Table on India - Market size and forecast 2023-2028 ($ million)
- Exhibits107: Chart on India - Year-over-year growth 2023-2028 (%)
- Exhibits108: Data Table on India - Year-over-year growth 2023-2028 (%)
- Exhibits109: Market opportunity By Geographical Landscape ($ million)
- Exhibits110: Data Tables on Market opportunity By Geographical Landscape ($ million)
- Exhibits111: Impact of drivers and challenges in 2023 and 2028
- Exhibits112: Overview on criticality of inputs and factors of differentiation
- Exhibits113: Overview on factors of disruption
- Exhibits114: Impact of key risks on business
- Exhibits115: Companies covered
- Exhibits116: Matrix on companies position and classification
- Exhibits117: Amara Raja Group - Overview
- Exhibits118: Amara Raja Group - Product / Service
- Exhibits119: Amara Raja Group - Key offerings
- Exhibits120: C and D Technologies Inc. - Overview
- Exhibits121: C and D Technologies Inc. - Product / Service
- Exhibits122: C and D Technologies Inc. - Key news
- Exhibits123: C and D Technologies Inc. - Key offerings
- Exhibits124: Chaowei Power Holdings Ltd. - Overview
- Exhibits125: Chaowei Power Holdings Ltd. - Product / Service
- Exhibits126: Chaowei Power Holdings Ltd. - Key offerings
- Exhibits127: Delta Electronics Inc. - Overview
- Exhibits128: Delta Electronics Inc. - Business segments
- Exhibits129: Delta Electronics Inc. - Key news
- Exhibits130: Delta Electronics Inc. - Key offerings
- Exhibits131: Delta Electronics Inc. - Segment focus
- Exhibits132: EaglePicher Technologies LLC - Overview
- Exhibits133: EaglePicher Technologies LLC - Product / Service
- Exhibits134: EaglePicher Technologies LLC - Key news
- Exhibits135: EaglePicher Technologies LLC - Key offerings
- Exhibits136: East Penn Manufacturing Co. Inc. - Overview
- Exhibits137: East Penn Manufacturing Co. Inc. - Product / Service
- Exhibits138: East Penn Manufacturing Co. Inc. - Key news
- Exhibits139: East Penn Manufacturing Co. Inc. - Key offerings
- Exhibits140: Eaton Corp. Plc - Overview
- Exhibits141: Eaton Corp. Plc - Business segments
- Exhibits142: Eaton Corp. Plc - Key news
- Exhibits143: Eaton Corp. Plc - Key offerings
- Exhibits144: Eaton Corp. Plc - Segment focus
- Exhibits145: EnerSys - Overview
- Exhibits146: EnerSys - Business segments
- Exhibits147: EnerSys - Key news
- Exhibits148: EnerSys - Key offerings
- Exhibits149: EnerSys - Segment focus
- Exhibits150: ETERNITY TECHNOLOGIES FZ LLC - Overview
- Exhibits151: ETERNITY TECHNOLOGIES FZ LLC - Product / Service
- Exhibits152: ETERNITY TECHNOLOGIES FZ LLC - Key offerings
- Exhibits153: EverExceed Corp. - Overview
- Exhibits154: EverExceed Corp. - Product / Service
- Exhibits155: EverExceed Corp. - Key offerings
- Exhibits156: Exide Industries Ltd. - Overview
- Exhibits157: Exide Industries Ltd. - Product / Service
- Exhibits158: Exide Industries Ltd. - Key news
- Exhibits159: Exide Industries Ltd. - Key offerings
- Exhibits160: FIAMM Energy Technology Spa - Overview
- Exhibits161: FIAMM Energy Technology Spa - Product / Service
- Exhibits162: FIAMM Energy Technology Spa - Key offerings
- Exhibits163: Schneider Electric SE - Overview
- Exhibits164: Schneider Electric SE - Business segments
- Exhibits165: Schneider Electric SE - Key news
- Exhibits166: Schneider Electric SE - Key offerings
- Exhibits167: Schneider Electric SE - Segment focus
- Exhibits168: TotalEnergies SE - Overview
- Exhibits169: TotalEnergies SE - Business segments
- Exhibits170: TotalEnergies SE - Key news
- Exhibits171: TotalEnergies SE - Key offerings
- Exhibits172: TotalEnergies SE - Segment focus
- Exhibits173: Vertiv Holdings Co. - Overview
- Exhibits174: Vertiv Holdings Co. - Business segments
- Exhibits175: Vertiv Holdings Co. - Key news
- Exhibits176: Vertiv Holdings Co. - Key offerings
- Exhibits177: Vertiv Holdings Co. - Segment focus
- Exhibits178: Inclusions checklist
- Exhibits179: Exclusions checklist
- Exhibits180: Currency conversion rates for US$
- Exhibits181: Research methodology
- Exhibits182: Information sources
- Exhibits183: Data validation
- Exhibits184: Validation techniques employed for market sizing
- Exhibits185: Data synthesis
- Exhibits186: 360 degree market analysis
- Exhibits187: List of abbreviations
The UPS battery for data center market is forecasted to grow by USD 2125.5 mn during 2023-2028, accelerating at a CAGR of 6.59% during the forecast period. The report on the ups battery for data center market provides a holistic analysis, market size and forecast, trends, growth drivers, and challenges, as well as vendor analysis covering around 25 vendors.
The report offers an up-to-date analysis regarding the current market scenario, the latest trends and drivers, and the overall market environment. The market is driven by increase in adoption of modular UPS systems, growing awareness about green facilities, and increasing electricity prices.
Technavio's UPS battery for data center market is segmented as below:
| Market Scope | |
|---|---|
| Base Year | 2024 |
| End Year | 2028 |
| Series Year | 2024-2028 |
| Growth Momentum | Accelerate |
| YOY 2024 | 6.18% |
| CAGR | 6.59% |
| Incremental Value | $2125.5mn |
By Application
- Tier 3 data center
- Tier 1 and 2 data center
- Tier 4 data center
By Product
- Lead acid battery
- Lithium-ion battery
By Geographical Landscape
- North America
- Europe
- APAC
- South America
- Middle East and Africa
This study identifies the growth in data center construction as one of the prime reasons driving the UPS battery for data center market growth during the next few years. Also, increased construction of colocation facilities with 2N power redundancy and growing use of lithium-ion UPS systems will lead to sizable demand in the market.
The report on the UPS battery for data center market covers the following areas:
- UPS battery for data center market sizing
- UPS battery for data center market forecast
- UPS battery for data center market industry analysis
The robust vendor analysis is designed to help clients improve their market position, and in line with this, this report provides a detailed analysis of several leading UPS battery for data center market vendors that include Amara Raja Group, C and D Technologies Inc., Chaowei Power Holdings Ltd., Delta Electronics Inc., EaglePicher Technologies LLC, East Penn Manufacturing Co. Inc., Eaton Corp. Plc, EnerSys, ETERNITY TECHNOLOGIES FZ LLC, EverExceed Corp., Exide Industries Ltd., FIAMM Energy Technology Spa, First National Battery, Fullriver Battery, GS Yuasa International Ltd., HBL Power Systems Ltd., Kokam Co. Ltd., Schneider Electric SE, TotalEnergies SE, and Vertiv Holdings Co.. Also, the ups battery for data center market analysis report includes information on upcoming trends and challenges that will influence market growth. This is to help companies strategize and leverage all forthcoming growth opportunities.
The study was conducted using an objective combination of primary and secondary information including inputs from key participants in the industry. The report contains a comprehensive market and vendor landscape in addition to an analysis of the key vendors.
The publisher presents a detailed picture of the market by the way of study, synthesis, and summation of data from multiple sources by an analysis of key parameters such as profit, pricing, competition, and promotions. It presents various market facets by identifying the key industry influencers. The data presented is comprehensive, reliable, and a result of extensive research - both primary and secondary. The market research reports provide a complete competitive landscape and an in-depth vendor selection methodology and analysis using qualitative and quantitative research to forecast the accurate market growth.
Table of Contents
1 Executive Summary
- 1.1 Market overview
- Executive Summary - Chart on Market Overview
- Executive Summary - Data Table on Market Overview
- Executive Summary - Chart on Global Market Characteristics
- Executive Summary - Chart on Market By Geographical Landscape
- Executive Summary - Chart on Market Segmentation by Application
- Executive Summary - Chart on Market Segmentation by Product
- Executive Summary - Chart on Incremental Growth
- Executive Summary - Data Table on Incremental Growth
- Executive Summary - Chart on Company Market Positioning
2 Market Landscape
- 2.1 Market ecosystem
- Parent Market
- Data Table on - Parent Market
- 2.2 Market characteristics
- Market characteristics analysis
- 2.3 Value chain analysis
- Value Chain Analysis
3 Market Sizing
- 3.1 Market definition
- Offerings of companies included in the market definition
- 3.2 Market segment analysis
- Market segments
- 3.3 Market size 2023
- 3.4 Market outlook: Forecast for 2023-2028
- Chart on Global - Market size and forecast 2023-2028 ($ million)
- Data Table on Global - Market size and forecast 2023-2028 ($ million)
- Chart on Global Market: Year-over-year growth 2023-2028 (%)
- Data Table on Global Market: Year-over-year growth 2023-2028 (%)
4 Historic Market Size
- 4.1 Global UPS Battery For Data Center Market 2018 - 2022
- Historic Market Size - Data Table on Global UPS Battery For Data Center Market 2018 - 2022 ($ million)
- 4.2 Application segment analysis 2018 - 2022
- Historic Market Size - Application Segment 2018 - 2022 ($ million)
- 4.3 Product segment analysis 2018 - 2022
- Historic Market Size - Product Segment 2018 - 2022 ($ million)
- 4.4 Geography segment analysis 2018 - 2022
- Historic Market Size - Geography Segment 2018 - 2022 ($ million)
- 4.5 Country segment analysis 2018 - 2022
- Historic Market Size - Country Segment 2018 - 2022 ($ million)
5 Five Forces Analysis
- 5.1 Five forces summary
- Five forces analysis - Comparison between 2023 and 2028
- 5.2 Bargaining power of buyers
- Bargaining power of buyers - Impact of key factors 2023 and 2028
- 5.3 Bargaining power of suppliers
- Bargaining power of suppliers - Impact of key factors in 2023 and 2028
- 5.4 Threat of new entrants
- Threat of new entrants - Impact of key factors in 2023 and 2028
- 5.5 Threat of substitutes
- Threat of substitutes - Impact of key factors in 2023 and 2028
- 5.6 Threat of rivalry
- Threat of rivalry - Impact of key factors in 2023 and 2028
- 5.7 Market condition
- Chart on Market condition - Five forces 2023 and 2028
6 Market Segmentation by Application
- 6.1 Market segments
- Chart on Application - Market share 2023-2028 (%)
- Data Table on Application - Market share 2023-2028 (%)
- 6.2 Comparison by Application
- Chart on Comparison by Application
- Data Table on Comparison by Application
- 6.3 Tier 3 data center - Market size and forecast 2023-2028
- Chart on Tier 3 data center - Market size and forecast 2023-2028 ($ million)
- Data Table on Tier 3 data center - Market size and forecast 2023-2028 ($ million)
- Chart on Tier 3 data center - Year-over-year growth 2023-2028 (%)
- Data Table on Tier 3 data center - Year-over-year growth 2023-2028 (%)
- 6.4 Tier 1 and 2 data center - Market size and forecast 2023-2028
- Chart on Tier 1 and 2 data center - Market size and forecast 2023-2028 ($ million)
- Data Table on Tier 1 and 2 data center - Market size and forecast 2023-2028 ($ million)
- Chart on Tier 1 and 2 data center - Year-over-year growth 2023-2028 (%)
- Data Table on Tier 1 and 2 data center - Year-over-year growth 2023-2028 (%)
- 6.5 Tier 4 data center - Market size and forecast 2023-2028
- Chart on Tier 4 data center - Market size and forecast 2023-2028 ($ million)
- Data Table on Tier 4 data center - Market size and forecast 2023-2028 ($ million)
- Chart on Tier 4 data center - Year-over-year growth 2023-2028 (%)
- Data Table on Tier 4 data center - Year-over-year growth 2023-2028 (%)
- 6.6 Market opportunity by Application
- Market opportunity by Application ($ million)
- Data Table on Market opportunity by Application ($ million)
7 Market Segmentation by Product
- 7.1 Market segments
- Chart on Product - Market share 2023-2028 (%)
- Data Table on Product - Market share 2023-2028 (%)
- 7.2 Comparison by Product
- Chart on Comparison by Product
- Data Table on Comparison by Product
- 7.3 Lead acid battery - Market size and forecast 2023-2028
- Chart on Lead acid battery - Market size and forecast 2023-2028 ($ million)
- Data Table on Lead acid battery - Market size and forecast 2023-2028 ($ million)
- Chart on Lead acid battery - Year-over-year growth 2023-2028 (%)
- Data Table on Lead acid battery - Year-over-year growth 2023-2028 (%)
- 7.4 Lithium-ion battery - Market size and forecast 2023-2028
- Chart on Lithium-ion battery - Market size and forecast 2023-2028 ($ million)
- Data Table on Lithium-ion battery - Market size and forecast 2023-2028 ($ million)
- Chart on Lithium-ion battery - Year-over-year growth 2023-2028 (%)
- Data Table on Lithium-ion battery - Year-over-year growth 2023-2028 (%)
- 7.5 Market opportunity by Product
- Market opportunity by Product ($ million)
- Data Table on Market opportunity by Product ($ million)
8 Customer Landscape
- 8.1 Customer landscape overview
- Analysis of price sensitivity, lifecycle, customer purchase basket, adoption rates, and purchase criteria
9 Geographic Landscape
- 9.1 Geographic segmentation
- Chart on Market share By Geographical Landscape 2023-2028 (%)
- Data Table on Market share By Geographical Landscape 2023-2028 (%)
- 9.2 Geographic comparison
- Chart on Geographic comparison
- Data Table on Geographic comparison
- 9.3 North America - Market size and forecast 2023-2028
- Chart on North America - Market size and forecast 2023-2028 ($ million)
- Data Table on North America - Market size and forecast 2023-2028 ($ million)
- Chart on North America - Year-over-year growth 2023-2028 (%)
- Data Table on North America - Year-over-year growth 2023-2028 (%)
- 9.4 Europe - Market size and forecast 2023-2028
- Chart on Europe - Market size and forecast 2023-2028 ($ million)
- Data Table on Europe - Market size and forecast 2023-2028 ($ million)
- Chart on Europe - Year-over-year growth 2023-2028 (%)
- Data Table on Europe - Year-over-year growth 2023-2028 (%)
- 9.5 APAC - Market size and forecast 2023-2028
- Chart on APAC - Market size and forecast 2023-2028 ($ million)
- Data Table on APAC - Market size and forecast 2023-2028 ($ million)
- Chart on APAC - Year-over-year growth 2023-2028 (%)
- Data Table on APAC - Year-over-year growth 2023-2028 (%)
- 9.6 South America - Market size and forecast 2023-2028
- Chart on South America - Market size and forecast 2023-2028 ($ million)
- Data Table on South America - Market size and forecast 2023-2028 ($ million)
- Chart on South America - Year-over-year growth 2023-2028 (%)
- Data Table on South America - Year-over-year growth 2023-2028 (%)
- 9.7 Middle East and Africa - Market size and forecast 2023-2028
- Chart on Middle East and Africa - Market size and forecast 2023-2028 ($ million)
- Data Table on Middle East and Africa - Market size and forecast 2023-2028 ($ million)
- Chart on Middle East and Africa - Year-over-year growth 2023-2028 (%)
- Data Table on Middle East and Africa - Year-over-year growth 2023-2028 (%)
- 9.8 US - Market size and forecast 2023-2028
- Chart on US - Market size and forecast 2023-2028 ($ million)
- Data Table on US - Market size and forecast 2023-2028 ($ million)
- Chart on US - Year-over-year growth 2023-2028 (%)
- Data Table on US - Year-over-year growth 2023-2028 (%)
- 9.9 UK - Market size and forecast 2023-2028
- Chart on UK - Market size and forecast 2023-2028 ($ million)
- Data Table on UK - Market size and forecast 2023-2028 ($ million)
- Chart on UK - Year-over-year growth 2023-2028 (%)
- Data Table on UK - Year-over-year growth 2023-2028 (%)
- 9.10 Germany - Market size and forecast 2023-2028
- Chart on Germany - Market size and forecast 2023-2028 ($ million)
- Data Table on Germany - Market size and forecast 2023-2028 ($ million)
- Chart on Germany - Year-over-year growth 2023-2028 (%)
- Data Table on Germany - Year-over-year growth 2023-2028 (%)
- 9.11 France - Market size and forecast 2023-2028
- Chart on France - Market size and forecast 2023-2028 ($ million)
- Data Table on France - Market size and forecast 2023-2028 ($ million)
- Chart on France - Year-over-year growth 2023-2028 (%)
- Data Table on France - Year-over-year growth 2023-2028 (%)
- 9.12 India - Market size and forecast 2023-2028
- Chart on India - Market size and forecast 2023-2028 ($ million)
- Data Table on India - Market size and forecast 2023-2028 ($ million)
- Chart on India - Year-over-year growth 2023-2028 (%)
- Data Table on India - Year-over-year growth 2023-2028 (%)
- 9.13 Market opportunity By Geographical Landscape
- Market opportunity By Geographical Landscape ($ million)
- Data Tables on Market opportunity By Geographical Landscape ($ million)
10 Drivers, Challenges, and Opportunity/Restraints
- 10.1 Market drivers
- 10.2 Market challenges
- 10.3 Impact of drivers and challenges
- Impact of drivers and challenges in 2023 and 2028
- 10.4 Market opportunities/restraints
11 Competitive Landscape
- 11.1 Overview
- 11.2 Competitive Landscape
- Overview on criticality of inputs and factors of differentiation
- 11.3 Landscape disruption
- Overview on factors of disruption
- 11.4 Industry risks
- Impact of key risks on business
12 Competitive Analysis
- 12.1 Companies profiled
- Companies covered
- 12.2 Market positioning of companies
- Matrix on companies position and classification
- 12.3 Amara Raja Group
- Amara Raja Group - Overview
- Amara Raja Group - Product / Service
- Amara Raja Group - Key offerings
- 12.4 C and D Technologies Inc.
- C and D Technologies Inc. - Overview
- C and D Technologies Inc. - Product / Service
- C and D Technologies Inc. - Key news
- C and D Technologies Inc. - Key offerings
- 12.5 Chaowei Power Holdings Ltd.
- Chaowei Power Holdings Ltd. - Overview
- Chaowei Power Holdings Ltd. - Product / Service
- Chaowei Power Holdings Ltd. - Key offerings
- 12.6 Delta Electronics Inc.
- Delta Electronics Inc. - Overview
- Delta Electronics Inc. - Business segments
- Delta Electronics Inc. - Key news
- Delta Electronics Inc. - Key offerings
- Delta Electronics Inc. - Segment focus
- 12.7 EaglePicher Technologies LLC
- EaglePicher Technologies LLC - Overview
- EaglePicher Technologies LLC - Product / Service
- EaglePicher Technologies LLC - Key news
- EaglePicher Technologies LLC - Key offerings
- 12.8 East Penn Manufacturing Co. Inc.
- East Penn Manufacturing Co. Inc. - Overview
- East Penn Manufacturing Co. Inc. - Product / Service
- East Penn Manufacturing Co. Inc. - Key news
- East Penn Manufacturing Co. Inc. - Key offerings
- 12.9 Eaton Corp. Plc
- Eaton Corp. Plc - Overview
- Eaton Corp. Plc - Business segments
- Eaton Corp. Plc - Key news
- Eaton Corp. Plc - Key offerings
- Eaton Corp. Plc - Segment focus
- 12.10 EnerSys
- EnerSys - Overview
- EnerSys - Business segments
- EnerSys - Key news
- EnerSys - Key offerings
- EnerSys - Segment focus
- 12.11 ETERNITY TECHNOLOGIES FZ LLC
- ETERNITY TECHNOLOGIES FZ LLC - Overview
- ETERNITY TECHNOLOGIES FZ LLC - Product / Service
- ETERNITY TECHNOLOGIES FZ LLC - Key offerings
- 12.12 EverExceed Corp.
- EverExceed Corp. - Overview
- EverExceed Corp. - Product / Service
- EverExceed Corp. - Key offerings
- 12.13 Exide Industries Ltd.
- Exide Industries Ltd. - Overview
- Exide Industries Ltd. - Product / Service
- Exide Industries Ltd. - Key news
- Exide Industries Ltd. - Key offerings
- 12.14 FIAMM Energy Technology Spa
- FIAMM Energy Technology Spa - Overview
- FIAMM Energy Technology Spa - Product / Service
- FIAMM Energy Technology Spa - Key offerings
- 12.15 Schneider Electric SE
- Schneider Electric SE - Overview
- Schneider Electric SE - Business segments
- Schneider Electric SE - Key news
- Schneider Electric SE - Key offerings
- Schneider Electric SE - Segment focus
- 12.16 TotalEnergies SE
- TotalEnergies SE - Overview
- TotalEnergies SE - Business segments
- TotalEnergies SE - Key news
- TotalEnergies SE - Key offerings
- TotalEnergies SE - Segment focus
- 12.17 Vertiv Holdings Co.
- Vertiv Holdings Co. - Overview
- Vertiv Holdings Co. - Business segments
- Vertiv Holdings Co. - Key news
- Vertiv Holdings Co. - Key offerings
- Vertiv Holdings Co. - Segment focus
13 Appendix
- 13.1 Scope of the report
- 13.2 Inclusions and exclusions checklist
- Inclusions checklist
- Exclusions checklist
- 13.3 Currency conversion rates for US$
- Currency conversion rates for US$
- 13.4 Research methodology
- Research methodology
- 13.5 Data procurement
- Information sources
- 13.6 Data validation
- Data validation
- 13.7 Validation techniques employed for market sizing
- Validation techniques employed for market sizing
- 13.8 Data synthesis
- Data synthesis
- 13.9 360 degree market analysis
- 360 degree market analysis
- 13.10 List of abbreviations
- List of abbreviations

