|
|
市場調査レポート
商品コード
1911034
予測分析の世界市場、2026年~2030年Global Predictive Analytics Market 2026-2030 |
||||||
|
|||||||
カスタマイズ可能
|
|||||||

| 予測分析の世界市場、2026年~2030年 |
|
出版日: 2026年01月14日
発行: TechNavio
ページ情報: 英文 305 Pages
納期: 即納可能
|

概要
世界の予測分析市場は、2025年から2030年の間に751億880万米ドル規模で成長し、予測期間中のCAGRは33.6%と予測されています。
本報告書では、世界の予測分析市場に関する包括的な分析、市場規模と予測、動向、成長要因、課題に加え、約25社のベンダー分析を提供しています。
本レポートは、現在の市場状況、最新の市場動向と促進要因、市場環境全般に関する最新の分析を提供します。市場の成長は、データ生成量の増加とビッグデータの台頭、不正や詐欺の検知ニーズの高まり、顧客中心主義の実現に向けた分析技術の採用によって牽引されています。
本調査は、業界の主要関係者からの情報をはじめとする一次情報と二次情報を客観的に組み合わせて実施されました。本レポートには、主要企業の分析に加え、包括的な市場規模データ、地域別分析を伴うセグメント、ベンダー情勢が含まれています。レポートには過去データと予測データが掲載されています。
| 市場範囲 | |
|---|---|
| 基準年 | 2026年 |
| 終了年 | 2030年 |
| 予測期間 | 2026年~2030年 |
| 成長モメンタム | 加速 |
| 前年比2026年 | 27.3% |
| CAGR | 33.6% |
| 増分額 | 751億880万米ドル |
本調査では、今後数年間における世界の予測分析市場成長を牽引する主要な要因の一つとして、先進技術、AI、IoTの普及が挙げられます。また、リアルタイムデータ分析の導入拡大とネイティブマシンデータの生成が、市場における相当な需要につながると予測されます。
目次
第1章 エグゼクティブサマリー
- 市場概要
第2章 Technavio分析
- 価格反応性・ライフサイクル・顧客購入バスケット・採用率・購入基準の分析
- インプットの重要性と差別化の要因
- 混乱の要因
- 促進要因と課題の影響
第3章 市場情勢
- 市場エコシステム
- 市場の特徴
- バリューチェーン分析
第4章 市場規模
- 市場の定義
- 市場セグメント分析
- 市場規模、2025年
- 市場の見通し、2025年~2030年
第5章 市場規模実績
- 世界の予測分析市場、2020年~2024年
- エンドユーザーセグメント分析、2020年~2024年
- 展開セグメント分析、2020年~2024年
- 技術セグメント分析、2020年~2024年
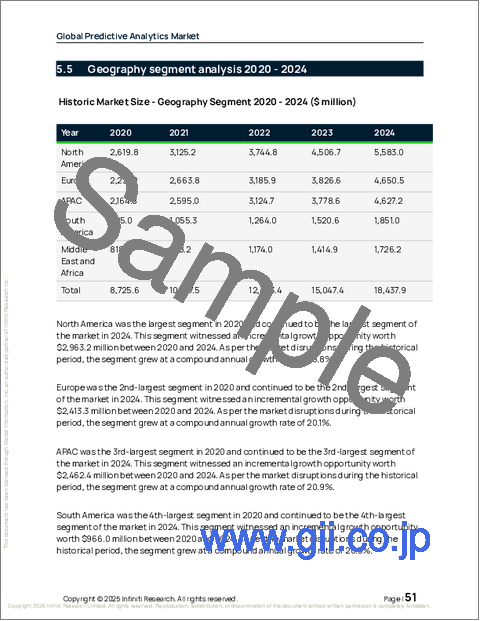
- 地域別セグメント分析、2020年~2024年
- 国別セグメント分析、2020年~2024年
第6章 定性分析
- 世界の予測分析市場に与えるAIの影響
第7章 ファイブフォース分析
- ファイブフォースの要約
- 買い手の交渉力
- 供給企業の交渉力
- 新規参入業者の脅威
- 代替品の脅威
- 競争の脅威
- 市況
第8章 市場セグメンテーション:エンドユーザー別
- 市場セグメント
- 比較:エンドユーザー別
- BFSI:市場規模と予測、2025年~2030年
- 小売・電子商取引:市場規模と予測、2025年~2030年
- 通信・IT:市場規模と予測、2025年~2030年
- 運輸・物流:市場規模と予測、2025年~2030年
- その他:市場規模と予測、2025年~2030年
- 市場機会:エンドユーザー別
第9章 市場セグメンテーション:展開別
- 市場セグメント
- 比較:展開別
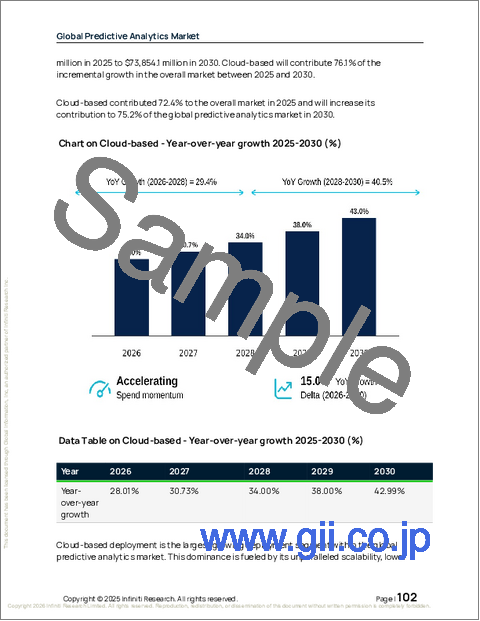
- クラウドベース:市場規模と予測、2025年~2030年
- オンプレミス:市場規模と予測、2025年~2030年
- 市場機会:展開別
第10章 市場セグメンテーション:技術別
- 市場セグメント
- 比較:技術別
- 機械学習:市場規模と予測、2025年~2030年
- 人工知能:市場規模と予測、2025年~2030年
- ビッグデータ分析:市場規模と予測、2025年~2030年
- 市場機会:技術別
第11章 顧客情勢
- 顧客情勢の概要
第12章 地域別情勢
- 地域別セグメンテーション
- 地域別比較
- 北米:市場規模と予測、2025年~2030年
- 欧州:市場規模と予測、2025年~2030年
- アジア太平洋地域:市場規模と予測、2025年~2030年
- 南米:市場規模と予測、2025年~2030年
- 中東・アフリカ:市場規模と予測、2025年~2030年
- 市場機会:地域別
第13章 促進要因、課題、機会
- 市場促進要因
- 市場の課題
- 促進要因と課題の影響
- 市場機会
第14章 競合情勢
- 概要
- 競合情勢
- 混乱の状況
- 業界のリスク
第15章 競合分析
- 企業プロファイル
- 企業ランキング指標
- 企業の市場ポジショニング
- Altair Engineering Inc.
- Alteryx Inc.
- DataRobot Inc.
- Domino Data Lab Inc.
- Domo Inc.
- Fair Isaac Corp.
- H2O.ai Inc.
- InData Labs
- KNIME AG
- Microsoft Corp.
- Oracle Corp.
- Palantir Technologies Inc.
- QlikTech International AB
- Salesforce Inc.
- SAP SE

