|
|
市場調査レポート
商品コード
1634368
空港IT支出の世界市場(2025年~2029年)Global Airport IT Spending Market 2025-2029 |
||||||

|
|||||||
カスタマイズ可能
|
|||||||

| 空港IT支出の世界市場(2025年~2029年) |
|
出版日: 2025年01月08日
発行: TechNavio
ページ情報: 英文 206 Pages
納期: 即納可能
|

全表示
- 概要
- 図表
- 目次
空港IT支出市場(2025年~2029年)
空港IT支出市場は2024年~2029年に20億1,490万米ドル、予測期間中のCAGRは5.7%で成長すると予測されます。当レポートでは、空港IT支出市場の全体的な分析、市場規模・予測、動向、成長促進要因、課題、約25のベンダーを網羅したベンダー分析などを掲載しています。
現在の市場シナリオ、最新動向と促進要因、市場環境全体に関する最新分析を提供しています。市場を牽引しているのは、顧客体験の向上に向けた空港の取り組み、ITとの統合によるロイヤルティプログラムの重要性の高まり、空港におけるITセキュリティに対する需要の高まりなどです。
| 市場範囲 | |
|---|---|
| 基準年 | 2025年 |
| 終了年 | 2029年 |
| 予測期間 | 2025年~2029年 |
| 成長モメンタム | 加速 |
| 前年比2025年 | 5.1% |
| CAGR | 5.7% |
| 増分額 | 20億1,490万米ドル |
本調査では、今後数年間の空港IT支出市場の成長を促進する主な要因の1つとして、空港におけるハイエンドのサイバーセキュリティの確立に注力していることを挙げています。また、クラウドベースのCRMに対する需要の高まりや、リアルタイムの待ち時間監視システムに対するニーズも、市場の大きな需要につながると思われます。
目次
第1章 エグゼクティブサマリー
- 市場概要
第2章 Technavioによる分析
- 価格・ライフサイクル・顧客購入バスケット・採用率・購入基準の分析
- インプットの重要性と差別化の要因
- 混乱の要因
- 促進要因と課題の影響
第3章 市場情勢
- 市場エコシステム
- 市場の特徴
- バリューチェーン分析
第4章 市場規模
- 市場の定義
- 市場セグメント分析
- 市場規模(2024年)
- 市場の見通し(2024年~2029年)
第5章 市場規模実績
- 世界の空港IT支出市場(2019年~2023年)
- エンドユーザーセグメント分析(2019年~2023年)
- コンポーネントセグメント分析(2019年~2023年)
- 地域別セグメント分析(2019年~2023年)
- 国別セグメント分析(2019年~2023年)
第6章 定性分析
- AIの影響:世界の空港IT支出市場
第7章 ファイブフォース分析
- ファイブフォースの要約
- 買い手の交渉力
- 供給企業の交渉力
- 新規参入業者の脅威
- 代替品の脅威
- 競争の脅威
- 市況
第8章 市場セグメンテーション:エンドユーザー別
- 市場セグメント
- 比較:エンドユーザー別
- 運用システム:市場規模と予測(2024年~2029年)
- 行政システム:市場規模と予測(2024年~2029年)
- 旅客処理システム:市場規模と予測(2024年~2029年)
- 市場機会:エンドユーザー別
第9章 市場セグメンテーション:コンポーネント別
- 市場セグメント
- 比較:コンポーネント別
- ハードウェア:市場規模と予測(2024年~2029年)
- ソフトウェア:市場規模と予測(2024年~2029年)
- サービス:市場規模と予測(2024年~2029年)
- 市場機会:コンポーネント別
第10章 顧客情勢
- 顧客情勢の概要
第11章 地域別情勢
- 地域別セグメンテーション
- 地域別比較
- アジア太平洋:市場規模と予測(2024年~2029年)
- 北米:市場規模と予測(2024年~2029年)
- 欧州:市場規模と予測(2024年~2029年)
- 中東・アフリカ:市場規模と予測(2024年~2029年)
- 南米:市場規模と予測(2024年~2029年)
- 米国:市場規模と予測(2024年~2029年)
- 中国:市場規模と予測(2024年~2029年)
- 日本:市場規模と予測(2024年~2029年)
- 英国:市場規模と予測(2024年~2029年)
- インド:市場規模と予測(2024年~2029年)
- アラブ首長国連邦:市場規模と予測(2024年~2029年)
- カナダ:市場規模と予測(2024年~2029年)
- ブラジル:市場規模と予測(2024年~2029年)
- 韓国:市場規模と予測(2024年~2029年)
- ドイツ:市場規模と予測(2024年~2029年)
- 市場機会:地域情勢別
第12章 促進要因・課題・機会・抑制要因
- 市場促進要因
- 市場の課題
- 促進要因と課題の影響
- 市場の機会・抑制要因
第13章 競合情勢
- 概要
- 競合情勢
- 混乱の状況
- 業界のリスク
第14章 競合分析
- 企業プロファイル
- 企業ランキング指数
- 企業の市場ポジショニング
- Amadeus IT Group SA
- Atos SE
- Capgemini Services SAS
- Damarel Systems International Ltd.
- INFORM GmbH
- International Business Machines Corp.
- Intersystems
- Lockheed Martin Corp.
- NEC Corp.
- Northrop Grumman Corp.
- RTX Corp.
- RESA SAS
- Siemens AG
- SITA
- VELATIA S.L
第15章 付録
Exhibits:
- Exhibits1: Executive Summary - Chart on Market Overview
- Exhibits2: Executive Summary - Data Table on Market Overview
- Exhibits3: Executive Summary - Chart on Global Market Characteristics
- Exhibits4: Executive Summary - Chart on Market By Geographical Landscape
- Exhibits5: Executive Summary - Chart on Market Segmentation by End-user
- Exhibits6: Executive Summary - Chart on Market Segmentation by Component
- Exhibits7: Executive Summary - Chart on Incremental Growth
- Exhibits8: Executive Summary - Data Table on Incremental Growth
- Exhibits9: Executive Summary - Chart on Company Market Positioning
- Exhibits10: Analysis of price sensitivity, lifecycle, customer purchase basket, adoption rates, and purchase criteria
- Exhibits11: Overview on criticality of inputs and factors of differentiation
- Exhibits12: Overview on factors of disruption
- Exhibits13: Impact of drivers and challenges in 2024 and 2029
- Exhibits14: Parent Market
- Exhibits15: Data Table on - Parent Market
- Exhibits16: Market characteristics analysis
- Exhibits17: Value chain analysis
- Exhibits18: Offerings of companies included in the market definition
- Exhibits19: Market segments
- Exhibits20: Chart on Global - Market size and forecast 2024-2029 ($ million)
- Exhibits21: Data Table on Global - Market size and forecast 2024-2029 ($ million)
- Exhibits22: Chart on Global Market: Year-over-year growth 2024-2029 (%)
- Exhibits23: Data Table on Global Market: Year-over-year growth 2024-2029 (%)
- Exhibits24: Historic Market Size - Data Table on Global Airport IT Spending Market 2019 - 2023 ($ million)
- Exhibits25: Historic Market Size - End-user Segment 2019 - 2023 ($ million)
- Exhibits26: Historic Market Size - Component Segment 2019 - 2023 ($ million)
- Exhibits27: Historic Market Size - Geography Segment 2019 - 2023 ($ million)
- Exhibits28: Historic Market Size - Country Segment 2019 - 2023 ($ million)
- Exhibits29: Five forces analysis - Comparison between 2024 and 2029
- Exhibits30: Bargaining power of buyers - Impact of key factors 2024 and 2029
- Exhibits31: Bargaining power of suppliers - Impact of key factors in 2024 and 2029
- Exhibits32: Threat of new entrants - Impact of key factors in 2024 and 2029
- Exhibits33: Threat of substitutes - Impact of key factors in 2024 and 2029
- Exhibits34: Threat of rivalry - Impact of key factors in 2024 and 2029
- Exhibits35: Chart on Market condition - Five forces 2024 and 2029
- Exhibits36: Chart on End-user - Market share 2024-2029 (%)
- Exhibits37: Data Table on End-user - Market share 2024-2029 (%)
- Exhibits38: Chart on Comparison by End-user
- Exhibits39: Data Table on Comparison by End-user
- Exhibits40: Chart on Operational system - Market size and forecast 2024-2029 ($ million)
- Exhibits41: Data Table on Operational system - Market size and forecast 2024-2029 ($ million)
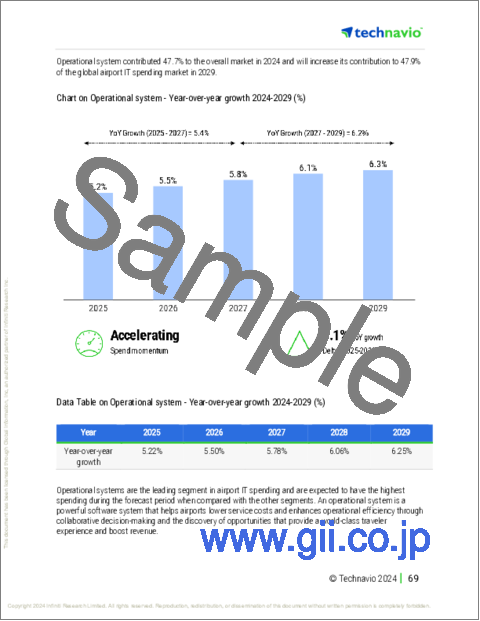
- Exhibits42: Chart on Operational system - Year-over-year growth 2024-2029 (%)
- Exhibits43: Data Table on Operational system - Year-over-year growth 2024-2029 (%)
- Exhibits44: Chart on Administrative system - Market size and forecast 2024-2029 ($ million)
- Exhibits45: Data Table on Administrative system - Market size and forecast 2024-2029 ($ million)
- Exhibits46: Chart on Administrative system - Year-over-year growth 2024-2029 (%)
- Exhibits47: Data Table on Administrative system - Year-over-year growth 2024-2029 (%)
- Exhibits48: Chart on Passenger processing system - Market size and forecast 2024-2029 ($ million)
- Exhibits49: Data Table on Passenger processing system - Market size and forecast 2024-2029 ($ million)
- Exhibits50: Chart on Passenger processing system - Year-over-year growth 2024-2029 (%)
- Exhibits51: Data Table on Passenger processing system - Year-over-year growth 2024-2029 (%)
- Exhibits52: Market opportunity by End-user ($ million)
- Exhibits53: Data Table on Market opportunity by End-user ($ million)
- Exhibits54: Chart on Component - Market share 2024-2029 (%)
- Exhibits55: Data Table on Component - Market share 2024-2029 (%)
- Exhibits56: Chart on Comparison by Component
- Exhibits57: Data Table on Comparison by Component
- Exhibits58: Chart on Hardware - Market size and forecast 2024-2029 ($ million)
- Exhibits59: Data Table on Hardware - Market size and forecast 2024-2029 ($ million)
- Exhibits60: Chart on Hardware - Year-over-year growth 2024-2029 (%)
- Exhibits61: Data Table on Hardware - Year-over-year growth 2024-2029 (%)
- Exhibits62: Chart on Software - Market size and forecast 2024-2029 ($ million)
- Exhibits63: Data Table on Software - Market size and forecast 2024-2029 ($ million)
- Exhibits64: Chart on Software - Year-over-year growth 2024-2029 (%)
- Exhibits65: Data Table on Software - Year-over-year growth 2024-2029 (%)
- Exhibits66: Chart on Services - Market size and forecast 2024-2029 ($ million)
- Exhibits67: Data Table on Services - Market size and forecast 2024-2029 ($ million)
- Exhibits68: Chart on Services - Year-over-year growth 2024-2029 (%)
- Exhibits69: Data Table on Services - Year-over-year growth 2024-2029 (%)
- Exhibits70: Market opportunity by Component ($ million)
- Exhibits71: Data Table on Market opportunity by Component ($ million)
- Exhibits72: Analysis of price sensitivity, lifecycle, customer purchase basket, adoption rates, and purchase criteria
- Exhibits73: Chart on Market share By Geographical Landscape 2024-2029 (%)
- Exhibits74: Data Table on Market share By Geographical Landscape 2024-2029 (%)
- Exhibits75: Chart on Geographic comparison
- Exhibits76: Data Table on Geographic comparison
- Exhibits77: Chart on APAC - Market size and forecast 2024-2029 ($ million)
- Exhibits78: Data Table on APAC - Market size and forecast 2024-2029 ($ million)
- Exhibits79: Chart on APAC - Year-over-year growth 2024-2029 (%)
- Exhibits80: Data Table on APAC - Year-over-year growth 2024-2029 (%)
- Exhibits81: Chart on North America - Market size and forecast 2024-2029 ($ million)
- Exhibits82: Data Table on North America - Market size and forecast 2024-2029 ($ million)
- Exhibits83: Chart on North America - Year-over-year growth 2024-2029 (%)
- Exhibits84: Data Table on North America - Year-over-year growth 2024-2029 (%)
- Exhibits85: Chart on Europe - Market size and forecast 2024-2029 ($ million)
- Exhibits86: Data Table on Europe - Market size and forecast 2024-2029 ($ million)
- Exhibits87: Chart on Europe - Year-over-year growth 2024-2029 (%)
- Exhibits88: Data Table on Europe - Year-over-year growth 2024-2029 (%)
- Exhibits89: Chart on Middle East and Africa - Market size and forecast 2024-2029 ($ million)
- Exhibits90: Data Table on Middle East and Africa - Market size and forecast 2024-2029 ($ million)
- Exhibits91: Chart on Middle East and Africa - Year-over-year growth 2024-2029 (%)
- Exhibits92: Data Table on Middle East and Africa - Year-over-year growth 2024-2029 (%)
- Exhibits93: Chart on South America - Market size and forecast 2024-2029 ($ million)
- Exhibits94: Data Table on South America - Market size and forecast 2024-2029 ($ million)
- Exhibits95: Chart on South America - Year-over-year growth 2024-2029 (%)
- Exhibits96: Data Table on South America - Year-over-year growth 2024-2029 (%)
- Exhibits97: Chart on US - Market size and forecast 2024-2029 ($ million)
- Exhibits98: Data Table on US - Market size and forecast 2024-2029 ($ million)
- Exhibits99: Chart on US - Year-over-year growth 2024-2029 (%)
- Exhibits100: Data Table on US - Year-over-year growth 2024-2029 (%)
- Exhibits101: Chart on China - Market size and forecast 2024-2029 ($ million)
- Exhibits102: Data Table on China - Market size and forecast 2024-2029 ($ million)
- Exhibits103: Chart on China - Year-over-year growth 2024-2029 (%)
- Exhibits104: Data Table on China - Year-over-year growth 2024-2029 (%)
- Exhibits105: Chart on Japan - Market size and forecast 2024-2029 ($ million)
- Exhibits106: Data Table on Japan - Market size and forecast 2024-2029 ($ million)
- Exhibits107: Chart on Japan - Year-over-year growth 2024-2029 (%)
- Exhibits108: Data Table on Japan - Year-over-year growth 2024-2029 (%)
- Exhibits109: Chart on UK - Market size and forecast 2024-2029 ($ million)
- Exhibits110: Data Table on UK - Market size and forecast 2024-2029 ($ million)
- Exhibits111: Chart on UK - Year-over-year growth 2024-2029 (%)
- Exhibits112: Data Table on UK - Year-over-year growth 2024-2029 (%)
- Exhibits113: Chart on India - Market size and forecast 2024-2029 ($ million)
- Exhibits114: Data Table on India - Market size and forecast 2024-2029 ($ million)
- Exhibits115: Chart on India - Year-over-year growth 2024-2029 (%)
- Exhibits116: Data Table on India - Year-over-year growth 2024-2029 (%)
- Exhibits117: Chart on UAE - Market size and forecast 2024-2029 ($ million)
- Exhibits118: Data Table on UAE - Market size and forecast 2024-2029 ($ million)
- Exhibits119: Chart on UAE - Year-over-year growth 2024-2029 (%)
- Exhibits120: Data Table on UAE - Year-over-year growth 2024-2029 (%)
- Exhibits121: Chart on Canada - Market size and forecast 2024-2029 ($ million)
- Exhibits122: Data Table on Canada - Market size and forecast 2024-2029 ($ million)
- Exhibits123: Chart on Canada - Year-over-year growth 2024-2029 (%)
- Exhibits124: Data Table on Canada - Year-over-year growth 2024-2029 (%)
- Exhibits125: Chart on Brazil - Market size and forecast 2024-2029 ($ million)
- Exhibits126: Data Table on Brazil - Market size and forecast 2024-2029 ($ million)
- Exhibits127: Chart on Brazil - Year-over-year growth 2024-2029 (%)
- Exhibits128: Data Table on Brazil - Year-over-year growth 2024-2029 (%)
- Exhibits129: Chart on South Korea - Market size and forecast 2024-2029 ($ million)
- Exhibits130: Data Table on South Korea - Market size and forecast 2024-2029 ($ million)
- Exhibits131: Chart on South Korea - Year-over-year growth 2024-2029 (%)
- Exhibits132: Data Table on South Korea - Year-over-year growth 2024-2029 (%)
- Exhibits133: Chart on Germany - Market size and forecast 2024-2029 ($ million)
- Exhibits134: Data Table on Germany - Market size and forecast 2024-2029 ($ million)
- Exhibits135: Chart on Germany - Year-over-year growth 2024-2029 (%)
- Exhibits136: Data Table on Germany - Year-over-year growth 2024-2029 (%)
- Exhibits137: Market opportunity By Geographical Landscape ($ million)
- Exhibits138: Data Tables on Market opportunity By Geographical Landscape ($ million)
- Exhibits139: Impact of drivers and challenges in 2024 and 2029
- Exhibits140: Overview on criticality of inputs and factors of differentiation
- Exhibits141: Overview on factors of disruption
- Exhibits142: Impact of key risks on business
- Exhibits143: Companies covered
- Exhibits144: Company ranking index
- Exhibits145: Matrix on companies position and classification
- Exhibits146: Amadeus IT Group SA - Overview
- Exhibits147: Amadeus IT Group SA - Business segments
- Exhibits148: Amadeus IT Group SA - Key offerings
- Exhibits149: Amadeus IT Group SA - Segment focus
- Exhibits150: SWOT
- Exhibits151: Atos SE - Overview
- Exhibits152: Atos SE - Business segments
- Exhibits153: Atos SE - Key news
- Exhibits154: Atos SE - Key offerings
- Exhibits155: Atos SE - Segment focus
- Exhibits156: SWOT
- Exhibits157: Capgemini Services SAS - Overview
- Exhibits158: Capgemini Services SAS - Business segments
- Exhibits159: Capgemini Services SAS - Key news
- Exhibits160: Capgemini Services SAS - Key offerings
- Exhibits161: Capgemini Services SAS - Segment focus
- Exhibits162: SWOT
- Exhibits163: Damarel Systems International Ltd. - Overview
- Exhibits164: Damarel Systems International Ltd. - Product / Service
- Exhibits165: Damarel Systems International Ltd. - Key offerings
- Exhibits166: SWOT
- Exhibits167: INFORM GmbH - Overview
- Exhibits168: INFORM GmbH - Product / Service
- Exhibits169: INFORM GmbH - Key offerings
- Exhibits170: SWOT
- Exhibits171: International Business Machines Corp. - Overview
- Exhibits172: International Business Machines Corp. - Business segments
- Exhibits173: International Business Machines Corp. - Key news
- Exhibits174: International Business Machines Corp. - Key offerings
- Exhibits175: International Business Machines Corp. - Segment focus
- Exhibits176: SWOT
- Exhibits177: Intersystems - Overview
- Exhibits178: Intersystems - Product / Service
- Exhibits179: Intersystems - Key offerings
- Exhibits180: SWOT
- Exhibits181: Lockheed Martin Corp. - Overview
- Exhibits182: Lockheed Martin Corp. - Business segments
- Exhibits183: Lockheed Martin Corp. - Key news
- Exhibits184: Lockheed Martin Corp. - Key offerings
- Exhibits185: Lockheed Martin Corp. - Segment focus
- Exhibits186: SWOT
- Exhibits187: NEC Corp. - Overview
- Exhibits188: NEC Corp. - Business segments
- Exhibits189: NEC Corp. - Key news
- Exhibits190: NEC Corp. - Key offerings
- Exhibits191: NEC Corp. - Segment focus
- Exhibits192: SWOT
- Exhibits193: Northrop Grumman Corp. - Overview
- Exhibits194: Northrop Grumman Corp. - Business segments
- Exhibits195: Northrop Grumman Corp. - Key news
- Exhibits196: Northrop Grumman Corp. - Key offerings
- Exhibits197: Northrop Grumman Corp. - Segment focus
- Exhibits198: SWOT
- Exhibits199: RTX Corp. - Overview
- Exhibits200: RTX Corp. - Business segments
- Exhibits201: RTX Corp. - Key news
- Exhibits202: RTX Corp. - Key offerings
- Exhibits203: RTX Corp. - Segment focus
- Exhibits204: SWOT
- Exhibits205: RESA SAS - Overview
- Exhibits206: RESA SAS - Product / Service
- Exhibits207: RESA SAS - Key offerings
- Exhibits208: SWOT
- Exhibits209: Siemens AG - Overview
- Exhibits210: Siemens AG - Business segments
- Exhibits211: Siemens AG - Key news
- Exhibits212: Siemens AG - Key offerings
- Exhibits213: Siemens AG - Segment focus
- Exhibits214: SWOT
- Exhibits215: SITA - Overview
- Exhibits216: SITA - Product / Service
- Exhibits217: SITA - Key offerings
- Exhibits218: SWOT
- Exhibits219: VELATIA S.L - Overview
- Exhibits220: VELATIA S.L - Product / Service
- Exhibits221: VELATIA S.L - Key offerings
- Exhibits222: SWOT
- Exhibits223: Inclusions checklist
- Exhibits224: Exclusions checklist
- Exhibits225: Currency conversion rates for US$
- Exhibits226: Research methodology
- Exhibits227: Information sources
- Exhibits228: Data validation
- Exhibits229: Validation techniques employed for market sizing
- Exhibits230: Data synthesis
- Exhibits231: 360 degree market analysis
- Exhibits232: List of abbreviations
Airport IT Spending Market 2025-2029
The airport it spending market is forecasted to grow by USD 2014.9 mn during 2024-2029, accelerating at a CAGR of 5.7% during the forecast period. The report on the airport it spending market provides a holistic analysis, market size and forecast, trends, growth drivers, and challenges, as well as vendor analysis covering around 25 vendors.
The report offers an up-to-date analysis regarding the current market scenario, the latest trends and drivers, and the overall market environment. The market is driven by efforts by airports to enhance customer experience, growing importance of loyalty programs due to it integration, and increasing demand for it security at airports.
| Market Scope | |
|---|---|
| Base Year | 2025 |
| End Year | 2029 |
| Series Year | 2025-2029 |
| Growth Momentum | Accelerate |
| YOY 2025 | 5.1% |
| CAGR | 5.7% |
| Incremental Value | $2014.9 mn |
Technavio's airport it spending market is segmented as below:
By End-user
- Operational system
- Administrative system
- Passenger processing system
By Component
- Hardware
- Software
- Services
By Geographical Landscape
- APAC
- North America
- Europe
- Middle East and Africa
- South America
This study identifies the focus on establishing high-end cybersecurity at airports as one of the prime reasons driving the airport it spending market growth during the next few years. Also, rise in demand for cloud-based crm and need for real-time wait time monitoring systems will lead to sizable demand in the market.
The report on the airport it spending market covers the following areas:
- Airport IT Spending Market sizing
- Airport IT Spending Market forecast
- Airport IT Spending Market industry analysis
The robust vendor analysis is designed to help clients improve their market position, and in line with this, this report provides a detailed analysis of several leading airport it spending market vendors that include Amadeus IT Group SA, Atos SE, Capgemini Services SAS, China Civil Aviation Information Network Co. Ltd., Cobham Ltd., Damarel Systems International Ltd., INFORM GmbH, International Business Machines Corp., Intersystems, Lockheed Martin Corp., NEC Corp., Northrop Grumman Corp., Passur Aerospace Inc., RTX Corp., RESA SAS, Saab AB, Siemens AG, SITA, Thales Group, and VELATIA S.L. Also, the airport it spending market analysis report includes information on upcoming trends and challenges that will influence market growth. This is to help companies strategize and leverage all forthcoming growth opportunities.
The study was conducted using an objective combination of primary and secondary information including inputs from key participants in the industry. The report contains a comprehensive market and vendor landscape in addition to an analysis of the key vendors.
The publisher presents a detailed picture of the market by the way of study, synthesis, and summation of data from multiple sources by an analysis of key parameters such as profit, pricing, competition, and promotions. It presents various market facets by identifying the key industry influencers. The data presented is comprehensive, reliable, and a result of extensive primary and secondary research. The market research reports provide a complete competitive landscape and an in-depth vendor selection methodology and analysis using qualitative and quantitative research to forecast accurate market growth.
Table of Contents
1 Executive Summary
- 1.1 Market overview
- Executive Summary - Chart on Market Overview
- Executive Summary - Data Table on Market Overview
- Executive Summary - Chart on Global Market Characteristics
- Executive Summary - Chart on Market By Geographical Landscape
- Executive Summary - Chart on Market Segmentation by End-user
- Executive Summary - Chart on Market Segmentation by Component
- Executive Summary - Chart on Incremental Growth
- Executive Summary - Data Table on Incremental Growth
- Executive Summary - Chart on Company Market Positioning
2 Technavio Analysis
- 2.1 Analysis of price sensitivity, lifecycle, customer purchase basket, adoption rates, and purchase criteria
- Analysis of price sensitivity, lifecycle, customer purchase basket, adoption rates, and purchase criteria
- 2.2 Criticality of inputs and Factors of differentiation
- Overview on criticality of inputs and factors of differentiation
- 2.3 Factors of disruption
- Overview on factors of disruption
- 2.4 Impact of drivers and challenges
- Impact of drivers and challenges in 2024 and 2029
3 Market Landscape
- 3.1 Market ecosystem
- Parent Market
- Data Table on - Parent Market
- 3.2 Market characteristics
- Market characteristics analysis
- 3.3 Value chain analysis
- Value chain analysis
4 Market Sizing
- 4.1 Market definition
- Offerings of companies included in the market definition
- 4.2 Market segment analysis
- Market segments
- 4.3 Market size 2024
- 4.4 Market outlook: Forecast for 2024-2029
- Chart on Global - Market size and forecast 2024-2029 ($ million)
- Data Table on Global - Market size and forecast 2024-2029 ($ million)
- Chart on Global Market: Year-over-year growth 2024-2029 (%)
- Data Table on Global Market: Year-over-year growth 2024-2029 (%)
5 Historic Market Size
- 5.1 Global Airport IT Spending Market 2019 - 2023
- Historic Market Size - Data Table on Global Airport IT Spending Market 2019 - 2023 ($ million)
- 5.2 End-user segment analysis 2019 - 2023
- Historic Market Size - End-user Segment 2019 - 2023 ($ million)
- 5.3 Component segment analysis 2019 - 2023
- Historic Market Size - Component Segment 2019 - 2023 ($ million)
- 5.4 Geography segment analysis 2019 - 2023
- Historic Market Size - Geography Segment 2019 - 2023 ($ million)
- 5.5 Country segment analysis 2019 - 2023
- Historic Market Size - Country Segment 2019 - 2023 ($ million)
6 Qualitative Analysis
- 6.1 Impact of AI on global airport IT spending market
7 Five Forces Analysis
- 7.1 Five forces summary
- Five forces analysis - Comparison between 2024 and 2029
- 7.2 Bargaining power of buyers
- Bargaining power of buyers - Impact of key factors 2024 and 2029
- 7.3 Bargaining power of suppliers
- Bargaining power of suppliers - Impact of key factors in 2024 and 2029
- 7.4 Threat of new entrants
- Threat of new entrants - Impact of key factors in 2024 and 2029
- 7.5 Threat of substitutes
- Threat of substitutes - Impact of key factors in 2024 and 2029
- 7.6 Threat of rivalry
- Threat of rivalry - Impact of key factors in 2024 and 2029
- 7.7 Market condition
- Chart on Market condition - Five forces 2024 and 2029
8 Market Segmentation by End-user
- 8.1 Market segments
- Chart on End-user - Market share 2024-2029 (%)
- Data Table on End-user - Market share 2024-2029 (%)
- 8.2 Comparison by End-user
- Chart on Comparison by End-user
- Data Table on Comparison by End-user
- 8.3 Operational system - Market size and forecast 2024-2029
- Chart on Operational system - Market size and forecast 2024-2029 ($ million)
- Data Table on Operational system - Market size and forecast 2024-2029 ($ million)
- Chart on Operational system - Year-over-year growth 2024-2029 (%)
- Data Table on Operational system - Year-over-year growth 2024-2029 (%)
- 8.4 Administrative system - Market size and forecast 2024-2029
- Chart on Administrative system - Market size and forecast 2024-2029 ($ million)
- Data Table on Administrative system - Market size and forecast 2024-2029 ($ million)
- Chart on Administrative system - Year-over-year growth 2024-2029 (%)
- Data Table on Administrative system - Year-over-year growth 2024-2029 (%)
- 8.5 Passenger processing system - Market size and forecast 2024-2029
- Chart on Passenger processing system - Market size and forecast 2024-2029 ($ million)
- Data Table on Passenger processing system - Market size and forecast 2024-2029 ($ million)
- Chart on Passenger processing system - Year-over-year growth 2024-2029 (%)
- Data Table on Passenger processing system - Year-over-year growth 2024-2029 (%)
- 8.6 Market opportunity by End-user
- Market opportunity by End-user ($ million)
- Data Table on Market opportunity by End-user ($ million)
9 Market Segmentation by Component
- 9.1 Market segments
- Chart on Component - Market share 2024-2029 (%)
- Data Table on Component - Market share 2024-2029 (%)
- 9.2 Comparison by Component
- Chart on Comparison by Component
- Data Table on Comparison by Component
- 9.3 Hardware - Market size and forecast 2024-2029
- Chart on Hardware - Market size and forecast 2024-2029 ($ million)
- Data Table on Hardware - Market size and forecast 2024-2029 ($ million)
- Chart on Hardware - Year-over-year growth 2024-2029 (%)
- Data Table on Hardware - Year-over-year growth 2024-2029 (%)
- 9.4 Software - Market size and forecast 2024-2029
- Chart on Software - Market size and forecast 2024-2029 ($ million)
- Data Table on Software - Market size and forecast 2024-2029 ($ million)
- Chart on Software - Year-over-year growth 2024-2029 (%)
- Data Table on Software - Year-over-year growth 2024-2029 (%)
- 9.5 Services - Market size and forecast 2024-2029
- Chart on Services - Market size and forecast 2024-2029 ($ million)
- Data Table on Services - Market size and forecast 2024-2029 ($ million)
- Chart on Services - Year-over-year growth 2024-2029 (%)
- Data Table on Services - Year-over-year growth 2024-2029 (%)
- 9.6 Market opportunity by Component
- Market opportunity by Component ($ million)
- Data Table on Market opportunity by Component ($ million)
10 Customer Landscape
- 10.1 Customer landscape overview
- Analysis of price sensitivity, lifecycle, customer purchase basket, adoption rates, and purchase criteria
11 Geographic Landscape
- 11.1 Geographic segmentation
- Chart on Market share By Geographical Landscape 2024-2029 (%)
- Data Table on Market share By Geographical Landscape 2024-2029 (%)
- 11.2 Geographic comparison
- Chart on Geographic comparison
- Data Table on Geographic comparison
- 11.3 APAC - Market size and forecast 2024-2029
- Chart on APAC - Market size and forecast 2024-2029 ($ million)
- Data Table on APAC - Market size and forecast 2024-2029 ($ million)
- Chart on APAC - Year-over-year growth 2024-2029 (%)
- Data Table on APAC - Year-over-year growth 2024-2029 (%)
- 11.4 North America - Market size and forecast 2024-2029
- Chart on North America - Market size and forecast 2024-2029 ($ million)
- Data Table on North America - Market size and forecast 2024-2029 ($ million)
- Chart on North America - Year-over-year growth 2024-2029 (%)
- Data Table on North America - Year-over-year growth 2024-2029 (%)
- 11.5 Europe - Market size and forecast 2024-2029
- Chart on Europe - Market size and forecast 2024-2029 ($ million)
- Data Table on Europe - Market size and forecast 2024-2029 ($ million)
- Chart on Europe - Year-over-year growth 2024-2029 (%)
- Data Table on Europe - Year-over-year growth 2024-2029 (%)
- 11.6 Middle East and Africa - Market size and forecast 2024-2029
- Chart on Middle East and Africa - Market size and forecast 2024-2029 ($ million)
- Data Table on Middle East and Africa - Market size and forecast 2024-2029 ($ million)
- Chart on Middle East and Africa - Year-over-year growth 2024-2029 (%)
- Data Table on Middle East and Africa - Year-over-year growth 2024-2029 (%)
- 11.7 South America - Market size and forecast 2024-2029
- Chart on South America - Market size and forecast 2024-2029 ($ million)
- Data Table on South America - Market size and forecast 2024-2029 ($ million)
- Chart on South America - Year-over-year growth 2024-2029 (%)
- Data Table on South America - Year-over-year growth 2024-2029 (%)
- 11.8 US - Market size and forecast 2024-2029
- Chart on US - Market size and forecast 2024-2029 ($ million)
- Data Table on US - Market size and forecast 2024-2029 ($ million)
- Chart on US - Year-over-year growth 2024-2029 (%)
- Data Table on US - Year-over-year growth 2024-2029 (%)
- 11.9 China - Market size and forecast 2024-2029
- Chart on China - Market size and forecast 2024-2029 ($ million)
- Data Table on China - Market size and forecast 2024-2029 ($ million)
- Chart on China - Year-over-year growth 2024-2029 (%)
- Data Table on China - Year-over-year growth 2024-2029 (%)
- 11.10 Japan - Market size and forecast 2024-2029
- Chart on Japan - Market size and forecast 2024-2029 ($ million)
- Data Table on Japan - Market size and forecast 2024-2029 ($ million)
- Chart on Japan - Year-over-year growth 2024-2029 (%)
- Data Table on Japan - Year-over-year growth 2024-2029 (%)
- 11.11 UK - Market size and forecast 2024-2029
- Chart on UK - Market size and forecast 2024-2029 ($ million)
- Data Table on UK - Market size and forecast 2024-2029 ($ million)
- Chart on UK - Year-over-year growth 2024-2029 (%)
- Data Table on UK - Year-over-year growth 2024-2029 (%)
- 11.12 India - Market size and forecast 2024-2029
- Chart on India - Market size and forecast 2024-2029 ($ million)
- Data Table on India - Market size and forecast 2024-2029 ($ million)
- Chart on India - Year-over-year growth 2024-2029 (%)
- Data Table on India - Year-over-year growth 2024-2029 (%)
- 11.13 UAE - Market size and forecast 2024-2029
- Chart on UAE - Market size and forecast 2024-2029 ($ million)
- Data Table on UAE - Market size and forecast 2024-2029 ($ million)
- Chart on UAE - Year-over-year growth 2024-2029 (%)
- Data Table on UAE - Year-over-year growth 2024-2029 (%)
- 11.14 Canada - Market size and forecast 2024-2029
- Chart on Canada - Market size and forecast 2024-2029 ($ million)
- Data Table on Canada - Market size and forecast 2024-2029 ($ million)
- Chart on Canada - Year-over-year growth 2024-2029 (%)
- Data Table on Canada - Year-over-year growth 2024-2029 (%)
- 11.15 Brazil - Market size and forecast 2024-2029
- Chart on Brazil - Market size and forecast 2024-2029 ($ million)
- Data Table on Brazil - Market size and forecast 2024-2029 ($ million)
- Chart on Brazil - Year-over-year growth 2024-2029 (%)
- Data Table on Brazil - Year-over-year growth 2024-2029 (%)
- 11.16 South Korea - Market size and forecast 2024-2029
- Chart on South Korea - Market size and forecast 2024-2029 ($ million)
- Data Table on South Korea - Market size and forecast 2024-2029 ($ million)
- Chart on South Korea - Year-over-year growth 2024-2029 (%)
- Data Table on South Korea - Year-over-year growth 2024-2029 (%)
- 11.17 Germany - Market size and forecast 2024-2029
- Chart on Germany - Market size and forecast 2024-2029 ($ million)
- Data Table on Germany - Market size and forecast 2024-2029 ($ million)
- Chart on Germany - Year-over-year growth 2024-2029 (%)
- Data Table on Germany - Year-over-year growth 2024-2029 (%)
- 11.18 Market opportunity By Geographical Landscape
- Market opportunity By Geographical Landscape ($ million)
- Data Tables on Market opportunity By Geographical Landscape ($ million)
12 Drivers, Challenges, and Opportunity/Restraints
- 12.1 Market drivers
- 12.2 Market challenges
- 12.3 Impact of drivers and challenges
- Impact of drivers and challenges in 2024 and 2029
- 12.4 Market opportunities/restraints
13 Competitive Landscape
- 13.1 Overview
- 13.2 Competitive Landscape
- Overview on criticality of inputs and factors of differentiation
- 13.3 Landscape disruption
- Overview on factors of disruption
- 13.4 Industry risks
- Impact of key risks on business
14 Competitive Analysis
- 14.1 Companies profiled
- Companies covered
- 14.2 Company ranking index
- Company ranking index
- 14.3 Market positioning of companies
- Matrix on companies position and classification
- 14.4 Amadeus IT Group SA
- Amadeus IT Group SA - Overview
- Amadeus IT Group SA - Business segments
- Amadeus IT Group SA - Key offerings
- Amadeus IT Group SA - Segment focus
- SWOT
- 14.5 Atos SE
- Atos SE - Overview
- Atos SE - Business segments
- Atos SE - Key news
- Atos SE - Key offerings
- Atos SE - Segment focus
- SWOT
- 14.6 Capgemini Services SAS
- Capgemini Services SAS - Overview
- Capgemini Services SAS - Business segments
- Capgemini Services SAS - Key news
- Capgemini Services SAS - Key offerings
- Capgemini Services SAS - Segment focus
- SWOT
- 14.7 Damarel Systems International Ltd.
- Damarel Systems International Ltd. - Overview
- Damarel Systems International Ltd. - Product / Service
- Damarel Systems International Ltd. - Key offerings
- SWOT
- 14.8 INFORM GmbH
- INFORM GmbH - Overview
- INFORM GmbH - Product / Service
- INFORM GmbH - Key offerings
- SWOT
- 14.9 International Business Machines Corp.
- International Business Machines Corp. - Overview
- International Business Machines Corp. - Business segments
- International Business Machines Corp. - Key news
- International Business Machines Corp. - Key offerings
- International Business Machines Corp. - Segment focus
- SWOT
- 14.10 Intersystems
- Intersystems - Overview
- Intersystems - Product / Service
- Intersystems - Key offerings
- SWOT
- 14.11 Lockheed Martin Corp.
- Lockheed Martin Corp. - Overview
- Lockheed Martin Corp. - Business segments
- Lockheed Martin Corp. - Key news
- Lockheed Martin Corp. - Key offerings
- Lockheed Martin Corp. - Segment focus
- SWOT
- 14.12 NEC Corp.
- NEC Corp. - Overview
- NEC Corp. - Business segments
- NEC Corp. - Key news
- NEC Corp. - Key offerings
- NEC Corp. - Segment focus
- SWOT
- 14.13 Northrop Grumman Corp.
- Northrop Grumman Corp. - Overview
- Northrop Grumman Corp. - Business segments
- Northrop Grumman Corp. - Key news
- Northrop Grumman Corp. - Key offerings
- Northrop Grumman Corp. - Segment focus
- SWOT
- 14.14 RTX Corp.
- RTX Corp. - Overview
- RTX Corp. - Business segments
- RTX Corp. - Key news
- RTX Corp. - Key offerings
- RTX Corp. - Segment focus
- SWOT
- 14.15 RESA SAS
- RESA SAS - Overview
- RESA SAS - Product / Service
- RESA SAS - Key offerings
- SWOT
- 14.16 Siemens AG
- Siemens AG - Overview
- Siemens AG - Business segments
- Siemens AG - Key news
- Siemens AG - Key offerings
- Siemens AG - Segment focus
- SWOT
- 14.17 SITA
- SITA - Overview
- SITA - Product / Service
- SITA - Key offerings
- SWOT
- 14.18 VELATIA S.L
- VELATIA S.L - Overview
- VELATIA S.L - Product / Service
- VELATIA S.L - Key offerings
- SWOT
15 Appendix
- 15.1 Scope of the report
- 15.2 Inclusions and exclusions checklist
- Inclusions checklist
- Exclusions checklist
- 15.3 Currency conversion rates for US$
- Currency conversion rates for US$
- 15.4 Research methodology
- Research methodology
- 15.5 Data procurement
- Information sources
- 15.6 Data validation
- Data validation
- 15.7 Validation techniques employed for market sizing
- Validation techniques employed for market sizing
- 15.8 Data synthesis
- Data synthesis
- 15.9 360 degree market analysis
- 360 degree market analysis
- 15.10 List of abbreviations
- List of abbreviations

