|
|
市場調査レポート
商品コード
1453820
船舶用潤滑油の世界市場 2024-2028Global Marine Lubricants Market 2024-2028 |
||||||

|
|||||||
カスタマイズ可能
|
|||||||


| 船舶用潤滑油の世界市場 2024-2028 |
|
出版日: 2024年03月08日
発行: TechNavio
ページ情報: 英文 180 Pages
納期: 即納可能
|

全表示
- 概要
- 図表
- 目次
船舶用潤滑油市場は2023-2028年に4,121万米ドル、予測期間中のCAGRは2.49%で成長すると予測されています。
当レポートでは、船舶用潤滑油市場の全体的な分析、市場規模・予測、動向、成長促進要因、課題、約25のベンダーを網羅したベンダー分析などを掲載しています。
現在の市場シナリオ、最新動向と促進要因、市場環境全体に関する最新分析を提供しています。市場は、最適化されたエンジン性能と燃費効率に対するニーズの高まり、海運産業の開拓、海軍支出の増加によって牽引されています。
| 市場範囲 | |
|---|---|
| 基準年 | 2024 |
| 終了年 | 2028 |
| 予測期間 | 2024-2028 |
| 成長モメンタム | 加速 |
| 前年比2024年 | 2.26% |
| CAGR | 2.49% |
| 増分額 | 4,121万米ドル |
本調査では、今後数年間における船舶用潤滑油市場の成長を促進する主な要因の一つとして、バイオベース潤滑油の使用増加を挙げています。また、商業分野からの船舶用潤滑油需要の増加、海上貿易と輸送の増加も市場の大きな需要につながります。
目次
第1章 エグゼクティブサマリー
- 市場概要
第2章 市場情勢
- 市場エコシステム
第3章 市場規模
- 市場の定義
- 市場セグメント分析
- 市場規模 2023
- 市場の見通し 2023-2028
第4章 市場規模実績
- 船舶用潤滑油の世界市場 2018-2022
- 用途別セグメント分析 2018-2022
- タイプセグメント分析 2018-2022
- 地域別セグメント分析 2018-2022
- 国別セグメント分析 2018-2022
第5章 ファイブフォース分析
- ファイブフォースの要約
- 買い手の交渉力
- 供給企業の交渉力
- 新規参入業者の脅威
- 代替品の脅威
- 競争の脅威
- 市況
第6章 市場セグメンテーション:用途別
- 市場セグメント
- 比較:用途別
- エンジンオイル:市場規模と予測 2023-2028
- 油圧オイル:市場規模と予測 2023-2028
- グリース:市場規模と予測 2023-2028
- その他:市場規模と予測 2023-2028
- 市場機会:用途別
第7章 市場セグメンテーション:タイプ別
- 市場セグメント
- 比較:タイプ別
- 鉱物油ベース船舶用潤滑油:市場規模と予測 2023-2028
- バイオベース船舶用潤滑油:市場規模と予測 2023-2028
- 合成船舶用潤滑油:市場規模と予測 2023-2028
- 市場機会:タイプ別
第8章 顧客情勢
- 顧客情勢の概要
第9章 地域別情勢
- 地域別セグメンテーション
- 地域別比較
- アジア太平洋:市場規模と予測 2023-2028
- 欧州:市場規模と予測 2023-2028
- 北米:市場規模と予測 2023-2028
- 中東・アフリカ:市場規模と予測 2023-2028
- 南米:市場規模と予測 2023-2028
- 中国:市場規模と予測 2023-2028
- 米国:市場規模と予測 2023-2028
- 韓国:市場規模と予測 2023-2028
- イタリア:市場規模と予測 2023-2028
- 日本:市場規模と予測 2023-2028
- 市場機会:地域情勢別
第10章 促進要因、課題、および動向
- 市場促進要因
- 市場の課題
- 促進要因と課題の影響
- 市場動向
第11章 ベンダー情勢
- 概要
- ベンダー情勢
- 混乱の状況
- 業界のリスク
第12章 ベンダー分析
- 対象ベンダー
- ベンダーの市場ポジショニング
- BP Plc
- Chevron Corp.
- Compania Espanola de Petroleos SA
- ENEOS Holdings Inc
- Eni SpA
- Exxon Mobil Corp.
- FUCHS PETROLUB SE
- Gazprom Nedra LLC
- Gulf Oil International Ltd
- Idemitsu Kosan Co. Ltd.
- Indian Oil Corp. Ltd.
- PJSC LUKOIL
- Shell plc
- Sinopec Shanghai Petrochemical Co. Ltd.
- TotalEnergies SE
第13章 付録
Exhibits:
- Exhibits1: Executive Summary - Chart on Market Overview
- Exhibits2: Executive Summary - Data Table on Market Overview
- Exhibits3: Executive Summary - Chart on Global Market Characteristics
- Exhibits4: Executive Summary - Chart on Market By Geographical Landscape
- Exhibits5: Executive Summary - Chart on Market Segmentation by Application
- Exhibits6: Executive Summary - Chart on Market Segmentation by Type
- Exhibits7: Executive Summary - Chart on Incremental Growth
- Exhibits8: Executive Summary - Data Table on Incremental Growth
- Exhibits9: Executive Summary - Chart on Vendor Market Positioning
- Exhibits10: Parent market
- Exhibits11: Market Characteristics
- Exhibits12: Offerings of vendors included in the market definition
- Exhibits13: Market segments
- Exhibits14: Chart on Global - Market size and forecast 2023-2028 ($ million)
- Exhibits15: Data Table on Global - Market size and forecast 2023-2028 ($ million)
- Exhibits16: Chart on Global Market: Year-over-year growth 2023-2028 (%)
- Exhibits17: Data Table on Global Market: Year-over-year growth 2023-2028 (%)
- Exhibits18: Historic Market Size - Data Table on global marine lubricants market 2018 - 2022 ($ million)
- Exhibits19: Historic Market Size - Application Segment 2018 - 2022 ($ million)
- Exhibits20: Historic Market Size - Type Segment 2018 - 2022 ($ million)
- Exhibits21: Historic Market Size - Geography Segment 2018 - 2022 ($ million)
- Exhibits22: Historic Market Size - Country Segment 2018 - 2022 ($ million)
- Exhibits23: Five forces analysis - Comparison between 2023 and 2028
- Exhibits24: Chart on Bargaining power of buyers - Impact of key factors 2023 and 2028
- Exhibits25: Bargaining power of suppliers - Impact of key factors in 2023 and 2028
- Exhibits26: Threat of new entrants - Impact of key factors in 2023 and 2028
- Exhibits27: Threat of substitutes - Impact of key factors in 2023 and 2028
- Exhibits28: Threat of rivalry - Impact of key factors in 2023 and 2028
- Exhibits29: Chart on Market condition - Five forces 2023 and 2028
- Exhibits30: Chart on Application - Market share 2023-2028 (%)
- Exhibits31: Data Table on Application - Market share 2023-2028 (%)
- Exhibits32: Chart on Comparison by Application
- Exhibits33: Data Table on Comparison by Application
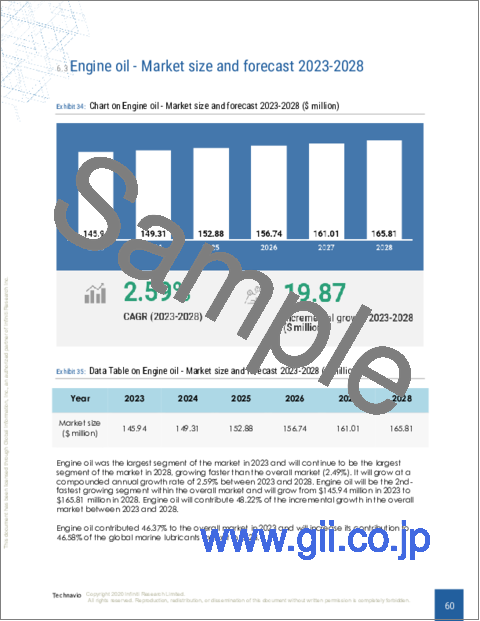
- Exhibits34: Chart on Engine oil - Market size and forecast 2023-2028 ($ million)
- Exhibits35: Data Table on Engine oil - Market size and forecast 2023-2028 ($ million)
- Exhibits36: Chart on Engine oil - Year-over-year growth 2023-2028 (%)
- Exhibits37: Data Table on Engine oil - Year-over-year growth 2023-2028 (%)
- Exhibits38: Chart on Hydraulic oil - Market size and forecast 2023-2028 ($ million)
- Exhibits39: Data Table on Hydraulic oil - Market size and forecast 2023-2028 ($ million)
- Exhibits40: Chart on Hydraulic oil - Year-over-year growth 2023-2028 (%)
- Exhibits41: Data Table on Hydraulic oil - Year-over-year growth 2023-2028 (%)
- Exhibits42: Chart on Grease - Market size and forecast 2023-2028 ($ million)
- Exhibits43: Data Table on Grease - Market size and forecast 2023-2028 ($ million)
- Exhibits44: Chart on Grease - Year-over-year growth 2023-2028 (%)
- Exhibits45: Data Table on Grease - Year-over-year growth 2023-2028 (%)
- Exhibits46: Chart on Others - Market size and forecast 2023-2028 ($ million)
- Exhibits47: Data Table on Others - Market size and forecast 2023-2028 ($ million)
- Exhibits48: Chart on Others - Year-over-year growth 2023-2028 (%)
- Exhibits49: Data Table on Others - Year-over-year growth 2023-2028 (%)
- Exhibits50: Market opportunity by Application ($ million)
- Exhibits51: Data Table on Market opportunity by Application ($ million)
- Exhibits52: Chart on Type - Market share 2023-2028 (%)
- Exhibits53: Data Table on Type - Market share 2023-2028 (%)
- Exhibits54: Chart on Comparison by Type
- Exhibits55: Data Table on Comparison by Type
- Exhibits56: Chart on Mineral oil-based marine lubricants - Market size and forecast 2023-2028 ($ million)
- Exhibits57: Data Table on Mineral oil-based marine lubricants - Market size and forecast 2023-2028 ($ million)
- Exhibits58: Chart on Mineral oil-based marine lubricants - Year-over-year growth 2023-2028 (%)
- Exhibits59: Data Table on Mineral oil-based marine lubricants - Year-over-year growth 2023-2028 (%)
- Exhibits60: Chart on Bio-based marine lubricants - Market size and forecast 2023-2028 ($ million)
- Exhibits61: Data Table on Bio-based marine lubricants - Market size and forecast 2023-2028 ($ million)
- Exhibits62: Chart on Bio-based marine lubricants - Year-over-year growth 2023-2028 (%)
- Exhibits63: Data Table on Bio-based marine lubricants - Year-over-year growth 2023-2028 (%)
- Exhibits64: Chart on Synthetic marine lubricants - Market size and forecast 2023-2028 ($ million)
- Exhibits65: Data Table on Synthetic marine lubricants - Market size and forecast 2023-2028 ($ million)
- Exhibits66: Chart on Synthetic marine lubricants - Year-over-year growth 2023-2028 (%)
- Exhibits67: Data Table on Synthetic marine lubricants - Year-over-year growth 2023-2028 (%)
- Exhibits68: Market opportunity by Type ($ million)
- Exhibits69: Data Table on Market opportunity by Type ($ million)
- Exhibits70: Analysis of price sensitivity, lifecycle, customer purchase basket, adoption rates, and purchase criteria
- Exhibits71: Chart on Market share By Geographical Landscape 2023-2028 (%)
- Exhibits72: Data Table on Market share By Geographical Landscape 2023-2028 (%)
- Exhibits73: Chart on Geographic comparison
- Exhibits74: Data Table on Geographic comparison
- Exhibits75: Chart on APAC - Market size and forecast 2023-2028 ($ million)
- Exhibits76: Data Table on APAC - Market size and forecast 2023-2028 ($ million)
- Exhibits77: Chart on APAC - Year-over-year growth 2023-2028 (%)
- Exhibits78: Data Table on APAC - Year-over-year growth 2023-2028 (%)
- Exhibits79: Chart on Europe - Market size and forecast 2023-2028 ($ million)
- Exhibits80: Data Table on Europe - Market size and forecast 2023-2028 ($ million)
- Exhibits81: Chart on Europe - Year-over-year growth 2023-2028 (%)
- Exhibits82: Data Table on Europe - Year-over-year growth 2023-2028 (%)
- Exhibits83: Chart on North America - Market size and forecast 2023-2028 ($ million)
- Exhibits84: Data Table on North America - Market size and forecast 2023-2028 ($ million)
- Exhibits85: Chart on North America - Year-over-year growth 2023-2028 (%)
- Exhibits86: Data Table on North America - Year-over-year growth 2023-2028 (%)
- Exhibits87: Chart on Middle East and Africa - Market size and forecast 2023-2028 ($ million)
- Exhibits88: Data Table on Middle East and Africa - Market size and forecast 2023-2028 ($ million)
- Exhibits89: Chart on Middle East and Africa - Year-over-year growth 2023-2028 (%)
- Exhibits90: Data Table on Middle East and Africa - Year-over-year growth 2023-2028 (%)
- Exhibits91: Chart on South America - Market size and forecast 2023-2028 ($ million)
- Exhibits92: Data Table on South America - Market size and forecast 2023-2028 ($ million)
- Exhibits93: Chart on South America - Year-over-year growth 2023-2028 (%)
- Exhibits94: Data Table on South America - Year-over-year growth 2023-2028 (%)
- Exhibits95: Chart on China - Market size and forecast 2023-2028 ($ million)
- Exhibits96: Data Table on China - Market size and forecast 2023-2028 ($ million)
- Exhibits97: Chart on China - Year-over-year growth 2023-2028 (%)
- Exhibits98: Data Table on China - Year-over-year growth 2023-2028 (%)
- Exhibits99: Chart on US - Market size and forecast 2023-2028 ($ million)
- Exhibits100: Data Table on US - Market size and forecast 2023-2028 ($ million)
- Exhibits101: Chart on US - Year-over-year growth 2023-2028 (%)
- Exhibits102: Data Table on US - Year-over-year growth 2023-2028 (%)
- Exhibits103: Chart on South Korea - Market size and forecast 2023-2028 ($ million)
- Exhibits104: Data Table on South Korea - Market size and forecast 2023-2028 ($ million)
- Exhibits105: Chart on South Korea - Year-over-year growth 2023-2028 (%)
- Exhibits106: Data Table on South Korea - Year-over-year growth 2023-2028 (%)
- Exhibits107: Chart on Italy - Market size and forecast 2023-2028 ($ million)
- Exhibits108: Data Table on Italy - Market size and forecast 2023-2028 ($ million)
- Exhibits109: Chart on Italy - Year-over-year growth 2023-2028 (%)
- Exhibits110: Data Table on Italy - Year-over-year growth 2023-2028 (%)
- Exhibits111: Chart on Japan - Market size and forecast 2023-2028 ($ million)
- Exhibits112: Data Table on Japan - Market size and forecast 2023-2028 ($ million)
- Exhibits113: Chart on Japan - Year-over-year growth 2023-2028 (%)
- Exhibits114: Data Table on Japan - Year-over-year growth 2023-2028 (%)
- Exhibits115: Market opportunity By Geographical Landscape ($ million)
- Exhibits116: Data Tables on Market opportunity By Geographical Landscape ($ million)
- Exhibits117: Impact of drivers and challenges in 2023 and 2028
- Exhibits118: Overview on Criticality of inputs and Factors of differentiation
- Exhibits119: Overview on factors of disruption
- Exhibits120: Impact of key risks on business
- Exhibits121: Vendors covered
- Exhibits122: Matrix on vendor position and classification
- Exhibits123: BP Plc - Overview
- Exhibits124: BP Plc - Business segments
- Exhibits125: BP Plc - Key news
- Exhibits126: BP Plc - Key offerings
- Exhibits127: BP Plc - Segment focus
- Exhibits128: Chevron Corp. - Overview
- Exhibits129: Chevron Corp. - Business segments
- Exhibits130: Chevron Corp. - Key offerings
- Exhibits131: Chevron Corp. - Segment focus
- Exhibits132: Compania Espanola de Petroleos SA - Overview
- Exhibits133: Compania Espanola de Petroleos SA - Business segments
- Exhibits134: Compania Espanola de Petroleos SA - Key offerings
- Exhibits135: Compania Espanola de Petroleos SA - Segment focus
- Exhibits136: ENEOS Holdings Inc - Overview
- Exhibits137: ENEOS Holdings Inc - Business segments
- Exhibits138: ENEOS Holdings Inc - Key offerings
- Exhibits139: ENEOS Holdings Inc - Segment focus
- Exhibits140: Eni SpA - Overview
- Exhibits141: Eni SpA - Business segments
- Exhibits142: Eni SpA - Key offerings
- Exhibits143: Eni SpA - Segment focus
- Exhibits144: Exxon Mobil Corp. - Overview
- Exhibits145: Exxon Mobil Corp. - Business segments
- Exhibits146: Exxon Mobil Corp. - Key news
- Exhibits147: Exxon Mobil Corp. - Key offerings
- Exhibits148: Exxon Mobil Corp. - Segment focus
- Exhibits149: FUCHS PETROLUB SE - Overview
- Exhibits150: FUCHS PETROLUB SE - Business segments
- Exhibits151: FUCHS PETROLUB SE - Key news
- Exhibits152: FUCHS PETROLUB SE - Key offerings
- Exhibits153: FUCHS PETROLUB SE - Segment focus
- Exhibits154: Gazprom Nedra LLC - Overview
- Exhibits155: Gazprom Nedra LLC - Product / Service
- Exhibits156: Gazprom Nedra LLC - Key offerings
- Exhibits157: Gulf Oil International Ltd - Overview
- Exhibits158: Gulf Oil International Ltd - Product / Service
- Exhibits159: Gulf Oil International Ltd - Key offerings
- Exhibits160: Idemitsu Kosan Co. Ltd. - Overview
- Exhibits161: Idemitsu Kosan Co. Ltd. - Business segments
- Exhibits162: Idemitsu Kosan Co. Ltd. - Key offerings
- Exhibits163: Idemitsu Kosan Co. Ltd. - Segment focus
- Exhibits164: Indian Oil Corp. Ltd. - Overview
- Exhibits165: Indian Oil Corp. Ltd. - Business segments
- Exhibits166: Indian Oil Corp. Ltd. - Key offerings
- Exhibits167: Indian Oil Corp. Ltd. - Segment focus
- Exhibits168: PJSC LUKOIL - Overview
- Exhibits169: PJSC LUKOIL - Product / Service
- Exhibits170: PJSC LUKOIL - Key offerings
- Exhibits171: Shell plc - Overview
- Exhibits172: Shell plc - Business segments
- Exhibits173: Shell plc - Key news
- Exhibits174: Shell plc - Key offerings
- Exhibits175: Shell plc - Segment focus
- Exhibits176: Sinopec Shanghai Petrochemical Co. Ltd. - Overview
- Exhibits177: Sinopec Shanghai Petrochemical Co. Ltd. - Business segments
- Exhibits178: Sinopec Shanghai Petrochemical Co. Ltd. - Key news
- Exhibits179: Sinopec Shanghai Petrochemical Co. Ltd. - Key offerings
- Exhibits180: Sinopec Shanghai Petrochemical Co. Ltd. - Segment focus
- Exhibits181: TotalEnergies SE - Overview
- Exhibits182: TotalEnergies SE - Business segments
- Exhibits183: TotalEnergies SE - Key news
- Exhibits184: TotalEnergies SE - Key offerings
- Exhibits185: TotalEnergies SE - Segment focus
- Exhibits186: Inclusions checklist
- Exhibits187: Exclusions checklist
- Exhibits188: Currency conversion rates for US$
- Exhibits189: Research methodology
- Exhibits190: Validation techniques employed for market sizing
- Exhibits191: Information sources
- Exhibits192: List of abbreviations
The marine lubricants market is forecasted to grow by USD 41.21 mn during 2023-2028, accelerating at a CAGR of 2.49% during the forecast period. The report on the marine lubricants market provides a holistic analysis, market size and forecast, trends, growth drivers, and challenges, as well as vendor analysis covering around 25 vendors.
The report offers an up-to-date analysis regarding the current market scenario, the latest trends and drivers, and the overall market environment. The market is driven by growing need for optimized engine performance and fuel efficiency, development of shipping industry, and increase in naval expenditure.
Technavio's marine lubricants market is segmented as below:
| Market Scope | |
|---|---|
| Base Year | 2024 |
| End Year | 2028 |
| Series Year | 2024-2028 |
| Growth Momentum | Accelerate |
| YOY 2024 | 2.26% |
| CAGR | 2.49% |
| Incremental Value | $41.21mn |
By Application
- Engine oil
- Hydraulic oil
- Grease
- Others
By Type
- Mineral oil-based marine lubricants
- Bio-based marine lubricants
- Synthetic marine lubricants
By Geographical Landscape
- APAC
- Europe
- North America
- Middle East and Africa
- South America
This study identifies the growth in use of bio-based lubricants as one of the prime reasons driving the marine lubricants market growth during the next few years. Also, increasing demand for marine lubricants from commercial segment and increase in maritime trade and transport will lead to sizable demand in the market.
The report on the marine lubricants market covers the following areas:
- Marine lubricants market sizing
- Marine lubricants market forecast
- Marine lubricants market industry analysis
The robust vendor analysis is designed to help clients improve their market position, and in line with this, this report provides a detailed analysis of several leading marine lubricants market vendors that include Benjn.R.Vickers and Sons Ltd., BP Plc, Chevron Corp., Compania Espanola de Petroleos SA, ENEOS Holdings Inc, Eni SpA, Exxon Mobil Corp., Feoso Oil Ltd., FUCHS PETROLUB SE, Gulf Oil International Ltd, Idemitsu Kosan Co. Ltd., Indian Oil Corp. Ltd., PJSC LUKOIL, Repsol SA, Shell plc, Sinopec Shanghai Petrochemical Co. Ltd., Valvoline Inc., TotalEnergies SE, Emirates National Oil Co. Ltd. LLC, and Gazprom Nedra LLC. Also, the marine lubricants market analysis report includes information on upcoming trends and challenges that will influence market growth. This is to help companies strategize and leverage all forthcoming growth opportunities.
The study was conducted using an objective combination of primary and secondary information including inputs from key participants in the industry. The report contains a comprehensive market and vendor landscape in addition to an analysis of the key vendors.
The publisher presents a detailed picture of the market by the way of study, synthesis, and summation of data from multiple sources by an analysis of key parameters such as profit, pricing, competition, and promotions. It presents various market facets by identifying the key industry influencers. The data presented is comprehensive, reliable, and a result of extensive research - both primary and secondary. The market research reports provide a complete competitive landscape and an in-depth vendor selection methodology and analysis using qualitative and quantitative research to forecast the accurate market growth.
Table of Contents
1 Executive Summary
- 1.1 Market overview
2 Market Landscape
- 2.1 Market ecosystem
3 Market Sizing
- 3.1 Market definition
- 3.2 Market segment analysis
- 3.3 Market size 2023
- 3.4 Market outlook: Forecast for 2023-2028
4 Historic Market Size
- 4.1 Global marine lubricants market 2018 - 2022
- 4.2 Application Segment Analysis 2018 - 2022
- 4.3 Type Segment Analysis 2018 - 2022
- 4.4 Geography Segment Analysis 2018 - 2022
- 4.5 Country Segment Analysis 2018 - 2022
5 Five Forces Analysis
- 5.1 Five forces summary
- 5.2 Bargaining power of buyers
- 5.3 Bargaining power of suppliers
- 5.4 Threat of new entrants
- 5.5 Threat of substitutes
- 5.6 Threat of rivalry
- 5.7 Market condition
6 Market Segmentation by Application
- 6.1 Market segments
- 6.2 Comparison by Application
- 6.3 Engine oil - Market size and forecast 2023-2028
- 6.4 Hydraulic oil - Market size and forecast 2023-2028
- 6.5 Grease - Market size and forecast 2023-2028
- 6.6 Others - Market size and forecast 2023-2028
- 6.7 Market opportunity by Application
7 Market Segmentation by Type
- 7.1 Market segments
- 7.2 Comparison by Type
- 7.3 Mineral oil-based marine lubricants - Market size and forecast 2023-2028
- 7.4 Bio-based marine lubricants - Market size and forecast 2023-2028
- 7.5 Synthetic marine lubricants - Market size and forecast 2023-2028
- 7.6 Market opportunity by Type
8 Customer Landscape
- 8.1 Customer landscape overview
9 Geographic Landscape
- 9.1 Geographic segmentation
- 9.2 Geographic comparison
- 9.3 APAC - Market size and forecast 2023-2028
- 9.4 Europe - Market size and forecast 2023-2028
- 9.5 North America - Market size and forecast 2023-2028
- 9.6 Middle East and Africa - Market size and forecast 2023-2028
- 9.7 South America - Market size and forecast 2023-2028
- 9.8 China - Market size and forecast 2023-2028
- 9.9 US - Market size and forecast 2023-2028
- 9.10 South Korea - Market size and forecast 2023-2028
- 9.11 Italy - Market size and forecast 2023-2028
- 9.12 Japan - Market size and forecast 2023-2028
- 9.13 Market opportunity By Geographical Landscape
10 Drivers, Challenges, and Trends
- 10.1 Market drivers
- 10.2 Market challenges
- 10.3 Impact of drivers and challenges
- 10.4 Market trends
11 Vendor Landscape
- 11.1 Overview
- 11.2 Vendor landscape
- 11.3 Landscape disruption
- 11.4 Industry risks
12 Vendor Analysis
- 12.1 Vendors covered
- 12.2 Market positioning of vendors
- 12.3 BP Plc
- 12.4 Chevron Corp.
- 12.5 Compania Espanola de Petroleos SA
- 12.6 ENEOS Holdings Inc
- 12.7 Eni SpA
- 12.8 Exxon Mobil Corp.
- 12.9 FUCHS PETROLUB SE
- 12.10 Gazprom Nedra LLC
- 12.11 Gulf Oil International Ltd
- 12.12 Idemitsu Kosan Co. Ltd.
- 12.13 Indian Oil Corp. Ltd.
- 12.14 PJSC LUKOIL
- 12.15 Shell plc
- 12.16 Sinopec Shanghai Petrochemical Co. Ltd.
- 12.17 TotalEnergies SE
13 Appendix
- 13.1 Scope of the report
- 13.2 Inclusions and exclusions checklist
- 13.3 Currency conversion rates for US$
- 13.4 Research methodology
- 13.5 List of abbreviations

