|
|
市場調査レポート
商品コード
1709688
インテリジェント交通管理の世界市場 2025-2029年Global Intelligent Traffic Management Market 2025-2029 |
||||||

|
|||||||
カスタマイズ可能
|
|||||||

| インテリジェント交通管理の世界市場 2025-2029年 |
|
出版日: 2025年04月12日
発行: TechNavio
ページ情報: 英文 233 Pages
納期: 即納可能
|

全表示
- 概要
- 図表
- 目次
インテリジェント交通管理市場は2024-2029年に240億1,460万米ドル、予測期間中のCAGRは14.8%で成長すると予測されます。
当レポートでは、インテリジェント交通管理市場の全体的な分析、市場規模・予測、動向、成長促進要因、課題、約25のベンダーを網羅したベンダー分析などを掲載しています。
現在の市場シナリオ、最新動向と促進要因、市場環境全体に関する最新分析を提供しています。市場を牽引するのは、AIベースのスマート交通ソリューションに対する需要の高まり、各国政府によるスマートシティへの投資の増加、交通流管理の効率化などです。
| 市場範囲 | |
|---|---|
| 基準年 | 2025 |
| 終了年 | 2029 |
| 予測期間 | 2025-2029 |
| 成長モメンタム | 加速 |
| 前年比2025年 | 12.6% |
| CAGR | 14.8% |
| 増分額 | 240億1,460万米ドル |
本調査は、業界の主要参加者からのインプットを含め、一次情報と二次情報を客観的に組み合わせて実施しました。レポートには、主要企業の分析に加え、包括的な市場規模データ、地域分析によるセグメント、ベンダー情勢が含まれています。レポートには過去データと予測データがあります。
本調査では、今後数年間のインテリジェント交通管理市場の成長を促進する主な要因の1つとして、道路を走る車両数の増加を挙げています。また、急速な都市化と政府の効果的な取り組みが、市場の大きな需要につながるでしょう。
目次
第1章 エグゼクティブサマリー
- 市場概要
第2章 Technavio分析
- 価格・ライフサイクル・顧客購入バスケット・採用率・購入基準の分析
- インプットの重要性と差別化の要因
- 混乱の要因
- 促進要因と課題の影響
第3章 市場情勢
- 市場エコシステム
- 市場の特徴
- バリューチェーン分析
第4章 市場規模
- 市場の定義
- 市場セグメント分析
- 市場規模 2024
- 市場の見通し 2024-2029
第5章 市場規模実績
- インテリジェント交通管理の世界市場 2019-2023
- ソリューションセグメント分析 2019-2023
- 部品セグメント分析 2019-2023
- エンドユーザーセグメント分析 2019-2023
- 地域別セグメント分析 2019-2023
- 国別セグメント分析 2019-2023
第6章 定性分析
- AIの影響:インテリジェント交通管理の世界市場
第7章 ファイブフォース分析
- ファイブフォースの要約
- 買い手の交渉力
- 供給企業の交渉力
- 新規参入業者の脅威
- 代替品の脅威
- 競争の脅威
- 市況
第8章 市場セグメンテーション:ソリューション別
- 市場セグメント
- 比較:ソリューション別
- 交通監視システム:市場規模と予測 2024-2029
- 交通信号制御システム:市場規模と予測 2024-2029
- 交通取り締まりカメラ:市場規模と予測 2024-2029
- 統合回廊管理:市場規模と予測 2024-2029
- その他:市場規模と予測 2024-2029
- 市場機会:ソリューション別
第9章 市場セグメンテーション:コンポーネント別
- 市場セグメント
- 比較:コンポーネント別
- 監視カメラ:市場規模と予測 2024-2029
- ビデオウォール:市場規模と予測 2024-2029
- 交通管制官と信号:市場規模と予測 2024-2029
- その他:市場規模と予測 2024-2029
- 市場機会:コンポーネント別
第10章 市場セグメンテーション:エンドユーザー別
- 市場セグメント
- 比較:エンドユーザー別
- 政府機関:市場規模と予測 2024-2029
- 交通機関:市場規模と予測 2024-2029
- 商業:市場規模と予測 2024-2029
- 市場機会:エンドユーザー別
第11章 顧客情勢
- 顧客情勢の概要
第12章 地域別情勢
- 地域別セグメンテーション
- 地域別比較
- 北米:市場規模と予測 2024-2029
- 欧州:市場規模と予測 2024-2029
- アジア太平洋:市場規模と予測 2024-2029
- 南米:市場規模と予測 2024-2029
- 中東・アフリカ:市場規模と予測 2024-2029
- 米国:市場規模と予測 2024-2029
- 中国:市場規模と予測 2024-2029
- 英国:市場規模と予測 2024-2029
- カナダ:市場規模と予測 2024-2029
- 日本:市場規模と予測 2024-2029
- ドイツ:市場規模と予測 2024-2029
- フランス:市場規模と予測 2024-2029
- インド:市場規模と予測 2024-2029
- イタリア:市場規模と予測 2024-2029
- 韓国:市場規模と予測 2024-2029
- 市場機会:地域情勢別
第13章 促進要因・課題・機会・抑制要因
- 市場促進要因
- 市場の課題
- 促進要因と課題の影響
- 市場の機会・抑制要因
第14章 競合情勢
- 概要
- 競合情勢
- 混乱の状況
- 業界のリスク
第15章 競合分析
- 企業プロファイル
- 企業ランキング指数
- 企業の市場ポジショニング
- Chevron Traffic Management
- Cisco Systems Inc.
- Cubic Corp.
- Huawei Technologies Co. Ltd.
- INRIX Inc.
- International Business Machines Corp.
- Kapsch TrafficCom AG
- PTV Planung Transport Verkehr AG
- Q Free ASA
- Rekor Systems Inc.
- Siemens AG
- SNC Lavalin Group Inc.
- SWARCO AG
- TagMaster AB
- TransCore
第16章 付録
Exhibits:
- Exhibits1: Executive Summary - Chart on Market Overview
- Exhibits2: Executive Summary - Data Table on Market Overview
- Exhibits3: Executive Summary - Chart on Global Market Characteristics
- Exhibits4: Executive Summary - Chart on Market By Geographical Landscape
- Exhibits5: Executive Summary - Chart on Market Segmentation by Solution
- Exhibits6: Executive Summary - Chart on Market Segmentation by Component
- Exhibits7: Executive Summary - Chart on Market Segmentation by End-user
- Exhibits8: Executive Summary - Chart on Incremental Growth
- Exhibits9: Executive Summary - Data Table on Incremental Growth
- Exhibits10: Executive Summary - Chart on Company Market Positioning
- Exhibits11: Analysis of price sensitivity, lifecycle, customer purchase basket, adoption rates, and purchase criteria
- Exhibits12: Overview on criticality of inputs and factors of differentiation
- Exhibits13: Overview on factors of disruption
- Exhibits14: Impact of drivers and challenges in 2024 and 2029
- Exhibits15: Parent Market
- Exhibits16: Data Table on - Parent Market
- Exhibits17: Market characteristics analysis
- Exhibits18: Value chain analysis
- Exhibits19: Offerings of companies included in the market definition
- Exhibits20: Market segments
- Exhibits21: Chart on Global - Market size and forecast 2024-2029 ($ million)
- Exhibits22: Data Table on Global - Market size and forecast 2024-2029 ($ million)
- Exhibits23: Chart on Global Market: Year-over-year growth 2024-2029 (%)
- Exhibits24: Data Table on Global Market: Year-over-year growth 2024-2029 (%)
- Exhibits25: Historic Market Size - Data Table on Global Intelligent Traffic Management Market 2019 - 2023 ($ million)
- Exhibits26: Historic Market Size - Solution Segment 2019 - 2023 ($ million)
- Exhibits27: Historic Market Size - Component Segment 2019 - 2023 ($ million)
- Exhibits28: Historic Market Size - End-user Segment 2019 - 2023 ($ million)
- Exhibits29: Historic Market Size - Geography Segment 2019 - 2023 ($ million)
- Exhibits30: Historic Market Size - Country Segment 2019 - 2023 ($ million)
- Exhibits31: Five forces analysis - Comparison between 2024 and 2029
- Exhibits32: Bargaining power of buyers - Impact of key factors 2024 and 2029
- Exhibits33: Bargaining power of suppliers - Impact of key factors in 2024 and 2029
- Exhibits34: Threat of new entrants - Impact of key factors in 2024 and 2029
- Exhibits35: Threat of substitutes - Impact of key factors in 2024 and 2029
- Exhibits36: Threat of rivalry - Impact of key factors in 2024 and 2029
- Exhibits37: Chart on Market condition - Five forces 2024 and 2029
- Exhibits38: Chart on Solution - Market share 2024-2029 (%)
- Exhibits39: Data Table on Solution - Market share 2024-2029 (%)
- Exhibits40: Chart on Comparison by Solution
- Exhibits41: Data Table on Comparison by Solution
- Exhibits42: Chart on Traffic monitoring system - Market size and forecast 2024-2029 ($ million)
- Exhibits43: Data Table on Traffic monitoring system - Market size and forecast 2024-2029 ($ million)
- Exhibits44: Chart on Traffic monitoring system - Year-over-year growth 2024-2029 (%)
- Exhibits45: Data Table on Traffic monitoring system - Year-over-year growth 2024-2029 (%)
- Exhibits46: Chart on Traffic signal control system - Market size and forecast 2024-2029 ($ million)
- Exhibits47: Data Table on Traffic signal control system - Market size and forecast 2024-2029 ($ million)
- Exhibits48: Chart on Traffic signal control system - Year-over-year growth 2024-2029 (%)
- Exhibits49: Data Table on Traffic signal control system - Year-over-year growth 2024-2029 (%)
- Exhibits50: Chart on Traffic enforcement camera - Market size and forecast 2024-2029 ($ million)
- Exhibits51: Data Table on Traffic enforcement camera - Market size and forecast 2024-2029 ($ million)
- Exhibits52: Chart on Traffic enforcement camera - Year-over-year growth 2024-2029 (%)
- Exhibits53: Data Table on Traffic enforcement camera - Year-over-year growth 2024-2029 (%)
- Exhibits54: Chart on Integrated corridor management - Market size and forecast 2024-2029 ($ million)
- Exhibits55: Data Table on Integrated corridor management - Market size and forecast 2024-2029 ($ million)
- Exhibits56: Chart on Integrated corridor management - Year-over-year growth 2024-2029 (%)
- Exhibits57: Data Table on Integrated corridor management - Year-over-year growth 2024-2029 (%)
- Exhibits58: Chart on Others - Market size and forecast 2024-2029 ($ million)
- Exhibits59: Data Table on Others - Market size and forecast 2024-2029 ($ million)
- Exhibits60: Chart on Others - Year-over-year growth 2024-2029 (%)
- Exhibits61: Data Table on Others - Year-over-year growth 2024-2029 (%)
- Exhibits62: Market opportunity by Solution ($ million)
- Exhibits63: Data Table on Market opportunity by Solution ($ million)
- Exhibits64: Chart on Component - Market share 2024-2029 (%)
- Exhibits65: Data Table on Component - Market share 2024-2029 (%)
- Exhibits66: Chart on Comparison by Component
- Exhibits67: Data Table on Comparison by Component
- Exhibits68: Chart on Surveillance cameras - Market size and forecast 2024-2029 ($ million)
- Exhibits69: Data Table on Surveillance cameras - Market size and forecast 2024-2029 ($ million)
- Exhibits70: Chart on Surveillance cameras - Year-over-year growth 2024-2029 (%)
- Exhibits71: Data Table on Surveillance cameras - Year-over-year growth 2024-2029 (%)
- Exhibits72: Chart on Video walls - Market size and forecast 2024-2029 ($ million)
- Exhibits73: Data Table on Video walls - Market size and forecast 2024-2029 ($ million)
- Exhibits74: Chart on Video walls - Year-over-year growth 2024-2029 (%)
- Exhibits75: Data Table on Video walls - Year-over-year growth 2024-2029 (%)
- Exhibits76: Chart on Traffic controllers and signals - Market size and forecast 2024-2029 ($ million)
- Exhibits77: Data Table on Traffic controllers and signals - Market size and forecast 2024-2029 ($ million)
- Exhibits78: Chart on Traffic controllers and signals - Year-over-year growth 2024-2029 (%)
- Exhibits79: Data Table on Traffic controllers and signals - Year-over-year growth 2024-2029 (%)
- Exhibits80: Chart on Others - Market size and forecast 2024-2029 ($ million)
- Exhibits81: Data Table on Others - Market size and forecast 2024-2029 ($ million)
- Exhibits82: Chart on Others - Year-over-year growth 2024-2029 (%)
- Exhibits83: Data Table on Others - Year-over-year growth 2024-2029 (%)
- Exhibits84: Market opportunity by Component ($ million)
- Exhibits85: Data Table on Market opportunity by Component ($ million)
- Exhibits86: Chart on End-user - Market share 2024-2029 (%)
- Exhibits87: Data Table on End-user - Market share 2024-2029 (%)
- Exhibits88: Chart on Comparison by End-user
- Exhibits89: Data Table on Comparison by End-user
- Exhibits90: Chart on Government authorities - Market size and forecast 2024-2029 ($ million)
- Exhibits91: Data Table on Government authorities - Market size and forecast 2024-2029 ($ million)
- Exhibits92: Chart on Government authorities - Year-over-year growth 2024-2029 (%)
- Exhibits93: Data Table on Government authorities - Year-over-year growth 2024-2029 (%)
- Exhibits94: Chart on Transport agencies - Market size and forecast 2024-2029 ($ million)
- Exhibits95: Data Table on Transport agencies - Market size and forecast 2024-2029 ($ million)
- Exhibits96: Chart on Transport agencies - Year-over-year growth 2024-2029 (%)
- Exhibits97: Data Table on Transport agencies - Year-over-year growth 2024-2029 (%)
- Exhibits98: Chart on Commercial - Market size and forecast 2024-2029 ($ million)
- Exhibits99: Data Table on Commercial - Market size and forecast 2024-2029 ($ million)
- Exhibits100: Chart on Commercial - Year-over-year growth 2024-2029 (%)
- Exhibits101: Data Table on Commercial - Year-over-year growth 2024-2029 (%)
- Exhibits102: Market opportunity by End-user ($ million)
- Exhibits103: Data Table on Market opportunity by End-user ($ million)
- Exhibits104: Analysis of price sensitivity, lifecycle, customer purchase basket, adoption rates, and purchase criteria
- Exhibits105: Chart on Market share By Geographical Landscape 2024-2029 (%)
- Exhibits106: Data Table on Market share By Geographical Landscape 2024-2029 (%)
- Exhibits107: Chart on Geographic comparison
- Exhibits108: Data Table on Geographic comparison
- Exhibits109: Chart on North America - Market size and forecast 2024-2029 ($ million)
- Exhibits110: Data Table on North America - Market size and forecast 2024-2029 ($ million)
- Exhibits111: Chart on North America - Year-over-year growth 2024-2029 (%)
- Exhibits112: Data Table on North America - Year-over-year growth 2024-2029 (%)
- Exhibits113: Chart on Europe - Market size and forecast 2024-2029 ($ million)
- Exhibits114: Data Table on Europe - Market size and forecast 2024-2029 ($ million)
- Exhibits115: Chart on Europe - Year-over-year growth 2024-2029 (%)
- Exhibits116: Data Table on Europe - Year-over-year growth 2024-2029 (%)
- Exhibits117: Chart on APAC - Market size and forecast 2024-2029 ($ million)
- Exhibits118: Data Table on APAC - Market size and forecast 2024-2029 ($ million)
- Exhibits119: Chart on APAC - Year-over-year growth 2024-2029 (%)
- Exhibits120: Data Table on APAC - Year-over-year growth 2024-2029 (%)
- Exhibits121: Chart on South America - Market size and forecast 2024-2029 ($ million)
- Exhibits122: Data Table on South America - Market size and forecast 2024-2029 ($ million)
- Exhibits123: Chart on South America - Year-over-year growth 2024-2029 (%)
- Exhibits124: Data Table on South America - Year-over-year growth 2024-2029 (%)
- Exhibits125: Chart on Middle East and Africa - Market size and forecast 2024-2029 ($ million)
- Exhibits126: Data Table on Middle East and Africa - Market size and forecast 2024-2029 ($ million)
- Exhibits127: Chart on Middle East and Africa - Year-over-year growth 2024-2029 (%)
- Exhibits128: Data Table on Middle East and Africa - Year-over-year growth 2024-2029 (%)
- Exhibits129: Chart on US - Market size and forecast 2024-2029 ($ million)
- Exhibits130: Data Table on US - Market size and forecast 2024-2029 ($ million)
- Exhibits131: Chart on US - Year-over-year growth 2024-2029 (%)
- Exhibits132: Data Table on US - Year-over-year growth 2024-2029 (%)
- Exhibits133: Chart on China - Market size and forecast 2024-2029 ($ million)
- Exhibits134: Data Table on China - Market size and forecast 2024-2029 ($ million)
- Exhibits135: Chart on China - Year-over-year growth 2024-2029 (%)
- Exhibits136: Data Table on China - Year-over-year growth 2024-2029 (%)
- Exhibits137: Chart on UK - Market size and forecast 2024-2029 ($ million)
- Exhibits138: Data Table on UK - Market size and forecast 2024-2029 ($ million)
- Exhibits139: Chart on UK - Year-over-year growth 2024-2029 (%)
- Exhibits140: Data Table on UK - Year-over-year growth 2024-2029 (%)
- Exhibits141: Chart on Canada - Market size and forecast 2024-2029 ($ million)
- Exhibits142: Data Table on Canada - Market size and forecast 2024-2029 ($ million)
- Exhibits143: Chart on Canada - Year-over-year growth 2024-2029 (%)
- Exhibits144: Data Table on Canada - Year-over-year growth 2024-2029 (%)
- Exhibits145: Chart on Japan - Market size and forecast 2024-2029 ($ million)
- Exhibits146: Data Table on Japan - Market size and forecast 2024-2029 ($ million)
- Exhibits147: Chart on Japan - Year-over-year growth 2024-2029 (%)
- Exhibits148: Data Table on Japan - Year-over-year growth 2024-2029 (%)
- Exhibits149: Chart on Germany - Market size and forecast 2024-2029 ($ million)
- Exhibits150: Data Table on Germany - Market size and forecast 2024-2029 ($ million)
- Exhibits151: Chart on Germany - Year-over-year growth 2024-2029 (%)
- Exhibits152: Data Table on Germany - Year-over-year growth 2024-2029 (%)
- Exhibits153: Chart on France - Market size and forecast 2024-2029 ($ million)
- Exhibits154: Data Table on France - Market size and forecast 2024-2029 ($ million)
- Exhibits155: Chart on France - Year-over-year growth 2024-2029 (%)
- Exhibits156: Data Table on France - Year-over-year growth 2024-2029 (%)
- Exhibits157: Chart on India - Market size and forecast 2024-2029 ($ million)
- Exhibits158: Data Table on India - Market size and forecast 2024-2029 ($ million)
- Exhibits159: Chart on India - Year-over-year growth 2024-2029 (%)
- Exhibits160: Data Table on India - Year-over-year growth 2024-2029 (%)
- Exhibits161: Chart on Italy - Market size and forecast 2024-2029 ($ million)
- Exhibits162: Data Table on Italy - Market size and forecast 2024-2029 ($ million)
- Exhibits163: Chart on Italy - Year-over-year growth 2024-2029 (%)
- Exhibits164: Data Table on Italy - Year-over-year growth 2024-2029 (%)
- Exhibits165: Chart on South Korea - Market size and forecast 2024-2029 ($ million)
- Exhibits166: Data Table on South Korea - Market size and forecast 2024-2029 ($ million)
- Exhibits167: Chart on South Korea - Year-over-year growth 2024-2029 (%)
- Exhibits168: Data Table on South Korea - Year-over-year growth 2024-2029 (%)
- Exhibits169: Market opportunity By Geographical Landscape ($ million)
- Exhibits170: Data Tables on Market opportunity By Geographical Landscape ($ million)
- Exhibits171: Impact of drivers and challenges in 2024 and 2029
- Exhibits172: Overview on criticality of inputs and factors of differentiation
- Exhibits173: Overview on factors of disruption
- Exhibits174: Impact of key risks on business
- Exhibits175: Companies covered
- Exhibits176: Company ranking index
- Exhibits177: Matrix on companies position and classification
- Exhibits178: Chevron Traffic Management - Overview
- Exhibits179: Chevron Traffic Management - Product / Service
- Exhibits180: Chevron Traffic Management - Key offerings
- Exhibits181: SWOT
- Exhibits182: Cisco Systems Inc. - Overview
- Exhibits183: Cisco Systems Inc. - Business segments
- Exhibits184: Cisco Systems Inc. - Key news
- Exhibits185: Cisco Systems Inc. - Key offerings
- Exhibits186: Cisco Systems Inc. - Segment focus
- Exhibits187: SWOT
- Exhibits188: Cubic Corp. - Overview
- Exhibits189: Cubic Corp. - Product / Service
- Exhibits190: Cubic Corp. - Key offerings
- Exhibits191: SWOT
- Exhibits192: Huawei Technologies Co. Ltd. - Overview
- Exhibits193: Huawei Technologies Co. Ltd. - Product / Service
- Exhibits194: Huawei Technologies Co. Ltd. - Key news
- Exhibits195: Huawei Technologies Co. Ltd. - Key offerings
- Exhibits196: SWOT
- Exhibits197: INRIX Inc. - Overview
- Exhibits198: INRIX Inc. - Product / Service
- Exhibits199: INRIX Inc. - Key offerings
- Exhibits200: SWOT
- Exhibits201: International Business Machines Corp. - Overview
- Exhibits202: International Business Machines Corp. - Business segments
- Exhibits203: International Business Machines Corp. - Key news
- Exhibits204: International Business Machines Corp. - Key offerings
- Exhibits205: International Business Machines Corp. - Segment focus
- Exhibits206: SWOT
- Exhibits207: Kapsch TrafficCom AG - Overview
- Exhibits208: Kapsch TrafficCom AG - Business segments
- Exhibits209: Kapsch TrafficCom AG - Key news
- Exhibits210: Kapsch TrafficCom AG - Key offerings
- Exhibits211: Kapsch TrafficCom AG - Segment focus
- Exhibits212: SWOT
- Exhibits213: PTV Planung Transport Verkehr AG - Overview
- Exhibits214: PTV Planung Transport Verkehr AG - Product / Service
- Exhibits215: PTV Planung Transport Verkehr AG - Key offerings
- Exhibits216: SWOT
- Exhibits217: Q Free ASA - Overview
- Exhibits218: Q Free ASA - Product / Service
- Exhibits219: Q Free ASA - Key offerings
- Exhibits220: SWOT
- Exhibits221: Rekor Systems Inc. - Overview
- Exhibits222: Rekor Systems Inc. - Product / Service
- Exhibits223: Rekor Systems Inc. - Key offerings
- Exhibits224: SWOT
- Exhibits225: Siemens AG - Overview
- Exhibits226: Siemens AG - Business segments
- Exhibits227: Siemens AG - Key news
- Exhibits228: Siemens AG - Key offerings
- Exhibits229: Siemens AG - Segment focus
- Exhibits230: SWOT
- Exhibits231: SNC Lavalin Group Inc. - Overview
- Exhibits232: SNC Lavalin Group Inc. - Business segments
- Exhibits233: SNC Lavalin Group Inc. - Key offerings
- Exhibits234: SNC Lavalin Group Inc. - Segment focus
- Exhibits235: SWOT
- Exhibits236: SWARCO AG - Overview
- Exhibits237: SWARCO AG - Product / Service
- Exhibits238: SWARCO AG - Key offerings
- Exhibits239: SWOT
- Exhibits240: TagMaster AB - Overview
- Exhibits241: TagMaster AB - Business segments
- Exhibits242: TagMaster AB - Key offerings
- Exhibits243: TagMaster AB - Segment focus
- Exhibits244: SWOT
- Exhibits245: TransCore - Overview
- Exhibits246: TransCore - Product / Service
- Exhibits247: TransCore - Key offerings
- Exhibits248: SWOT
- Exhibits249: Inclusions checklist
- Exhibits250: Exclusions checklist
- Exhibits251: Currency conversion rates for US$
- Exhibits252: Research methodology
- Exhibits253: Information sources
- Exhibits254: Data validation
- Exhibits255: Validation techniques employed for market sizing
- Exhibits256: Data synthesis
- Exhibits257: 360 degree market analysis
- Exhibits258: List of abbreviations
The intelligent traffic management market is forecasted to grow by USD 24014.6 mn during 2024-2029, accelerating at a CAGR of 14.8% during the forecast period. The report on the intelligent traffic management market provides a holistic analysis, market size and forecast, trends, growth drivers, and challenges, as well as vendor analysis covering around 25 vendors.
The report offers an up-to-date analysis regarding the current market scenario, the latest trends and drivers, and the overall market environment. The market is driven by increasing demand for ai-based smart traffic solutions, increasing investment in smart cities by governments, and increasing efficiency of traffic flow management.
| Market Scope | |
|---|---|
| Base Year | 2025 |
| End Year | 2029 |
| Series Year | 2025-2029 |
| Growth Momentum | Accelerate |
| YOY 2025 | 12.6% |
| CAGR | 14.8% |
| Incremental Value | $24014.6 mn |
The study was conducted using an objective combination of primary and secondary information including inputs from key participants in the industry. The report contains a comprehensive market size data, segment with regional analysis and vendor landscape in addition to an analysis of the key companies. Reports have historic and forecast data.
Technavio's intelligent traffic management market is segmented as below:
By Solution
- Traffic monitoring system
- Traffic signal control system
- Traffic enforcement camera
- Integrated corridor management
- Others
By Component
- Surveillance cameras
- Video walls
- Traffic controllers and signals
- Others
By End-user
- Government authorities
- Transport agencies
- Commercial
By Geographical Landscape
- North America
- Europe
- APAC
- South America
- Middle East and Africa
This study identifies the increasing number of vehicles on road as one of the prime reasons driving the intelligent traffic management market growth during the next few years. Also, rapid urbanization and effective government initiatives will lead to sizable demand in the market.
The report on the intelligent traffic management market covers the following areas:
- Intelligent Traffic Management Market sizing
- Intelligent Traffic Management Market forecast
- Intelligent Traffic Management Market industry analysis
The robust vendor analysis is designed to help clients improve their market position, and in line with this, this report provides a detailed analysis of several leading intelligent traffic management market vendors that include Chevron Traffic Management, Cisco Systems Inc., Cubic Corp., Huawei Technologies Co. Ltd., INRIX Inc., International Business Machines Corp., Kapsch TrafficCom AG, Light Crossing Technology Corp., PTV Planung Transport Verkehr AG, Q Free ASA, Rekor Systems Inc., Siemens AG, SNC Lavalin Group Inc., SWARCO AG, TagMaster AB, Teledyne Technologies Inc., Telegra d.o.o., Thales Group, TomTom NV, and TransCore. Also, the intelligent traffic management market analysis report includes information on upcoming trends and challenges that will influence market growth. This is to help companies strategize and leverage all forthcoming growth opportunities.
The publisher presents a detailed picture of the market by the way of study, synthesis, and summation of data from multiple sources by an analysis of key parameters such as profit, pricing, competition, and promotions. It presents various market facets by identifying the key industry influencers. The data presented is comprehensive, reliable, and a result of extensive primary and secondary research. The market research reports provide a complete competitive landscape and an in-depth vendor selection methodology and analysis using qualitative and quantitative research to forecast accurate market growth.
Table of Contents
1 Executive Summary
- 1.1 Market overview
- Executive Summary - Chart on Market Overview
- Executive Summary - Data Table on Market Overview
- Executive Summary - Chart on Global Market Characteristics
- Executive Summary - Chart on Market By Geographical Landscape
- Executive Summary - Chart on Market Segmentation by Solution
- Executive Summary - Chart on Market Segmentation by Component
- Executive Summary - Chart on Market Segmentation by End-user
- Executive Summary - Chart on Incremental Growth
- Executive Summary - Data Table on Incremental Growth
- Executive Summary - Chart on Company Market Positioning
2 Technavio Analysis
- 2.1 Analysis of price sensitivity, lifecycle, customer purchase basket, adoption rates, and purchase criteria
- Analysis of price sensitivity, lifecycle, customer purchase basket, adoption rates, and purchase criteria
- 2.2 Criticality of inputs and Factors of differentiation
- Overview on criticality of inputs and factors of differentiation
- 2.3 Factors of disruption
- Overview on factors of disruption
- 2.4 Impact of drivers and challenges
- Impact of drivers and challenges in 2024 and 2029
3 Market Landscape
- 3.1 Market ecosystem
- Parent Market
- Data Table on - Parent Market
- 3.2 Market characteristics
- Market characteristics analysis
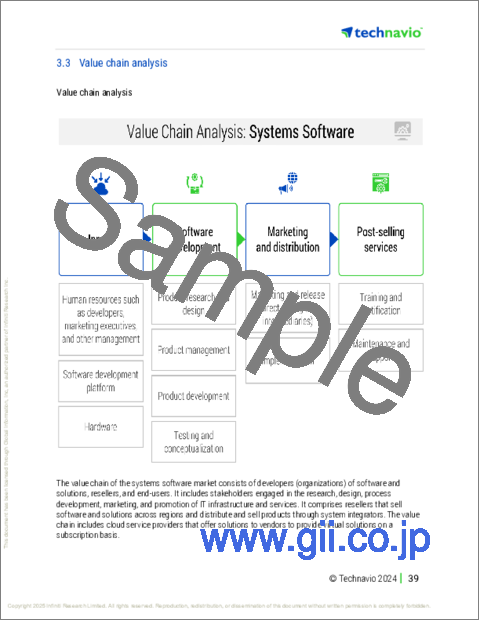
- 3.3 Value chain analysis
- Value chain analysis
4 Market Sizing
- 4.1 Market definition
- Offerings of companies included in the market definition
- 4.2 Market segment analysis
- Market segments
- 4.3 Market size 2024
- 4.4 Market outlook: Forecast for 2024-2029
- Chart on Global - Market size and forecast 2024-2029 ($ million)
- Data Table on Global - Market size and forecast 2024-2029 ($ million)
- Chart on Global Market: Year-over-year growth 2024-2029 (%)
- Data Table on Global Market: Year-over-year growth 2024-2029 (%)
5 Historic Market Size
- 5.1 Global Intelligent Traffic Management Market 2019 - 2023
- Historic Market Size - Data Table on Global Intelligent Traffic Management Market 2019 - 2023 ($ million)
- 5.2 Solution segment analysis 2019 - 2023
- Historic Market Size - Solution Segment 2019 - 2023 ($ million)
- 5.3 Component segment analysis 2019 - 2023
- Historic Market Size - Component Segment 2019 - 2023 ($ million)
- 5.4 End-user segment analysis 2019 - 2023
- Historic Market Size - End-user Segment 2019 - 2023 ($ million)
- 5.5 Geography segment analysis 2019 - 2023
- Historic Market Size - Geography Segment 2019 - 2023 ($ million)
- 5.6 Country segment analysis 2019 - 2023
- Historic Market Size - Country Segment 2019 - 2023 ($ million)
6 Qualitative Analysis
- 6.1 Impact of AI on global intelligent traffic management market
7 Five Forces Analysis
- 7.1 Five forces summary
- Five forces analysis - Comparison between 2024 and 2029
- 7.2 Bargaining power of buyers
- Bargaining power of buyers - Impact of key factors 2024 and 2029
- 7.3 Bargaining power of suppliers
- Bargaining power of suppliers - Impact of key factors in 2024 and 2029
- 7.4 Threat of new entrants
- Threat of new entrants - Impact of key factors in 2024 and 2029
- 7.5 Threat of substitutes
- Threat of substitutes - Impact of key factors in 2024 and 2029
- 7.6 Threat of rivalry
- Threat of rivalry - Impact of key factors in 2024 and 2029
- 7.7 Market condition
- Chart on Market condition - Five forces 2024 and 2029
8 Market Segmentation by Solution
- 8.1 Market segments
- Chart on Solution - Market share 2024-2029 (%)
- Data Table on Solution - Market share 2024-2029 (%)
- 8.2 Comparison by Solution
- Chart on Comparison by Solution
- Data Table on Comparison by Solution
- 8.3 Traffic monitoring system - Market size and forecast 2024-2029
- Chart on Traffic monitoring system - Market size and forecast 2024-2029 ($ million)
- Data Table on Traffic monitoring system - Market size and forecast 2024-2029 ($ million)
- Chart on Traffic monitoring system - Year-over-year growth 2024-2029 (%)
- Data Table on Traffic monitoring system - Year-over-year growth 2024-2029 (%)
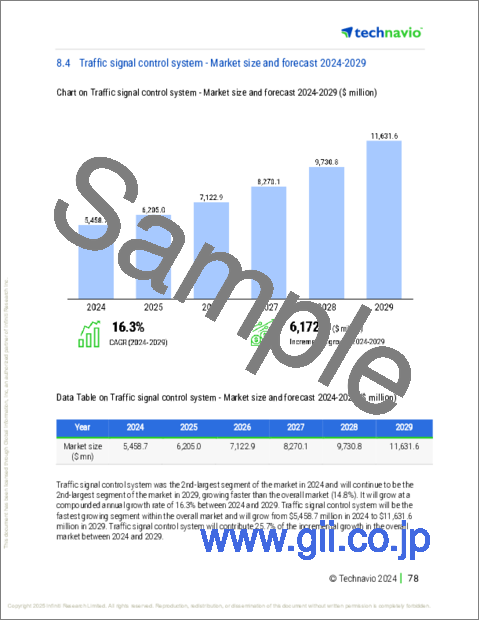
- 8.4 Traffic signal control system - Market size and forecast 2024-2029
- Chart on Traffic signal control system - Market size and forecast 2024-2029 ($ million)
- Data Table on Traffic signal control system - Market size and forecast 2024-2029 ($ million)
- Chart on Traffic signal control system - Year-over-year growth 2024-2029 (%)
- Data Table on Traffic signal control system - Year-over-year growth 2024-2029 (%)
- 8.5 Traffic enforcement camera - Market size and forecast 2024-2029
- Chart on Traffic enforcement camera - Market size and forecast 2024-2029 ($ million)
- Data Table on Traffic enforcement camera - Market size and forecast 2024-2029 ($ million)
- Chart on Traffic enforcement camera - Year-over-year growth 2024-2029 (%)
- Data Table on Traffic enforcement camera - Year-over-year growth 2024-2029 (%)
- 8.6 Integrated corridor management - Market size and forecast 2024-2029
- Chart on Integrated corridor management - Market size and forecast 2024-2029 ($ million)
- Data Table on Integrated corridor management - Market size and forecast 2024-2029 ($ million)
- Chart on Integrated corridor management - Year-over-year growth 2024-2029 (%)
- Data Table on Integrated corridor management - Year-over-year growth 2024-2029 (%)
- 8.7 Others - Market size and forecast 2024-2029
- Chart on Others - Market size and forecast 2024-2029 ($ million)
- Data Table on Others - Market size and forecast 2024-2029 ($ million)
- Chart on Others - Year-over-year growth 2024-2029 (%)
- Data Table on Others - Year-over-year growth 2024-2029 (%)
- 8.8 Market opportunity by Solution
- Market opportunity by Solution ($ million)
- Data Table on Market opportunity by Solution ($ million)
9 Market Segmentation by Component
- 9.1 Market segments
- Chart on Component - Market share 2024-2029 (%)
- Data Table on Component - Market share 2024-2029 (%)
- 9.2 Comparison by Component
- Chart on Comparison by Component
- Data Table on Comparison by Component
- 9.3 Surveillance cameras - Market size and forecast 2024-2029
- Chart on Surveillance cameras - Market size and forecast 2024-2029 ($ million)
- Data Table on Surveillance cameras - Market size and forecast 2024-2029 ($ million)
- Chart on Surveillance cameras - Year-over-year growth 2024-2029 (%)
- Data Table on Surveillance cameras - Year-over-year growth 2024-2029 (%)
- 9.4 Video walls - Market size and forecast 2024-2029
- Chart on Video walls - Market size and forecast 2024-2029 ($ million)
- Data Table on Video walls - Market size and forecast 2024-2029 ($ million)
- Chart on Video walls - Year-over-year growth 2024-2029 (%)
- Data Table on Video walls - Year-over-year growth 2024-2029 (%)
- 9.5 Traffic controllers and signals - Market size and forecast 2024-2029
- Chart on Traffic controllers and signals - Market size and forecast 2024-2029 ($ million)
- Data Table on Traffic controllers and signals - Market size and forecast 2024-2029 ($ million)
- Chart on Traffic controllers and signals - Year-over-year growth 2024-2029 (%)
- Data Table on Traffic controllers and signals - Year-over-year growth 2024-2029 (%)
- 9.6 Others - Market size and forecast 2024-2029
- Chart on Others - Market size and forecast 2024-2029 ($ million)
- Data Table on Others - Market size and forecast 2024-2029 ($ million)
- Chart on Others - Year-over-year growth 2024-2029 (%)
- Data Table on Others - Year-over-year growth 2024-2029 (%)
- 9.7 Market opportunity by Component
- Market opportunity by Component ($ million)
- Data Table on Market opportunity by Component ($ million)
10 Market Segmentation by End-user
- 10.1 Market segments
- Chart on End-user - Market share 2024-2029 (%)
- Data Table on End-user - Market share 2024-2029 (%)
- 10.2 Comparison by End-user
- Chart on Comparison by End-user
- Data Table on Comparison by End-user
- 10.3 Government authorities - Market size and forecast 2024-2029
- Chart on Government authorities - Market size and forecast 2024-2029 ($ million)
- Data Table on Government authorities - Market size and forecast 2024-2029 ($ million)
- Chart on Government authorities - Year-over-year growth 2024-2029 (%)
- Data Table on Government authorities - Year-over-year growth 2024-2029 (%)
- 10.4 Transport agencies - Market size and forecast 2024-2029
- Chart on Transport agencies - Market size and forecast 2024-2029 ($ million)
- Data Table on Transport agencies - Market size and forecast 2024-2029 ($ million)
- Chart on Transport agencies - Year-over-year growth 2024-2029 (%)
- Data Table on Transport agencies - Year-over-year growth 2024-2029 (%)
- 10.5 Commercial - Market size and forecast 2024-2029
- Chart on Commercial - Market size and forecast 2024-2029 ($ million)
- Data Table on Commercial - Market size and forecast 2024-2029 ($ million)
- Chart on Commercial - Year-over-year growth 2024-2029 (%)
- Data Table on Commercial - Year-over-year growth 2024-2029 (%)
- 10.6 Market opportunity by End-user
- Market opportunity by End-user ($ million)
- Data Table on Market opportunity by End-user ($ million)
11 Customer Landscape
- 11.1 Customer landscape overview
- Analysis of price sensitivity, lifecycle, customer purchase basket, adoption rates, and purchase criteria
12 Geographic Landscape
- 12.1 Geographic segmentation
- Chart on Market share By Geographical Landscape 2024-2029 (%)
- Data Table on Market share By Geographical Landscape 2024-2029 (%)
- 12.2 Geographic comparison
- Chart on Geographic comparison
- Data Table on Geographic comparison
- 12.3 North America - Market size and forecast 2024-2029
- Chart on North America - Market size and forecast 2024-2029 ($ million)
- Data Table on North America - Market size and forecast 2024-2029 ($ million)
- Chart on North America - Year-over-year growth 2024-2029 (%)
- Data Table on North America - Year-over-year growth 2024-2029 (%)
- 12.4 Europe - Market size and forecast 2024-2029
- Chart on Europe - Market size and forecast 2024-2029 ($ million)
- Data Table on Europe - Market size and forecast 2024-2029 ($ million)
- Chart on Europe - Year-over-year growth 2024-2029 (%)
- Data Table on Europe - Year-over-year growth 2024-2029 (%)
- 12.5 APAC - Market size and forecast 2024-2029
- Chart on APAC - Market size and forecast 2024-2029 ($ million)
- Data Table on APAC - Market size and forecast 2024-2029 ($ million)
- Chart on APAC - Year-over-year growth 2024-2029 (%)
- Data Table on APAC - Year-over-year growth 2024-2029 (%)
- 12.6 South America - Market size and forecast 2024-2029
- Chart on South America - Market size and forecast 2024-2029 ($ million)
- Data Table on South America - Market size and forecast 2024-2029 ($ million)
- Chart on South America - Year-over-year growth 2024-2029 (%)
- Data Table on South America - Year-over-year growth 2024-2029 (%)
- 12.7 Middle East and Africa - Market size and forecast 2024-2029
- Chart on Middle East and Africa - Market size and forecast 2024-2029 ($ million)
- Data Table on Middle East and Africa - Market size and forecast 2024-2029 ($ million)
- Chart on Middle East and Africa - Year-over-year growth 2024-2029 (%)
- Data Table on Middle East and Africa - Year-over-year growth 2024-2029 (%)
- 12.8 US - Market size and forecast 2024-2029
- Chart on US - Market size and forecast 2024-2029 ($ million)
- Data Table on US - Market size and forecast 2024-2029 ($ million)
- Chart on US - Year-over-year growth 2024-2029 (%)
- Data Table on US - Year-over-year growth 2024-2029 (%)
- 12.9 China - Market size and forecast 2024-2029
- Chart on China - Market size and forecast 2024-2029 ($ million)
- Data Table on China - Market size and forecast 2024-2029 ($ million)
- Chart on China - Year-over-year growth 2024-2029 (%)
- Data Table on China - Year-over-year growth 2024-2029 (%)
- 12.10 UK - Market size and forecast 2024-2029
- Chart on UK - Market size and forecast 2024-2029 ($ million)
- Data Table on UK - Market size and forecast 2024-2029 ($ million)
- Chart on UK - Year-over-year growth 2024-2029 (%)
- Data Table on UK - Year-over-year growth 2024-2029 (%)
- 12.11 Canada - Market size and forecast 2024-2029
- Chart on Canada - Market size and forecast 2024-2029 ($ million)
- Data Table on Canada - Market size and forecast 2024-2029 ($ million)
- Chart on Canada - Year-over-year growth 2024-2029 (%)
- Data Table on Canada - Year-over-year growth 2024-2029 (%)
- 12.12 Japan - Market size and forecast 2024-2029
- Chart on Japan - Market size and forecast 2024-2029 ($ million)
- Data Table on Japan - Market size and forecast 2024-2029 ($ million)
- Chart on Japan - Year-over-year growth 2024-2029 (%)
- Data Table on Japan - Year-over-year growth 2024-2029 (%)
- 12.13 Germany - Market size and forecast 2024-2029
- Chart on Germany - Market size and forecast 2024-2029 ($ million)
- Data Table on Germany - Market size and forecast 2024-2029 ($ million)
- Chart on Germany - Year-over-year growth 2024-2029 (%)
- Data Table on Germany - Year-over-year growth 2024-2029 (%)
- 12.14 France - Market size and forecast 2024-2029
- Chart on France - Market size and forecast 2024-2029 ($ million)
- Data Table on France - Market size and forecast 2024-2029 ($ million)
- Chart on France - Year-over-year growth 2024-2029 (%)
- Data Table on France - Year-over-year growth 2024-2029 (%)
- 12.15 India - Market size and forecast 2024-2029
- Chart on India - Market size and forecast 2024-2029 ($ million)
- Data Table on India - Market size and forecast 2024-2029 ($ million)
- Chart on India - Year-over-year growth 2024-2029 (%)
- Data Table on India - Year-over-year growth 2024-2029 (%)
- 12.16 Italy - Market size and forecast 2024-2029
- Chart on Italy - Market size and forecast 2024-2029 ($ million)
- Data Table on Italy - Market size and forecast 2024-2029 ($ million)
- Chart on Italy - Year-over-year growth 2024-2029 (%)
- Data Table on Italy - Year-over-year growth 2024-2029 (%)
- 12.17 South Korea - Market size and forecast 2024-2029
- Chart on South Korea - Market size and forecast 2024-2029 ($ million)
- Data Table on South Korea - Market size and forecast 2024-2029 ($ million)
- Chart on South Korea - Year-over-year growth 2024-2029 (%)
- Data Table on South Korea - Year-over-year growth 2024-2029 (%)
- 12.18 Market opportunity By Geographical Landscape
- Market opportunity By Geographical Landscape ($ million)
- Data Tables on Market opportunity By Geographical Landscape ($ million)
13 Drivers, Challenges, and Opportunity/Restraints
- 13.1 Market drivers
- 13.2 Market challenges
- 13.3 Impact of drivers and challenges
- Impact of drivers and challenges in 2024 and 2029
- 13.4 Market opportunities/restraints
14 Competitive Landscape
- 14.1 Overview
- 14.2 Competitive Landscape
- Overview on criticality of inputs and factors of differentiation
- 14.3 Landscape disruption
- Overview on factors of disruption
- 14.4 Industry risks
- Impact of key risks on business
15 Competitive Analysis
- 15.1 Companies profiled
- Companies covered
- 15.2 Company ranking index
- Company ranking index
- 15.3 Market positioning of companies
- Matrix on companies position and classification
- 15.4 Chevron Traffic Management
- Chevron Traffic Management - Overview
- Chevron Traffic Management - Product / Service
- Chevron Traffic Management - Key offerings
- SWOT
- 15.5 Cisco Systems Inc.
- Cisco Systems Inc. - Overview
- Cisco Systems Inc. - Business segments
- Cisco Systems Inc. - Key news
- Cisco Systems Inc. - Key offerings
- Cisco Systems Inc. - Segment focus
- SWOT
- 15.6 Cubic Corp.
- Cubic Corp. - Overview
- Cubic Corp. - Product / Service
- Cubic Corp. - Key offerings
- SWOT
- 15.7 Huawei Technologies Co. Ltd.
- Huawei Technologies Co. Ltd. - Overview
- Huawei Technologies Co. Ltd. - Product / Service
- Huawei Technologies Co. Ltd. - Key news
- Huawei Technologies Co. Ltd. - Key offerings
- SWOT
- 15.8 INRIX Inc.
- INRIX Inc. - Overview
- INRIX Inc. - Product / Service
- INRIX Inc. - Key offerings
- SWOT
- 15.9 International Business Machines Corp.
- International Business Machines Corp. - Overview
- International Business Machines Corp. - Business segments
- International Business Machines Corp. - Key news
- International Business Machines Corp. - Key offerings
- International Business Machines Corp. - Segment focus
- SWOT
- 15.10 Kapsch TrafficCom AG
- Kapsch TrafficCom AG - Overview
- Kapsch TrafficCom AG - Business segments
- Kapsch TrafficCom AG - Key news
- Kapsch TrafficCom AG - Key offerings
- Kapsch TrafficCom AG - Segment focus
- SWOT
- 15.11 PTV Planung Transport Verkehr AG
- PTV Planung Transport Verkehr AG - Overview
- PTV Planung Transport Verkehr AG - Product / Service
- PTV Planung Transport Verkehr AG - Key offerings
- SWOT
- 15.12 Q Free ASA
- Q Free ASA - Overview
- Q Free ASA - Product / Service
- Q Free ASA - Key offerings
- SWOT
- 15.13 Rekor Systems Inc.
- Rekor Systems Inc. - Overview
- Rekor Systems Inc. - Product / Service
- Rekor Systems Inc. - Key offerings
- SWOT
- 15.14 Siemens AG
- Siemens AG - Overview
- Siemens AG - Business segments
- Siemens AG - Key news
- Siemens AG - Key offerings
- Siemens AG - Segment focus
- SWOT
- 15.15 SNC Lavalin Group Inc.
- SNC Lavalin Group Inc. - Overview
- SNC Lavalin Group Inc. - Business segments
- SNC Lavalin Group Inc. - Key offerings
- SNC Lavalin Group Inc. - Segment focus
- SWOT
- 15.16 SWARCO AG
- SWARCO AG - Overview
- SWARCO AG - Product / Service
- SWARCO AG - Key offerings
- SWOT
- 15.17 TagMaster AB
- TagMaster AB - Overview
- TagMaster AB - Business segments
- TagMaster AB - Key offerings
- TagMaster AB - Segment focus
- SWOT
- 15.18 TransCore
- TransCore - Overview
- TransCore - Product / Service
- TransCore - Key offerings
- SWOT
16 Appendix
- 16.1 Scope of the report
- 16.2 Inclusions and exclusions checklist
- Inclusions checklist
- Exclusions checklist
- 16.3 Currency conversion rates for US$
- Currency conversion rates for US$
- 16.4 Research methodology
- Research methodology
- 16.5 Data procurement
- Information sources
- 16.6 Data validation
- Data validation
- 16.7 Validation techniques employed for market sizing
- Validation techniques employed for market sizing
- 16.8 Data synthesis
- Data synthesis
- 16.9 360 degree market analysis
- 360 degree market analysis
- 16.10 List of abbreviations
- List of abbreviations

