|
|
市場調査レポート
商品コード
1502573
直流(DC)モーターの世界市場、2024~2028年Global direct current (DC) motor market 2024-2028 |
||||||
|
|||||||
カスタマイズ可能
|
|||||||


| 直流(DC)モーターの世界市場、2024~2028年 |
|
出版日: 2024年05月20日
発行: TechNavio
ページ情報: 英文 174 Pages
納期: 即納可能
|

全表示
- 概要
- 図表
- 目次
Technavioは、直流(DC)モーター市場をモニターしており、2023~2028年にかけて253億5,510万米ドル、予測期間中のCAGRは12.66%で成長すると予測しています。
当レポートでは、直流(DC)モーター市場の全体的な分析、市場規模・予測、動向、成長促進要因、課題、約25のベンダーを網羅したベンダー分析などを掲載しています。
現在の市場シナリオ、最新動向と促進要因、市場環境全体に関する最新分析を提供しています。市場は、工場の自動化と産業用ロボットの使用の増加、耐久消費財におけるDCモーターの使用の増加、DCモーターの最近の動向によって牽引されています。
| 市場範囲 | |
|---|---|
| 基準年 | 2024年 |
| 終了年 | 2028年 |
| 予測期間 | 2024~2028年 |
| 成長モメンタム | 加速 |
| 前年比[2024年] | 10.99% |
| CAGR | 12.66% |
| 増分額 | 253億5,510万米ドル |
本調査では、センサレスBLDCモータの開拓が、今後数年間の直流(DC)モーター市場成長を牽引する主要因の1つであるとしています。また、エネルギー効率に優れたモータの使用への注目の高まりや、医療用ロボット、電気機器、自動搬送車の進歩も、市場の大きな需要につながります。
目次
第1章 エグゼクティブ概要
- 市場概要
第2章 市場情勢
- 市場エコシステム
- 市場の特徴
- バリューチェーン分析
第3章 市場規模の評価
- 市場の定義
- 市場セグメント分析
- 市場規模 2023年
- 市場の展望 2023~2028年
第4章 市場規模実績
- 世界の直流(DC)モーター市場 2018~2022年
- 出力別セグメント分析 2018~2022年
- タイプ別セグメント分析 2018~2022年
- 地域別セグメント分析 2018~2022年
- 国別セグメント分析 2018~2022年
第5章 ファイブフォース分析
- ファイブフォースの要約
- 買い手の交渉力
- 供給企業の交渉力
- 新規参入業者の脅威
- 代替品の脅威
- 競争の脅威
- 市況
第6章 市場セグメンテーション:出力別
- 市場セグメンテーション
- 比較:出力別
- 750W以下:市場規模と予測 2023~2028年
- 375kW以上:市場規模と予測 2023~2028年
- 市場機会:出力別
第7章 市場セグメンテーション:タイプ別
- 市場セグメンテーション
- 比較:タイプ別
- ブラシ付きDCモーター:市場規模と予測 2023~2028年
- ブラシレスDCモーター:市場規模と予測 2023~2028年
- 市場機会:タイプ別
第8章 顧客情勢
- 顧客情勢概要
第9章 地域別情勢
- 地域別セグメンテーション
- 比較:地域別
- アジア太平洋:市場規模と予測 2023~2028年
- 北米:市場規模と予測 2023~2028年
- 欧州:市場規模と予測 2023~2028年
- 南米:市場規模と予測 2023~2028年
- 中東・アフリカ:市場規模と予測 2023~2028年
- 中国:市場規模と予測 2023~2028年
- 米国:市場規模と予測 2023~2028年
- 日本:市場規模と予測 2023~2028年
- ドイツ:市場規模と予測 2023~2028年
- 韓国:市場規模と予測 2023~2028年
- 市場機会:地域情勢別
第10章 促進要因・課題・機会・抑制要因
- 市場促進要因
- 市場課題
- 促進要因と課題の影響
- 市場の機会・抑制要因
第11章 競合情勢
- 概要
- 競合情勢
- 混乱の状況
- 業界のリスク
第12章 競合分析
- 企業プロファイル
- 企業の市場ポジショニング
- ABB Ltd.
- Allied Motion Technologies Inc.
- AMETEK Inc.
- ASSUN MOTOR Pte Ltd.
- ElectroCraft Inc.
- Johnson Electric Holdings Ltd.
- maxon motor AG
- MinebeaMitsumi Inc.
- Nidec Corp.
- North American Electric Inc.
- OMRON Corp.
- Regal Beloit Corp.
- Schneider Electric SE
- Siemens AG
- Yaskawa Electric Corp.
第13章 付録
Exhibits:
- Exhibits1: Executive Summary - Chart on Market Overview
- Exhibits2: Executive Summary - Data Table on Market Overview
- Exhibits3: Executive Summary - Chart on Global Market Characteristics
- Exhibits4: Executive Summary - Chart on Market By Geographical Landscape
- Exhibits5: Executive Summary - Chart on Market Segmentation by Power Output
- Exhibits6: Executive Summary - Chart on Market Segmentation by Type
- Exhibits7: Executive Summary - Chart on Incremental Growth
- Exhibits8: Executive Summary - Data Table on Incremental Growth
- Exhibits9: Executive Summary - Chart on Company Market Positioning
- Exhibits10: Parent Market
- Exhibits11: Data Table on - Parent Market
- Exhibits12: Market characteristics analysis
- Exhibits13: Value Chain Analysis
- Exhibits14: Offerings of companies included in the market definition
- Exhibits15: Market segments
- Exhibits16: Chart on Global - Market size and forecast 2023-2028 ($ million)
- Exhibits17: Data Table on Global - Market size and forecast 2023-2028 ($ million)
- Exhibits18: Chart on Global Market: Year-over-year growth 2023-2028 (%)
- Exhibits19: Data Table on Global Market: Year-over-year growth 2023-2028 (%)
- Exhibits20: Historic Market Size - Data Table on Global Direct Current (DC) Motor Market 2018 - 2022 ($ million)
- Exhibits21: Historic Market Size - Power Output Segment 2018 - 2022 ($ million)
- Exhibits22: Historic Market Size - Type Segment 2018 - 2022 ($ million)
- Exhibits23: Historic Market Size - Geography Segment 2018 - 2022 ($ million)
- Exhibits24: Historic Market Size - Country Segment 2018 - 2022 ($ million)
- Exhibits25: Five forces analysis - Comparison between 2023 and 2028
- Exhibits26: Bargaining power of buyers - Impact of key factors 2023 and 2028
- Exhibits27: Bargaining power of suppliers - Impact of key factors in 2023 and 2028
- Exhibits28: Threat of new entrants - Impact of key factors in 2023 and 2028
- Exhibits29: Threat of substitutes - Impact of key factors in 2023 and 2028
- Exhibits30: Threat of rivalry - Impact of key factors in 2023 and 2028
- Exhibits31: Chart on Market condition - Five forces 2023 and 2028
- Exhibits32: Chart on Power Output - Market share 2023-2028 (%)
- Exhibits33: Data Table on Power Output - Market share 2023-2028 (%)
- Exhibits34: Chart on Comparison by Power Output
- Exhibits35: Data Table on Comparison by Power Output
- Exhibits36: Chart on Less than 750 W - Market size and forecast 2023-2028 ($ million)
- Exhibits37: Data Table on Less than 750 W - Market size and forecast 2023-2028 ($ million)
- Exhibits38: Chart on Less than 750 W - Year-over-year growth 2023-2028 (%)
- Exhibits39: Data Table on Less than 750 W - Year-over-year growth 2023-2028 (%)
- Exhibits40: Chart on 750 W to 375 kW - Market size and forecast 2023-2028 ($ million)
- Exhibits41: Data Table on 750 W to 375 kW - Market size and forecast 2023-2028 ($ million)
- Exhibits42: Chart on 750 W to 375 kW - Year-over-year growth 2023-2028 (%)
- Exhibits43: Data Table on 750 W to 375 kW - Year-over-year growth 2023-2028 (%)
- Exhibits44: Chart on More than 375 kW - Market size and forecast 2023-2028 ($ million)
- Exhibits45: Data Table on More than 375 kW - Market size and forecast 2023-2028 ($ million)
- Exhibits46: Chart on More than 375 kW - Year-over-year growth 2023-2028 (%)
- Exhibits47: Data Table on More than 375 kW - Year-over-year growth 2023-2028 (%)
- Exhibits48: Market opportunity by Power Output ($ million)
- Exhibits49: Data Table on Market opportunity by Power Output ($ million)
- Exhibits50: Chart on Type - Market share 2023-2028 (%)
- Exhibits51: Data Table on Type - Market share 2023-2028 (%)
- Exhibits52: Chart on Comparison by Type
- Exhibits53: Data Table on Comparison by Type
- Exhibits54: Chart on Brushed DC motors - Market size and forecast 2023-2028 ($ million)
- Exhibits55: Data Table on Brushed DC motors - Market size and forecast 2023-2028 ($ million)
- Exhibits56: Chart on Brushed DC motors - Year-over-year growth 2023-2028 (%)
- Exhibits57: Data Table on Brushed DC motors - Year-over-year growth 2023-2028 (%)
- Exhibits58: Chart on Brushless DC motors - Market size and forecast 2023-2028 ($ million)
- Exhibits59: Data Table on Brushless DC motors - Market size and forecast 2023-2028 ($ million)
- Exhibits60: Chart on Brushless DC motors - Year-over-year growth 2023-2028 (%)
- Exhibits61: Data Table on Brushless DC motors - Year-over-year growth 2023-2028 (%)
- Exhibits62: Market opportunity by Type ($ million)
- Exhibits63: Data Table on Market opportunity by Type ($ million)
- Exhibits64: Analysis of price sensitivity, lifecycle, customer purchase basket, adoption rates, and purchase criteria
- Exhibits65: Chart on Market share By Geographical Landscape 2023-2028 (%)
- Exhibits66: Data Table on Market share By Geographical Landscape 2023-2028 (%)
- Exhibits67: Chart on Geographic comparison
- Exhibits68: Data Table on Geographic comparison
- Exhibits69: Chart on APAC - Market size and forecast 2023-2028 ($ million)
- Exhibits70: Data Table on APAC - Market size and forecast 2023-2028 ($ million)
- Exhibits71: Chart on APAC - Year-over-year growth 2023-2028 (%)
- Exhibits72: Data Table on APAC - Year-over-year growth 2023-2028 (%)
- Exhibits73: Chart on North America - Market size and forecast 2023-2028 ($ million)
- Exhibits74: Data Table on North America - Market size and forecast 2023-2028 ($ million)
- Exhibits75: Chart on North America - Year-over-year growth 2023-2028 (%)
- Exhibits76: Data Table on North America - Year-over-year growth 2023-2028 (%)
- Exhibits77: Chart on Europe - Market size and forecast 2023-2028 ($ million)
- Exhibits78: Data Table on Europe - Market size and forecast 2023-2028 ($ million)
- Exhibits79: Chart on Europe - Year-over-year growth 2023-2028 (%)
- Exhibits80: Data Table on Europe - Year-over-year growth 2023-2028 (%)
- Exhibits81: Chart on South America - Market size and forecast 2023-2028 ($ million)
- Exhibits82: Data Table on South America - Market size and forecast 2023-2028 ($ million)
- Exhibits83: Chart on South America - Year-over-year growth 2023-2028 (%)
- Exhibits84: Data Table on South America - Year-over-year growth 2023-2028 (%)
- Exhibits85: Chart on Middle East and Africa - Market size and forecast 2023-2028 ($ million)
- Exhibits86: Data Table on Middle East and Africa - Market size and forecast 2023-2028 ($ million)
- Exhibits87: Chart on Middle East and Africa - Year-over-year growth 2023-2028 (%)
- Exhibits88: Data Table on Middle East and Africa - Year-over-year growth 2023-2028 (%)
- Exhibits89: Chart on China - Market size and forecast 2023-2028 ($ million)
- Exhibits90: Data Table on China - Market size and forecast 2023-2028 ($ million)
- Exhibits91: Chart on China - Year-over-year growth 2023-2028 (%)
- Exhibits92: Data Table on China - Year-over-year growth 2023-2028 (%)
- Exhibits93: Chart on US - Market size and forecast 2023-2028 ($ million)
- Exhibits94: Data Table on US - Market size and forecast 2023-2028 ($ million)
- Exhibits95: Chart on US - Year-over-year growth 2023-2028 (%)
- Exhibits96: Data Table on US - Year-over-year growth 2023-2028 (%)
- Exhibits97: Chart on Japan - Market size and forecast 2023-2028 ($ million)
- Exhibits98: Data Table on Japan - Market size and forecast 2023-2028 ($ million)
- Exhibits99: Chart on Japan - Year-over-year growth 2023-2028 (%)
- Exhibits100: Data Table on Japan - Year-over-year growth 2023-2028 (%)
- Exhibits101: Chart on Germany - Market size and forecast 2023-2028 ($ million)
- Exhibits102: Data Table on Germany - Market size and forecast 2023-2028 ($ million)
- Exhibits103: Chart on Germany - Year-over-year growth 2023-2028 (%)
- Exhibits104: Data Table on Germany - Year-over-year growth 2023-2028 (%)
- Exhibits105: Chart on South Korea - Market size and forecast 2023-2028 ($ million)
- Exhibits106: Data Table on South Korea - Market size and forecast 2023-2028 ($ million)
- Exhibits107: Chart on South Korea - Year-over-year growth 2023-2028 (%)
- Exhibits108: Data Table on South Korea - Year-over-year growth 2023-2028 (%)
- Exhibits109: Market opportunity By Geographical Landscape ($ million)
- Exhibits110: Data Tables on Market opportunity By Geographical Landscape ($ million)
- Exhibits111: Impact of drivers and challenges in 2023 and 2028
- Exhibits112: Overview on criticality of inputs and factors of differentiation
- Exhibits113: Overview on factors of disruption
- Exhibits114: Impact of key risks on business
- Exhibits115: Companies covered
- Exhibits116: Matrix on companies position and classification
- Exhibits117: ABB Ltd. - Overview
- Exhibits118: ABB Ltd. - Business segments
- Exhibits119: ABB Ltd. - Key news
- Exhibits120: ABB Ltd. - Key offerings
- Exhibits121: ABB Ltd. - Segment focus
- Exhibits122: Allied Motion Technologies Inc. - Overview
- Exhibits123: Allied Motion Technologies Inc. - Product / Service
- Exhibits124: Allied Motion Technologies Inc. - Key offerings
- Exhibits125: AMETEK Inc. - Overview
- Exhibits126: AMETEK Inc. - Business segments
- Exhibits127: AMETEK Inc. - Key news
- Exhibits128: AMETEK Inc. - Key offerings
- Exhibits129: AMETEK Inc. - Segment focus
- Exhibits130: ASSUN MOTOR Pte Ltd. - Overview
- Exhibits131: ASSUN MOTOR Pte Ltd. - Product / Service
- Exhibits132: ASSUN MOTOR Pte Ltd. - Key offerings
- Exhibits133: ElectroCraft Inc. - Overview
- Exhibits134: ElectroCraft Inc. - Product / Service
- Exhibits135: ElectroCraft Inc. - Key offerings
- Exhibits136: Johnson Electric Holdings Ltd. - Overview
- Exhibits137: Johnson Electric Holdings Ltd. - Business segments
- Exhibits138: Johnson Electric Holdings Ltd. - Key news
- Exhibits139: Johnson Electric Holdings Ltd. - Key offerings
- Exhibits140: Johnson Electric Holdings Ltd. - Segment focus
- Exhibits141: maxon motor AG - Overview
- Exhibits142: maxon motor AG - Product / Service
- Exhibits143: maxon motor AG - Key offerings
- Exhibits144: MinebeaMitsumi Inc. - Overview
- Exhibits145: MinebeaMitsumi Inc. - Business segments
- Exhibits146: MinebeaMitsumi Inc. - Key offerings
- Exhibits147: MinebeaMitsumi Inc. - Segment focus
- Exhibits148: Nidec Corp. - Overview
- Exhibits149: Nidec Corp. - Business segments
- Exhibits150: Nidec Corp. - Key news
- Exhibits151: Nidec Corp. - Key offerings
- Exhibits152: Nidec Corp. - Segment focus
- Exhibits153: North American Electric Inc. - Overview
- Exhibits154: North American Electric Inc. - Product / Service
- Exhibits155: North American Electric Inc. - Key offerings
- Exhibits156: OMRON Corp. - Overview
- Exhibits157: OMRON Corp. - Business segments
- Exhibits158: OMRON Corp. - Key news
- Exhibits159: OMRON Corp. - Key offerings
- Exhibits160: OMRON Corp. - Segment focus
- Exhibits161: Regal Beloit Corp. - Overview
- Exhibits162: Regal Beloit Corp. - Business segments
- Exhibits163: Regal Beloit Corp. - Key offerings
- Exhibits164: Regal Beloit Corp. - Segment focus
- Exhibits165: Schneider Electric SE - Overview
- Exhibits166: Schneider Electric SE - Business segments
- Exhibits167: Schneider Electric SE - Key news
- Exhibits168: Schneider Electric SE - Key offerings
- Exhibits169: Schneider Electric SE - Segment focus
- Exhibits170: Siemens AG - Overview
- Exhibits171: Siemens AG - Business segments
- Exhibits172: Siemens AG - Key news
- Exhibits173: Siemens AG - Key offerings
- Exhibits174: Siemens AG - Segment focus
- Exhibits175: Yaskawa Electric Corp. - Overview
- Exhibits176: Yaskawa Electric Corp. - Business segments
- Exhibits177: Yaskawa Electric Corp. - Key news
- Exhibits178: Yaskawa Electric Corp. - Key offerings
- Exhibits179: Yaskawa Electric Corp. - Segment focus
- Exhibits180: Inclusions checklist
- Exhibits181: Exclusions checklist
- Exhibits182: Currency conversion rates for US$
- Exhibits183: Research methodology
- Exhibits184: Information sources
- Exhibits185: Data validation
- Exhibits186: Validation techniques employed for market sizing
- Exhibits187: Data synthesis
- Exhibits188: 360 degree market analysis
- Exhibits189: List of abbreviations
Technavio has been monitoring the direct current (DC) motor market and is forecast to grow by USD 25355.1 mn during 2023-2028, accelerating at a CAGR of 12.66% during the forecast period. Our report on the direct current (DC) motor market provides a holistic analysis, market size and forecast, trends, growth drivers, and challenges, as well as vendor analysis covering around 25 vendors.
The report offers an up-to-date analysis regarding the current market scenario, the latest trends and drivers, and the overall market environment. The market is driven by rising factory automation and use of industrial robots, increasing use of DC motors in consumer durables, and recent developments in DC motors.
Technavio's direct current (DC) motor market is segmented as below:
| Market Scope | |
|---|---|
| Base Year | 2024 |
| End Year | 2028 |
| Series Year | 2024-2028 |
| Growth Momentum | Accelerate |
| YOY 2024 | 10.99% |
| CAGR | 12.66% |
| Incremental Value | $25355.1mn |
By Power Output
- Less than 750 W
750 W to 375 kW
- More than 375 kW
By Type
- Brushed DC motors
- Brushless DC motors
By Geographical Landscape
- APAC
- North America
- Europe
- South America
- Middle East and Africa
This study identifies the development of sensor-less bldc motor as one of the prime reasons driving the direct current (DC) motor market growth during the next few years. Also, increasing focus on using energy-efficient motors and advances in medical robotics, electrical, and automated guided vehicles will lead to sizable demand in the market.
Technavio presents a detailed picture of the market by the way of study, synthesis, and summation of data from multiple sources by an analysis of key parameters. Our report on the direct current (DC) motor market covers the following areas:
- Direct current (DC) motor market sizing
- Direct current (DC) motor market forecast
- Direct current (DC) motor market industry analysis
Technavio's robust vendor analysis is designed to help clients improve their market position, and in line with this, this report provides a detailed analysis of several leading direct current (DC) motor market vendors that include ABB Ltd., Allied Motion Technologies Inc., Altra Industrial Motion Corp., AMETEK Inc., ASSUN MOTOR Pte Ltd., ElectroCraft Inc., Johnson Electric Holdings Ltd., maxon motor AG, MinebeaMitsumi Inc., Mitsubishi Electric Corp., Nidec Corp., North American Electric Inc., OMRON Corp., Oriental Motor Co. Ltd., Regal Beloit Corp., Rockwell Automation Inc., Schneider Electric SE, Siemens AG, Teknic Inc., and Yaskawa Electric Corp.. Also, the direct current (DC) motor market analysis report includes information on upcoming trends and challenges that will influence market growth. This is to help companies strategize and leverage all forthcoming growth opportunities.
The study was conducted using an objective combination of primary and secondary information including inputs from key participants in the industry. The report contains a comprehensive market and vendor landscape in addition to an analysis of the key vendors.
Technavio presents a detailed picture of the market by the way of study, synthesis, and summation of data from multiple sources by an analysis of key parameters such as profit, pricing, competition, and promotions. It presents various market facets by identifying the key industry influencers. The data presented is comprehensive, reliable, and a result of extensive research - both primary and secondary. Technavio's market research reports provide a complete competitive landscape and an in-depth vendor selection methodology and analysis using qualitative and quantitative research to forecast accurate market growth.
Table of Contents
1 Executive Summary
- 1.1 Market overview
- Executive Summary - Chart on Market Overview
- Executive Summary - Data Table on Market Overview
- Executive Summary - Chart on Global Market Characteristics
- Executive Summary - Chart on Market By Geographical Landscape
- Executive Summary - Chart on Market Segmentation by Power Output
- Executive Summary - Chart on Market Segmentation by Type
- Executive Summary - Chart on Incremental Growth
- Executive Summary - Data Table on Incremental Growth
- Executive Summary - Chart on Company Market Positioning
2 Market Landscape
- 2.1 Market ecosystem
- Parent Market
- Data Table on - Parent Market
- 2.2 Market characteristics
- Market characteristics analysis
- 2.3 Value chain analysis
- Value Chain Analysis
3 Market Sizing
- 3.1 Market definition
- Offerings of companies included in the market definition
- 3.2 Market segment analysis
- Market segments
- 3.3 Market size 2023
- 3.4 Market outlook: Forecast for 2023-2028
- Chart on Global - Market size and forecast 2023-2028 ($ million)
- Data Table on Global - Market size and forecast 2023-2028 ($ million)
- Chart on Global Market: Year-over-year growth 2023-2028 (%)
- Data Table on Global Market: Year-over-year growth 2023-2028 (%)
4 Historic Market Size
- 4.1 Global Direct Current (DC) Motor Market 2018 - 2022
- Historic Market Size - Data Table on Global Direct Current (DC) Motor Market 2018 - 2022 ($ million)
- 4.2 Power Output segment analysis 2018 - 2022
- Historic Market Size - Power Output Segment 2018 - 2022 ($ million)
- 4.3 Type segment analysis 2018 - 2022
- Historic Market Size - Type Segment 2018 - 2022 ($ million)
- 4.4 Geography segment analysis 2018 - 2022
- Historic Market Size - Geography Segment 2018 - 2022 ($ million)
- 4.5 Country segment analysis 2018 - 2022
- Historic Market Size - Country Segment 2018 - 2022 ($ million)
5 Five Forces Analysis
- 5.1 Five forces summary
- Five forces analysis - Comparison between 2023 and 2028
- 5.2 Bargaining power of buyers
- Bargaining power of buyers - Impact of key factors 2023 and 2028
- 5.3 Bargaining power of suppliers
- Bargaining power of suppliers - Impact of key factors in 2023 and 2028
- 5.4 Threat of new entrants
- Threat of new entrants - Impact of key factors in 2023 and 2028
- 5.5 Threat of substitutes
- Threat of substitutes - Impact of key factors in 2023 and 2028
- 5.6 Threat of rivalry
- Threat of rivalry - Impact of key factors in 2023 and 2028
- 5.7 Market condition
- Chart on Market condition - Five forces 2023 and 2028
6 Market Segmentation by Power Output
- 6.1 Market segments
- Chart on Power Output - Market share 2023-2028 (%)
- Data Table on Power Output - Market share 2023-2028 (%)
- 6.2 Comparison by Power Output
- Chart on Comparison by Power Output
- Data Table on Comparison by Power Output
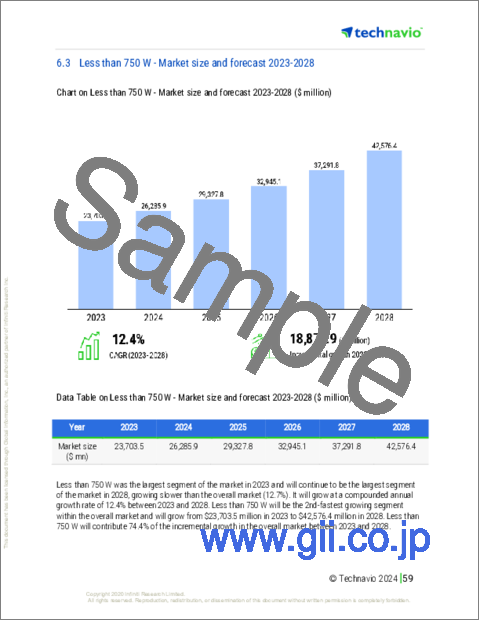
- 6.3 Less than 750 W - Market size and forecast 2023-2028
- Chart on Less than 750 W - Market size and forecast 2023-2028 ($ million)
- Data Table on Less than 750 W - Market size and forecast 2023-2028 ($ million)
- Chart on Less than 750 W - Year-over-year growth 2023-2028 (%)
- Data Table on Less than 750 W - Year-over-year growth 2023-2028 (%)
- 750 W to 375 kW - Market size and forecast 2023-2028
- Chart on 750 W to 375 kW - Market size and forecast 2023-2028 ($ million)
- Data Table on 750 W to 375 kW - Market size and forecast 2023-2028 ($ million)
- Chart on 750 W to 375 kW - Year-over-year growth 2023-2028 (%)
- Data Table on 750 W to 375 kW - Year-over-year growth 2023-2028 (%)
- 6.5 More than 375 kW - Market size and forecast 2023-2028
- Chart on More than 375 kW - Market size and forecast 2023-2028 ($ million)
- Data Table on More than 375 kW - Market size and forecast 2023-2028 ($ million)
- Chart on More than 375 kW - Year-over-year growth 2023-2028 (%)
- Data Table on More than 375 kW - Year-over-year growth 2023-2028 (%)
- 6.6 Market opportunity by Power Output
- Market opportunity by Power Output ($ million)
- Data Table on Market opportunity by Power Output ($ million)
7 Market Segmentation by Type
- 7.1 Market segments
- Chart on Type - Market share 2023-2028 (%)
- Data Table on Type - Market share 2023-2028 (%)
- 7.2 Comparison by Type
- Chart on Comparison by Type
- Data Table on Comparison by Type
- 7.3 Brushed DC motors - Market size and forecast 2023-2028
- Chart on Brushed DC motors - Market size and forecast 2023-2028 ($ million)
- Data Table on Brushed DC motors - Market size and forecast 2023-2028 ($ million)
- Chart on Brushed DC motors - Year-over-year growth 2023-2028 (%)
- Data Table on Brushed DC motors - Year-over-year growth 2023-2028 (%)
- 7.4 Brushless DC motors - Market size and forecast 2023-2028
- Chart on Brushless DC motors - Market size and forecast 2023-2028 ($ million)
- Data Table on Brushless DC motors - Market size and forecast 2023-2028 ($ million)
- Chart on Brushless DC motors - Year-over-year growth 2023-2028 (%)
- Data Table on Brushless DC motors - Year-over-year growth 2023-2028 (%)
- 7.5 Market opportunity by Type
- Market opportunity by Type ($ million)
- Data Table on Market opportunity by Type ($ million)
8 Customer Landscape
- 8.1 Customer landscape overview
- Analysis of price sensitivity, lifecycle, customer purchase basket, adoption rates, and purchase criteria
9 Geographic Landscape
- 9.1 Geographic segmentation
- Chart on Market share By Geographical Landscape 2023-2028 (%)
- Data Table on Market share By Geographical Landscape 2023-2028 (%)
- 9.2 Geographic comparison
- Chart on Geographic comparison
- Data Table on Geographic comparison
- 9.3 APAC - Market size and forecast 2023-2028
- Chart on APAC - Market size and forecast 2023-2028 ($ million)
- Data Table on APAC - Market size and forecast 2023-2028 ($ million)
- Chart on APAC - Year-over-year growth 2023-2028 (%)
- Data Table on APAC - Year-over-year growth 2023-2028 (%)
- 9.4 North America - Market size and forecast 2023-2028
- Chart on North America - Market size and forecast 2023-2028 ($ million)
- Data Table on North America - Market size and forecast 2023-2028 ($ million)
- Chart on North America - Year-over-year growth 2023-2028 (%)
- Data Table on North America - Year-over-year growth 2023-2028 (%)
- 9.5 Europe - Market size and forecast 2023-2028
- Chart on Europe - Market size and forecast 2023-2028 ($ million)
- Data Table on Europe - Market size and forecast 2023-2028 ($ million)
- Chart on Europe - Year-over-year growth 2023-2028 (%)
- Data Table on Europe - Year-over-year growth 2023-2028 (%)
- 9.6 South America - Market size and forecast 2023-2028
- Chart on South America - Market size and forecast 2023-2028 ($ million)
- Data Table on South America - Market size and forecast 2023-2028 ($ million)
- Chart on South America - Year-over-year growth 2023-2028 (%)
- Data Table on South America - Year-over-year growth 2023-2028 (%)
- 9.7 Middle East and Africa - Market size and forecast 2023-2028
- Chart on Middle East and Africa - Market size and forecast 2023-2028 ($ million)
- Data Table on Middle East and Africa - Market size and forecast 2023-2028 ($ million)
- Chart on Middle East and Africa - Year-over-year growth 2023-2028 (%)
- Data Table on Middle East and Africa - Year-over-year growth 2023-2028 (%)
- 9.8 China - Market size and forecast 2023-2028
- Chart on China - Market size and forecast 2023-2028 ($ million)
- Data Table on China - Market size and forecast 2023-2028 ($ million)
- Chart on China - Year-over-year growth 2023-2028 (%)
- Data Table on China - Year-over-year growth 2023-2028 (%)
- 9.9 US - Market size and forecast 2023-2028
- Chart on US - Market size and forecast 2023-2028 ($ million)
- Data Table on US - Market size and forecast 2023-2028 ($ million)
- Chart on US - Year-over-year growth 2023-2028 (%)
- Data Table on US - Year-over-year growth 2023-2028 (%)
- 9.10 Japan - Market size and forecast 2023-2028
- Chart on Japan - Market size and forecast 2023-2028 ($ million)
- Data Table on Japan - Market size and forecast 2023-2028 ($ million)
- Chart on Japan - Year-over-year growth 2023-2028 (%)
- Data Table on Japan - Year-over-year growth 2023-2028 (%)
- 9.11 Germany - Market size and forecast 2023-2028
- Chart on Germany - Market size and forecast 2023-2028 ($ million)
- Data Table on Germany - Market size and forecast 2023-2028 ($ million)
- Chart on Germany - Year-over-year growth 2023-2028 (%)
- Data Table on Germany - Year-over-year growth 2023-2028 (%)
- 9.12 South Korea - Market size and forecast 2023-2028
- Chart on South Korea - Market size and forecast 2023-2028 ($ million)
- Data Table on South Korea - Market size and forecast 2023-2028 ($ million)
- Chart on South Korea - Year-over-year growth 2023-2028 (%)
- Data Table on South Korea - Year-over-year growth 2023-2028 (%)
- 9.13 Market opportunity By Geographical Landscape
- Market opportunity By Geographical Landscape ($ million)
- Data Tables on Market opportunity By Geographical Landscape ($ million)
10 Drivers, Challenges, and Opportunity/Restraints
- 10.1 Market drivers
- 10.2 Market challenges
- 10.3 Impact of drivers and challenges
- Impact of drivers and challenges in 2023 and 2028
- 10.4 Market opportunities/restraints
11 Competitive Landscape
- 11.1 Overview
- 11.2 Competitive Landscape
- Overview on criticality of inputs and factors of differentiation
- 11.3 Landscape disruption
- Overview on factors of disruption
- 11.4 Industry risks
- Impact of key risks on business
12 Competitive Analysis
- 12.1 Companies profiled
- Companies covered
- 12.2 Market positioning of companies
- Matrix on companies position and classification
- 12.3 ABB Ltd.
- ABB Ltd. - Overview
- ABB Ltd. - Business segments
- ABB Ltd. - Key news
- ABB Ltd. - Key offerings
- ABB Ltd. - Segment focus
- 12.4 Allied Motion Technologies Inc.
- Allied Motion Technologies Inc. - Overview
- Allied Motion Technologies Inc. - Product / Service
- Allied Motion Technologies Inc. - Key offerings
- 12.5 AMETEK Inc.
- AMETEK Inc. - Overview
- AMETEK Inc. - Business segments
- AMETEK Inc. - Key news
- AMETEK Inc. - Key offerings
- AMETEK Inc. - Segment focus
- 12.6 ASSUN MOTOR Pte Ltd.
- ASSUN MOTOR Pte Ltd. - Overview
- ASSUN MOTOR Pte Ltd. - Product / Service
- ASSUN MOTOR Pte Ltd. - Key offerings
- 12.7 ElectroCraft Inc.
- ElectroCraft Inc. - Overview
- ElectroCraft Inc. - Product / Service
- ElectroCraft Inc. - Key offerings
- 12.8 Johnson Electric Holdings Ltd.
- Johnson Electric Holdings Ltd. - Overview
- Johnson Electric Holdings Ltd. - Business segments
- Johnson Electric Holdings Ltd. - Key news
- Johnson Electric Holdings Ltd. - Key offerings
- Johnson Electric Holdings Ltd. - Segment focus
- 12.9 maxon motor AG
- maxon motor AG - Overview
- maxon motor AG - Product / Service
- maxon motor AG - Key offerings
- 12.10 MinebeaMitsumi Inc.
- MinebeaMitsumi Inc. - Overview
- MinebeaMitsumi Inc. - Business segments
- MinebeaMitsumi Inc. - Key offerings
- MinebeaMitsumi Inc. - Segment focus
- 12.11 Nidec Corp.
- Nidec Corp. - Overview
- Nidec Corp. - Business segments
- Nidec Corp. - Key news
- Nidec Corp. - Key offerings
- Nidec Corp. - Segment focus
- 12.12 North American Electric Inc.
- North American Electric Inc. - Overview
- North American Electric Inc. - Product / Service
- North American Electric Inc. - Key offerings
- 12.13 OMRON Corp.
- OMRON Corp. - Overview
- OMRON Corp. - Business segments
- OMRON Corp. - Key news
- OMRON Corp. - Key offerings
- OMRON Corp. - Segment focus
- 12.14 Regal Beloit Corp.
- Regal Beloit Corp. - Overview
- Regal Beloit Corp. - Business segments
- Regal Beloit Corp. - Key offerings
- Regal Beloit Corp. - Segment focus
- 12.15 Schneider Electric SE
- Schneider Electric SE - Overview
- Schneider Electric SE - Business segments
- Schneider Electric SE - Key news
- Schneider Electric SE - Key offerings
- Schneider Electric SE - Segment focus
- 12.16 Siemens AG
- Siemens AG - Overview
- Siemens AG - Business segments
- Siemens AG - Key news
- Siemens AG - Key offerings
- Siemens AG - Segment focus
- 12.17 Yaskawa Electric Corp.
- Yaskawa Electric Corp. - Overview
- Yaskawa Electric Corp. - Business segments
- Yaskawa Electric Corp. - Key news
- Yaskawa Electric Corp. - Key offerings
- Yaskawa Electric Corp. - Segment focus
13 Appendix
- 13.1 Scope of the report
- 13.2 Inclusions and exclusions checklist
- Inclusions checklist
- Exclusions checklist
- 13.3 Currency conversion rates for US$
- Currency conversion rates for US$
- 13.4 Research methodology
- Research methodology
- 13.5 Data procurement
- Information sources
- 13.6 Data validation
- Data validation
- 13.7 Validation techniques employed for market sizing
- Validation techniques employed for market sizing
- 13.8 Data synthesis
- Data synthesis
- 13.9 market analysis
- market analysis
- 13.10 List of abbreviations
- List of abbreviations

